My Account
My Slides
Search by Category
Templates
View All Templates
Download Template Slides
Leave Feedback
Login
Logout
Get Started
Browse all Slides
Browse all Slides
Create a FREE Account
Instant access to 1,000+ real slides from top companies like McKinsey, BCG, Goldman Sachs, Google and many more!
First Name
Last Name
Email
Password
I agree to all
Terms & Privacy Policy
Thank you! Your submission has been received!
Oops! Something went wrong while submitting the form.
Have an account?
Sign in
Saved Slides
The slide has a column chart with multiple stages indicated for different financial factors affecting RoCET1, alongside key levers for achieving the target.
Financial Performance
Financial Services
This slide outlines the steps and key financial levers required to achieve a 15% return on common equity tier 1 capital by 2026, detailing cost efficiencies and optimizations.
RoCET1, financial levers, cost efficiencies, optimization
Mixed Chart
UBS
Saved
Slide features three smartphone screens showing different user interface designs of a new app, set against a pink background with three bullet points highlighting key features.
Technology and Digital Transformation
Financial Services
Discusses the development of a new mobile application aimed at enhancing user engagement, with a focus on daily insights and utility, thereby increasing revenue potential through user interaction.
mobile app, user engagement, daily insights, revenue growth, technology
Mixed Chart
Barclays
Saved
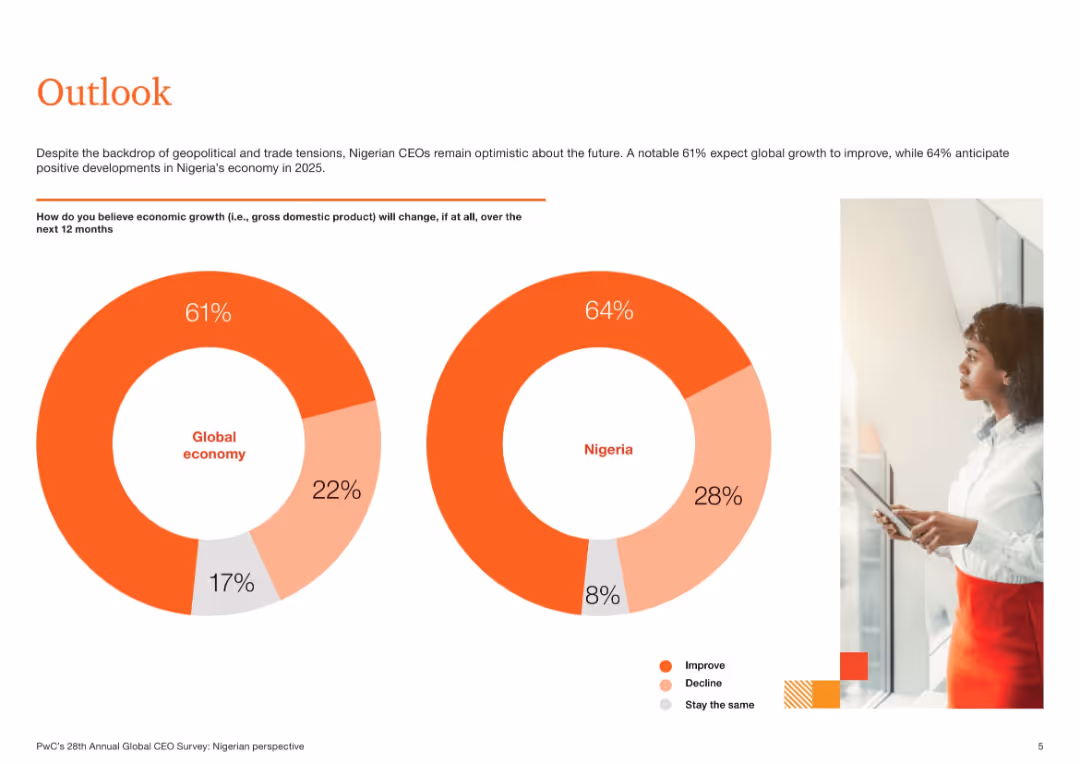
Two donut charts comparing CEO expectations for economic growth globally and in Nigeria. Orange and white minimalist color scheme with right-aligned image of a businesswoman.
Market Analysis and Trends
Professional Services
This slide reveals optimistic economic sentiment among Nigerian CEOs, with 64% expecting national growth and 61% expecting global growth in 2025. It conveys the forward-looking expectations regarding GDP change and portrays a positive economic outlook despite global tensions.
economic outlook, Nigeria, global growth, CEO sentiment, GDP, 2025, optimism
Single Chart
PwC/Strategy&
Saved
The slide includes icons and brief descriptions of five environmental services sub-sectors: waste and recycling, specialty waste services, environmental consulting, response and restoration, and industrial in-plant services.
Industry Overview
Environmental Services & Sustainability
The slide provides an overview of the five sub-sectors within environmental services, summarizing the key services and areas of focus for each sub-sector.
Environmental services, waste management, specialty waste, consulting, response and restoration, industrial services
Pillar
LEK
Saved
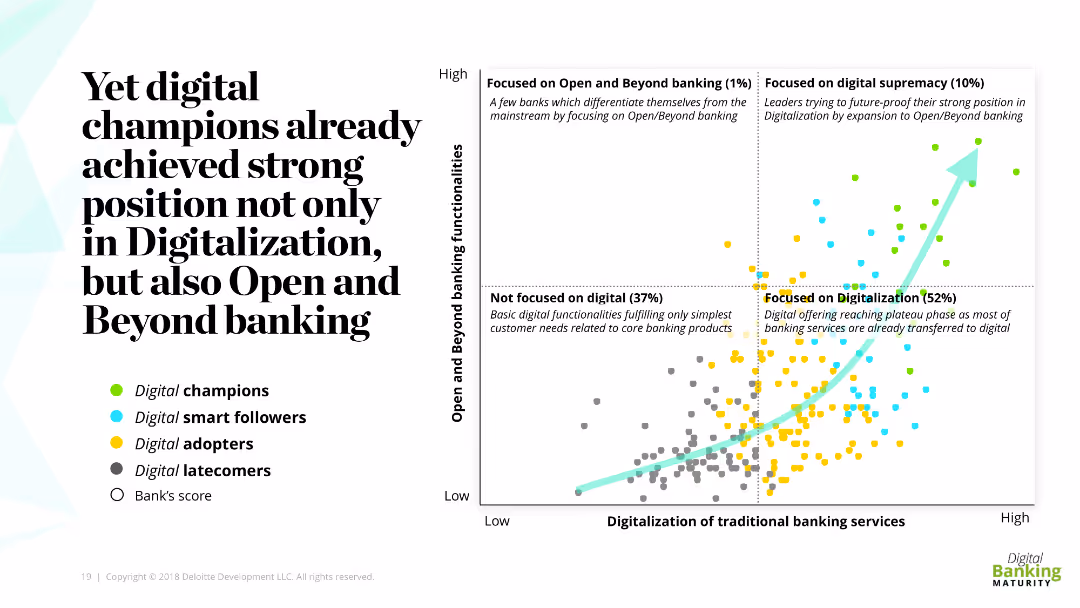
The slide contains a scatter plot graph showing banks' focus on digitalization and open banking functionalities. Different colors represent digital champions, smart followers, adopters, and latecomers. The slide also includes descriptive text on digital champions' positions.
Competitive Landscape
Financial Services
This slide highlights the strong position achieved by digital champions in both digitalization and open banking functionalities. It categorizes banks based on their focus and digital capabilities, showing leaders in digital supremacy and open banking.
digital champions, open banking, digitalization, competitive landscape, banks
Mixed Chart
Deloitte
Saved
The slide features multiple tables, bar graphs and column charts, detailing quarterly financial metrics like revenues, assets under management, and net flows. The layout is clean with clearly labeled sections and contrasting colors to distinguish different data points.
Financial Performance
Financial Services
This slide presents Q4 2023 financial results for a private banking division, highlighting revenue growth and net asset flows. It is used to analyze financial health and performance trends.
banking, financial results, revenue growth, asset management, Q4 2023
Multiple Chart
Deutsche Bank
Saved
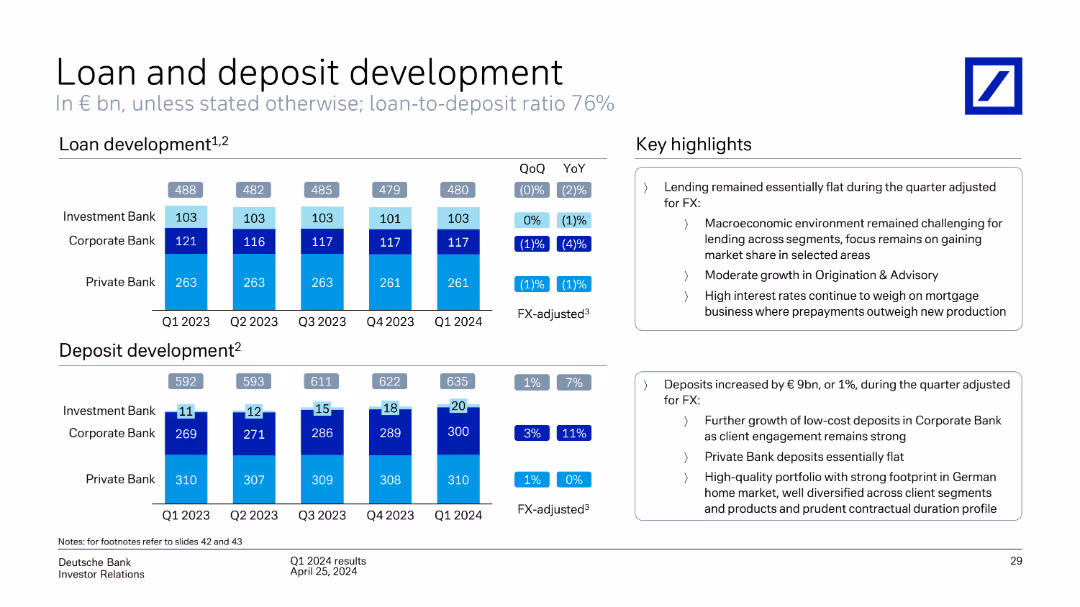
This slide features two sets of column charts showing loan and deposit development across different business divisions (Investment Bank, Corporate Bank, Private Bank) for Q1 2023 to Q1 2024.
Market Analysis and Trends
Financial Services
The slide presents Deutsche Bank's loan and deposit development from Q1 2023 to Q1 2024, highlighting changes in volumes across the Investment, Corporate, and Private Banks. It includes key highlights and FX-adjusted figures.
loan development, deposit development, business divisions, volumes, Deutsche Bank, Q1 2024
Multiple Chart
Deutsche Bank
Saved
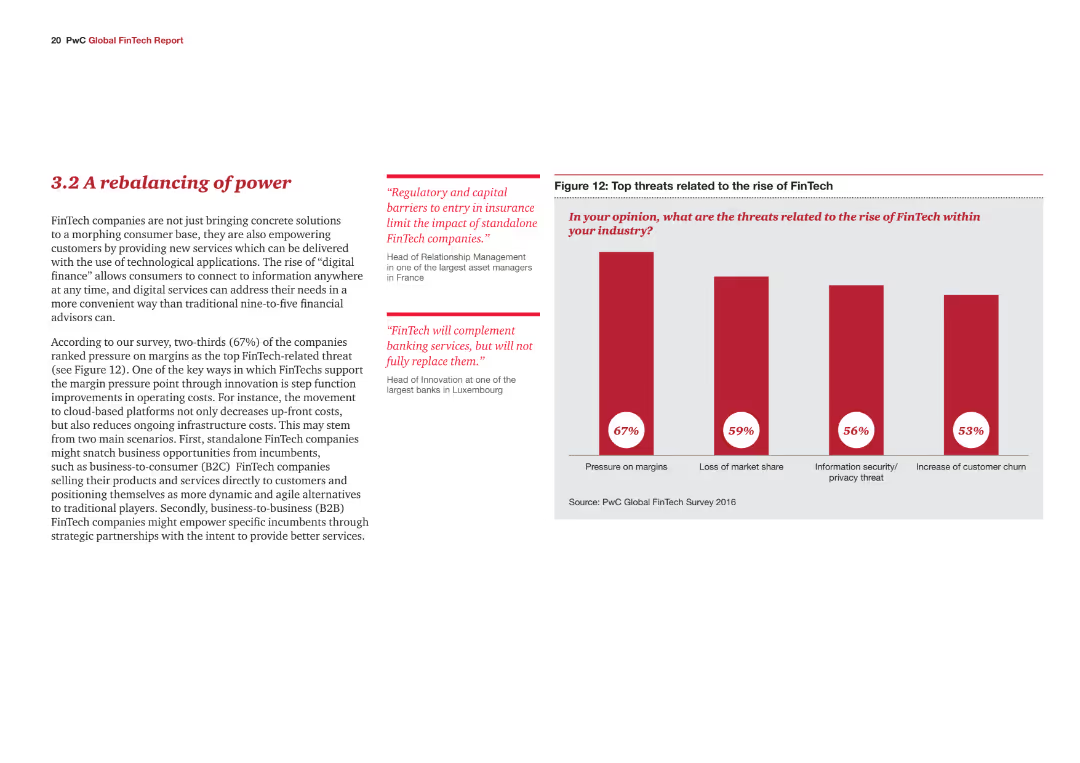
The slide contains a column chart and text. The chart outlines top opportunities related to the rise of FinTech.
Market Analysis and Trends
Financial Services
The slide highlights opportunities that FinTech presents to incumbents, such as cost reduction and improved customer retention.
FinTech, opportunities, cost reduction, customer retention, financial services
Mixed Chart
PwC/Strategy&
Saved
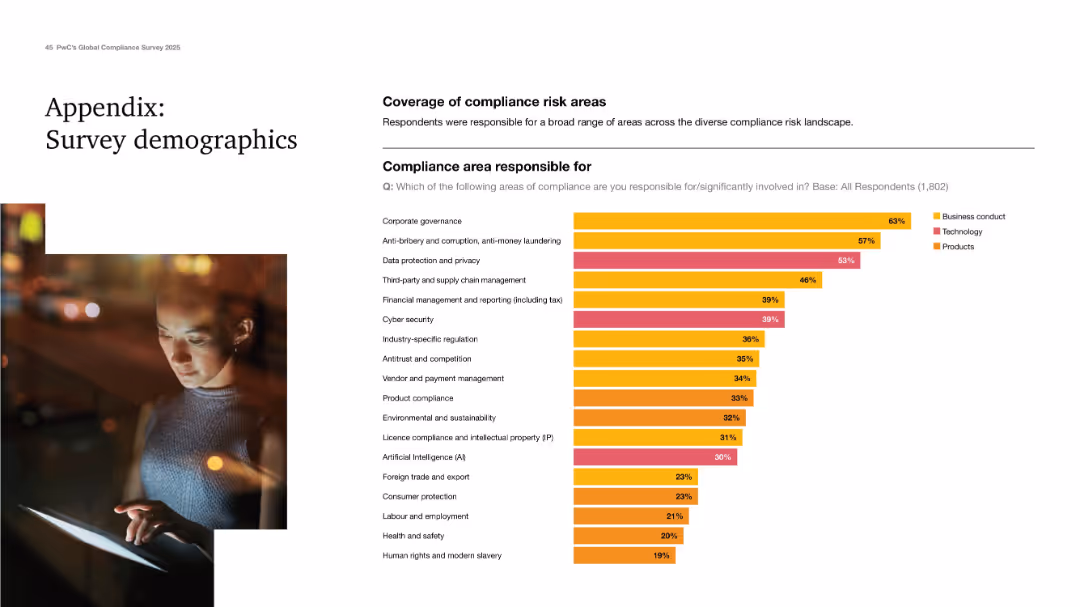
Clean design with a demographic chart showing responsibility across compliance areas.
Industry Overview
Professional Services
Final appendix slide showing the range of compliance areas respondents are responsible for. Corporate governance, anti-bribery, and data privacy top the list. Categorized into business conduct, tech, and product areas. Demonstrates the breadth of responsibilities handled by compliance professionals today.
survey demographics, compliance areas, governance, data privacy, AI
Mixed Chart
PwC/Strategy&
Saved
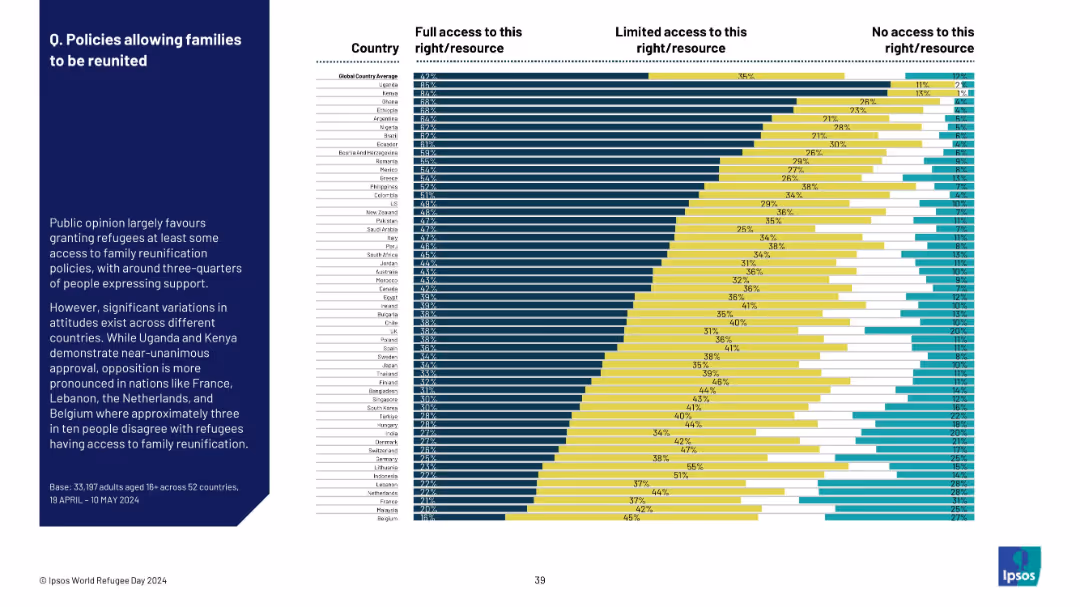
Bar chart by country, showing support levels for family reunification policies; full/limited/no access.
Regulatory and Compliance
Government & Public Sector
This slide shows public support for refugee family reunification policies. Uganda and Kenya display strong support, while countries like Belgium, Malaysia, and France show notable opposition to such access.
refugees, family reunification, access rights, support levels, policy perception, public sentiment, Ipsos
Mixed Chart
IPSOS
Saved
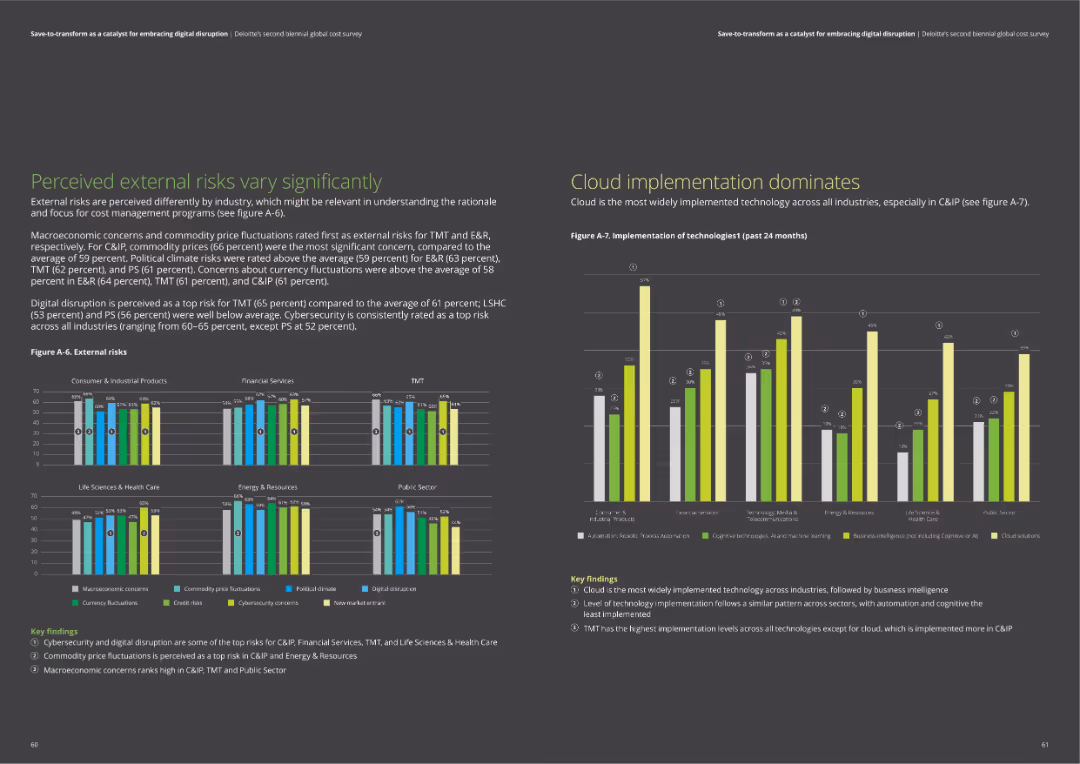
The slide includes bar charts comparing external risks across industries and a chart on the implementation of technologies like cloud and business intelligence.
Risk Assessment and Management
Professional Services
The slide examines perceived external risks such as macroeconomic concerns and digital disruption. It also highlights the widespread implementation of cloud technology and business intelligence solutions across industries.
external risks, cloud technology, business intelligence, macroeconomic concerns, digital disruption
Multiple Chart
Deloitte
Saved
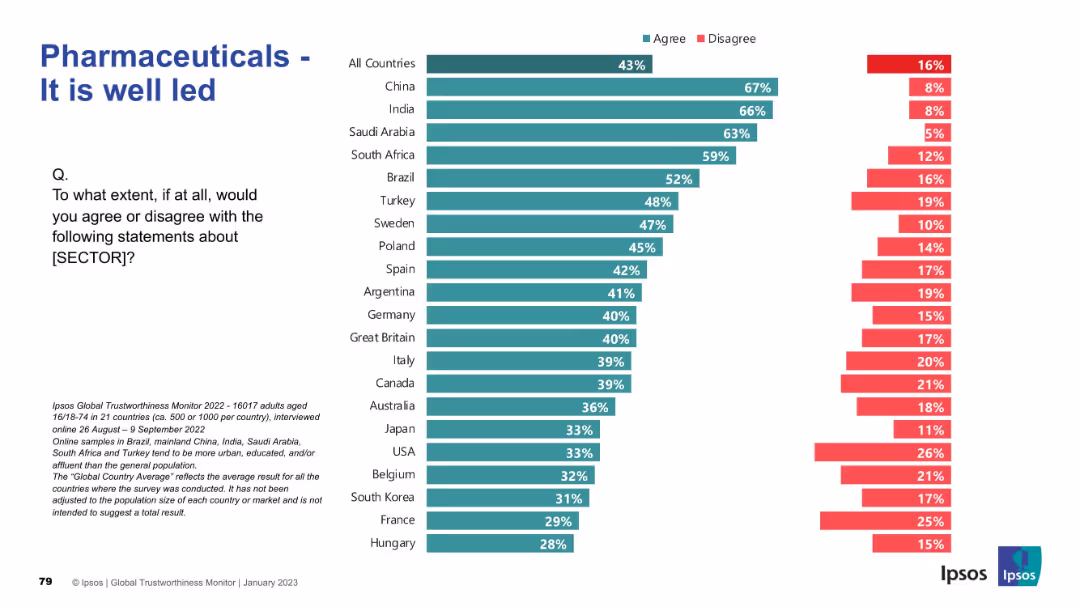
Teal/red bar chart by country on leadership perception. Layout consistent with previous slides: title left, chart right, question included.
Market Analysis and Trends
Healthcare & Pharmaceuticals
The slide assesses leadership perceptions in the pharmaceutical sector. China, India, and Saudi Arabia lead in agreement about strong leadership, while Japan, Hungary, and France score lowest. Global sentiment is mixed, reflecting trust gaps in governance.
leadership, governance, public trust, survey, Ipsos, pharma sector, healthcare, country comparison, management, global perception
Mixed Chart
IPSOS
Saved
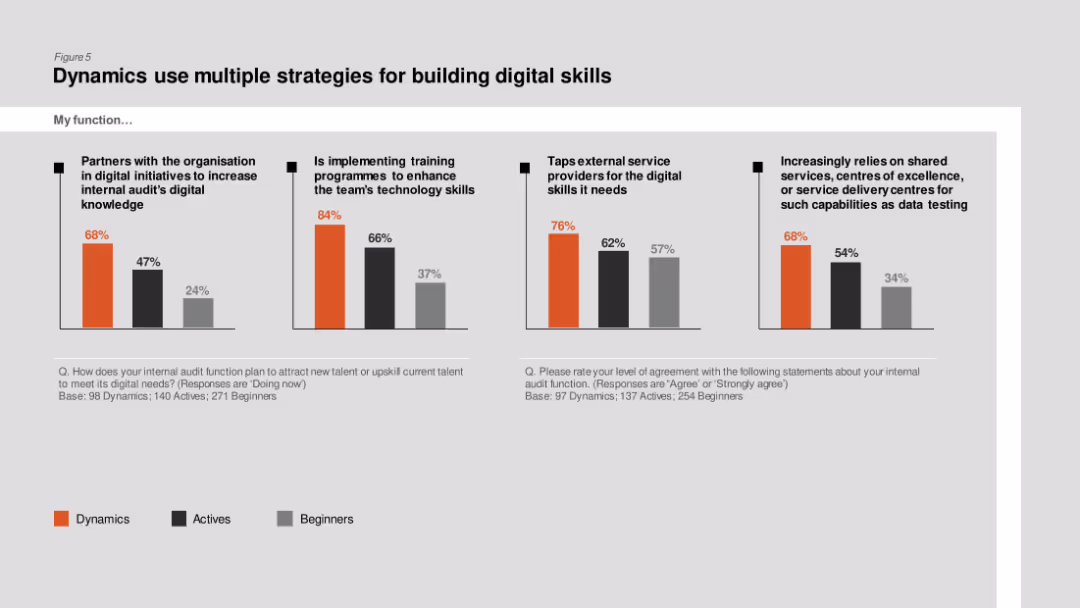
Column charts comparing strategies like partnerships, training programs, and external service providers for building digital skills among Dynamics, Actives, and Beginners.
Human Resources and Talent Management
Professional Services
The slide details various strategies used by internal audit functions to enhance digital skills, showing higher implementation of training programs and partnerships in Dynamics.
Digital skills, training programs, internal audit, partnerships, Dynamics
Multiple Chart
PwC/Strategy&
Saved
The slide uses four columns to depict investments, governance, steering, and transparency, each with examples like client committees and scorecards. The bottom section reinforces the commitment to protecting franchise and reputation.
Regulatory and Compliance
Financial Services
The slide focuses on the importance of risk management and compliance, showing investments in support, governance through client committees, steering via scorecards, and transparency with a consolidated client view. The goal is to facilitate sustainable growth.
risk management, compliance, governance, transparency, investments
Pillar
Credit Suisse
Saved
The slide features tables, regional maps, and icons. It visually separates information by countries and key international alliances.
Market Analysis and Trends
Government & Public Sector
Analyzes the strengthening of Australia's international alliances in the Indo-Pacific, influencing Australia's battery industries.
Indo-Pacific, alliances, Australia, trade agreements
Table
Accenture
Saved
This slide presents line graphs tracking the mobility trends related to workplaces, public transit, and retail & recreation areas across multiple countries (US, Sweden, Italy, Germany, South Korea, Japan). Each country's trends are plotted on a distinct graph with lines representing different mobility aspects, using a consistent color code. The graphs are annotated with key events such as lockdowns, making it easier to correlate changes in mobility with pandemic-related restrictions. The layout facilitates cross-country comparisons.
Operational Efficiency
Retail & E-commerce
Analyzing changes in mobility patterns can help understand the economic and operational impact of COVID-19 on different sectors. This slide offers insights into how mobility levels correlate with lockdown measures and the gradual reopening of economies. It is particularly useful for retail and e-commerce industries to gauge consumer behavior changes and plan logistics or marketing strategies accordingly. The data can guide decisions on store reopenings, staff allocations, and inventory management based on regional consumer mobility trends.
mobility, COVID-19, retail, public transit, workplaces, lockdown, reopening, consumer behavior
Multiple Chart
BCG
Saved
The slide features a pie chart breaking down revenue by market sectors, with a list of specific client types.
Investment Analysis
Professional Services
Shows revenue sources by sector, focusing on defense, civil, global, and intelligence markets.
Customer base, revenue distribution, defense, civil, intelligence, global markets
Single Chart
Booz Allen Hamilton
Saved
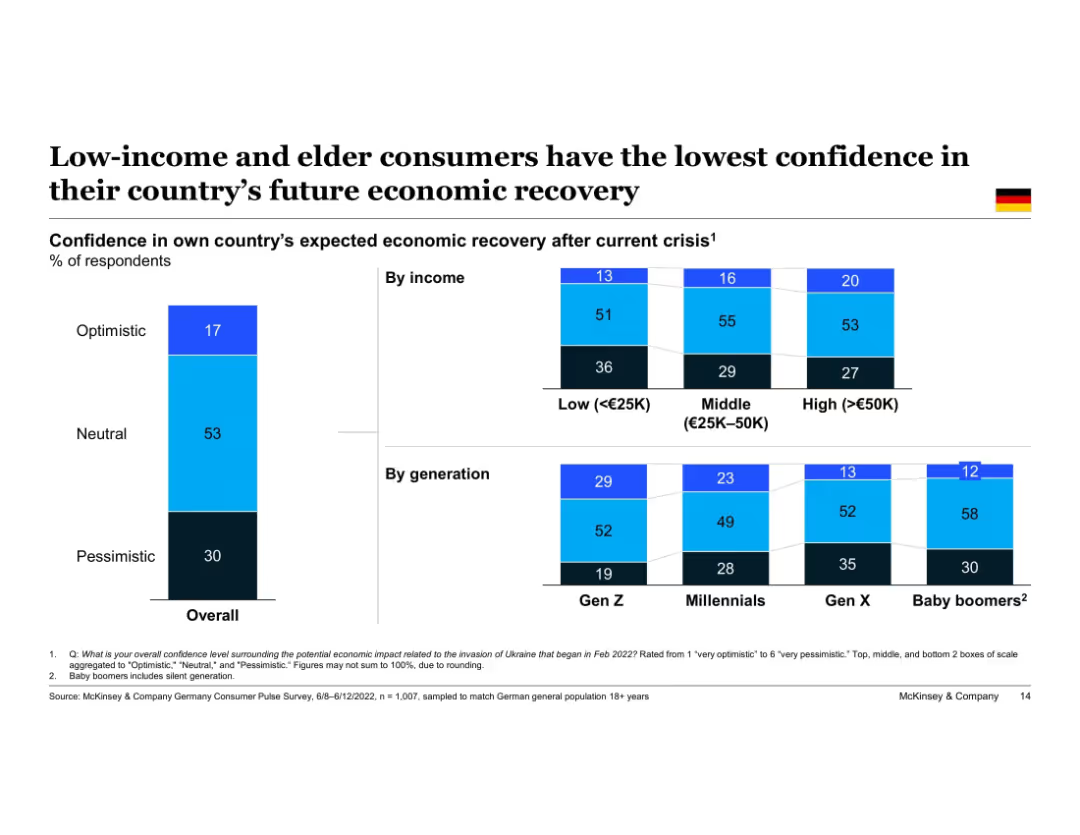
Vertical stacked bar chart showing Germany’s overall optimism by income and generation. Three confidence levels visualized for each group. Left column shows national average, followed by columns split by income level and age cohort.
Customer and Market Segmentation
Financial Services
This slide highlights disparities in economic recovery confidence among different German demographic groups. Low-income and Baby Boomer respondents are most pessimistic, whereas higher-income and younger generations express relatively greater optimism about future recovery.
consumer confidence, demographics, Germany, income groups, generations, Gen Z, Baby Boomers, pessimism, optimism
Single Chart
McKinsey
Saved
This slide features a bar chart illustrating the total market opportunity by various industries with an overall market estimate at the top.
Market Analysis and Trends
Technology & Software
The slide outlines the vast market opportunity for Gartner, with a bar chart showing potential growth in different sectors such as technology and supply chain.
Market, Opportunity, Growth, Technology, Gartner
Single Chart
Gartner
Saved
This slide presents a complex layout with a mix of text boxes, icons, and background images, highlighting key mergers and acquisitions (M&A) activities and their strategic importance. It includes timeline elements and bullet-point lists to describe major deals and steps within the company's strategy. The slide has the Michelin logo and uses the company's color scheme.
Strategic Planning
Industrial & Manufacturing
This slide reviews major M&A activities and strategic steps taken by Michelin, focusing on enhancing its portfolio in line with the "Michelin in Motion 2030 strategy." It is likely used in strategic business meetings or investor relations presentations to discuss company growth and strategic direction.
M&A, strategy, Michelin, portfolio, deals, innovation, acquisition, growth, planning, management
Pillar
Morgan Stanley
Saved
Contains six line graphs showing COVID-19 daily new cases for each country, with date markers on the x-axis and cases on the y-axis. The background is white and the graphs are in blue.
Risk Assessment and Management
Healthcare & Pharmaceuticals
Reflecting on the challenges of 2020, this slide shows the trend of COVID-19 cases across six Southeast Asian countries, revealing the pandemic's impact on the region.
pandemic, COVID-19, Southeast Asia, daily cases, line graph, uncertainty, 2020
Multiple Chart
Bain
Saved
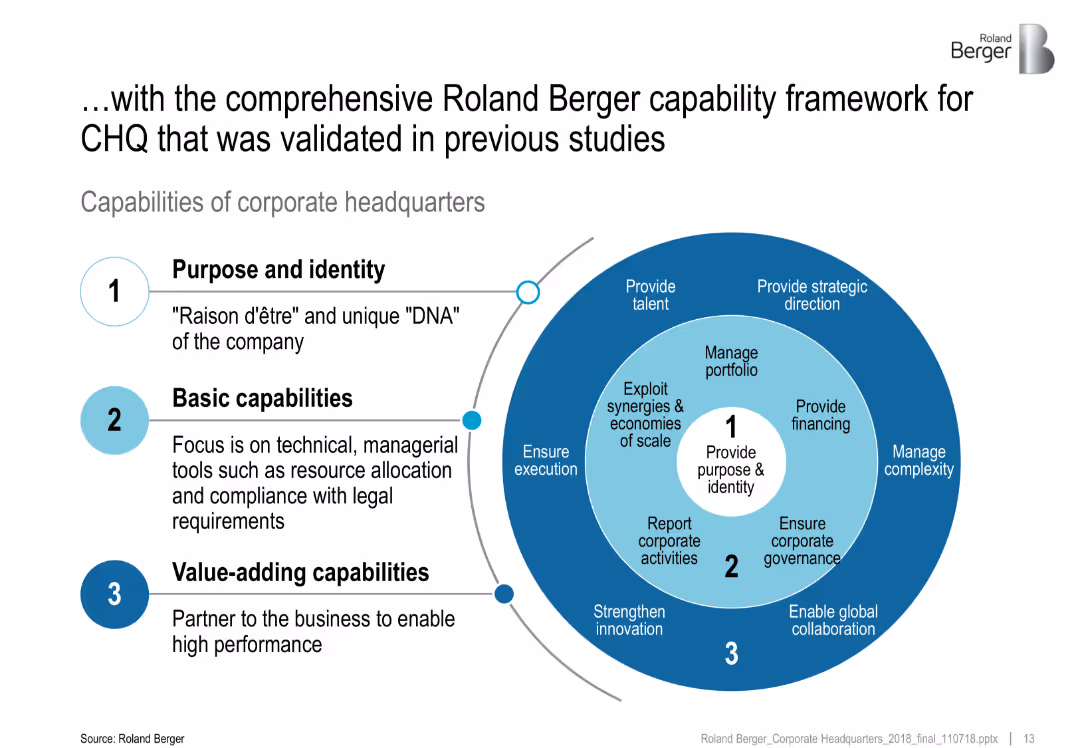
Concentric circular diagram with three nested levels; left-aligned text explains each layer’s function
Organizational Structure and Change
Professional Services
This slide presents Roland Berger's validated capability framework for corporate headquarters (CHQ), categorized into three levels: Purpose and Identity, Basic Capabilities, and Value-Adding Capabilities. Each level is defined by its role and examples of core functions.
corporate headquarters, framework, value-adding, capabilities, execution, structure
Framework
Roland Berger
Saved
Table displaying generational comparison of reasons for switching retailers; color-coded differences from average and German flag included
Customer and Market Segmentation
Retail & E-commerce
This slide breaks down the generational drivers for switching grocery retailers in Germany. All generations cite price and value as key drivers. Baby boomers prioritize accessibility and promotions, while Gen Z is more influenced by values and ethical stances. The Ukraine conflict was least influential across all groups.
generational comparison, price sensitivity, retailer switching, value for money, promotions, Gen Z, baby boomers, Germany
Multiple Chart
McKinsey
Saved
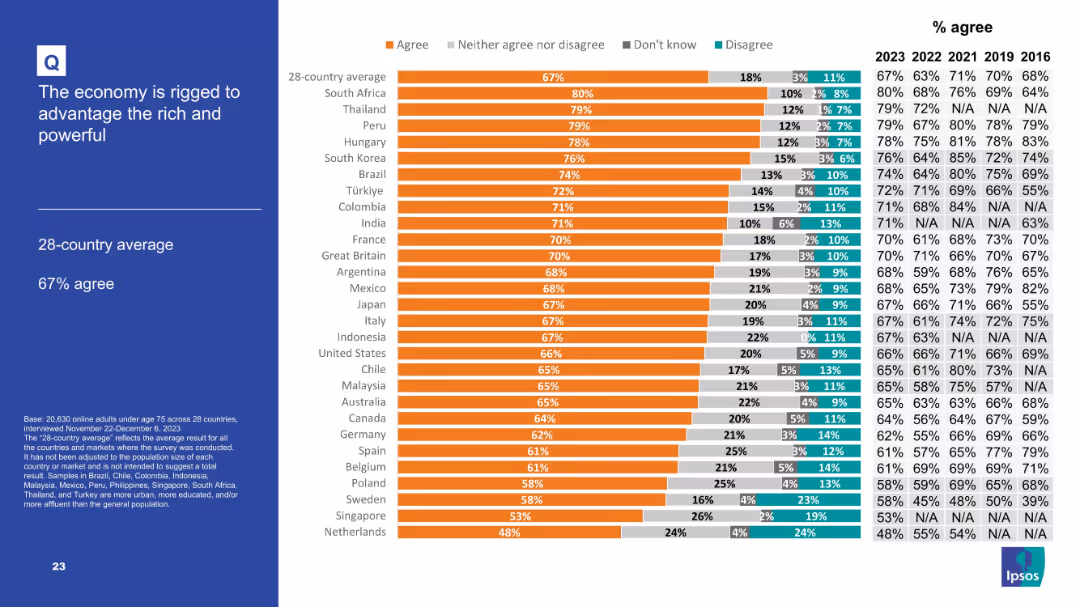
Horizontal bar chart with segmented agreement levels; sidebar with title and average.
Market Analysis and Trends
Financial Services
Displays agreement levels with the statement that the economy benefits the rich and powerful. The 28-country average is 67%. South Africa, Thailand, and Peru show the highest agreement, indicating widespread skepticism about economic fairness.
economy, inequality, rigged system, public opinion, economic perception
Mixed Chart
IPSOS
Saved
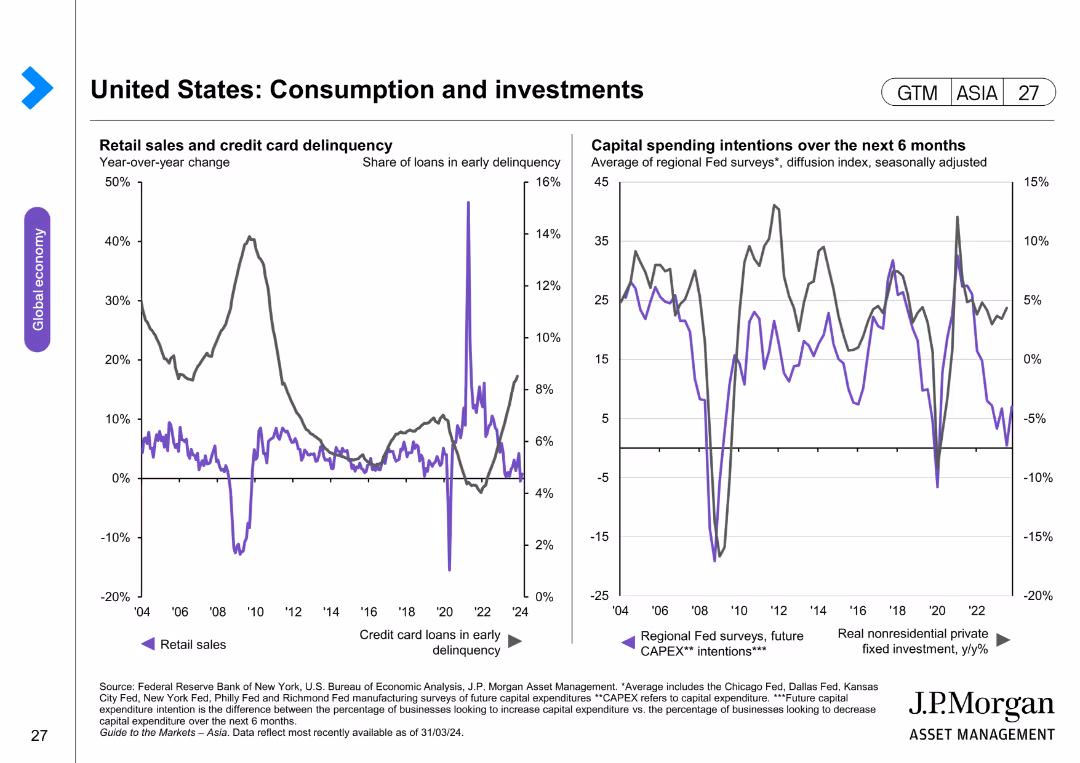
The slide features two line charts: one showing retail sales and credit card delinquency, and another showing capital spending intentions. The layout is moderately complex.
Market Analysis and Trends
Financial Services
This slide evaluates trends in retail sales, credit card delinquencies, and capital spending intentions over time, highlighting significant changes and patterns.
retail sales, credit card delinquency, capital spending, economic trends, consumer behavior
Multiple Chart
JP Morgan
Saved
Previous
Next
If nothing, comes up, please save your slides first
Create a FREE account to continue browsing
Receive Instant Access to 1,000+ slides from companies like McKinsey, Google, and Goldman Sachs
First Name
Last Name
Email
Password
I agree to all
Terms & Privacy Policy
Thank you! Your submission has been received!
Oops! Something went wrong while submitting the form.
Have an account?
Sign in
Column Chart
Heatmap
Chevron
Org Chart
Infographic
Callouts
Timeline
List
Graphic
Picture
Process Flow
Diagram
Paragraph
Map
Table
Framework
Subtitle
Takeaway Box
Icon
Other Chart
Radar Chart
Waterfall Chart
Mekko Chart
Pie Chart
Scatter Plot
Line Chart
Bar chart
Bullet points