My Account
My Slides
Search by Category
Templates
View All Templates
Download Template Slides
✦ AI Search
Feedback
Login
Logout
Get Started
Browse all Slides
Browse all Slides
Create a FREE Account
Instant access to 1,000+ real slides from top companies like McKinsey, BCG, Goldman Sachs, Google and many more!
First Name
Last Name
Email
Password
I agree to all
Terms & Privacy Policy
Thank you! Your submission has been received!
Oops! Something went wrong while submitting the form.
Have an account?
Sign in
Saved Slides
Product-focused layout with brand positioning, global sales bar chart, and future growth perspectives. Text-heavy with bullets outlining clinical strength and market opportunity. Uses blue tones and brand color.
Product and Service Analysis
Healthcare & Pharmaceuticals
Highlights Kerendia’s role in treating CKD and heart failure, emphasizing clinical differentiation and market potential. Sales growth is driven by indications in underpenetrated markets, with plans to expand into broader CKD spectrum and heart failure populations, particularly in China and the US.
Kerendia, CKD, heart failure, T2D, pharma launch, clinical growth, Bayer
Mixed Chart
JP Morgan
Saved
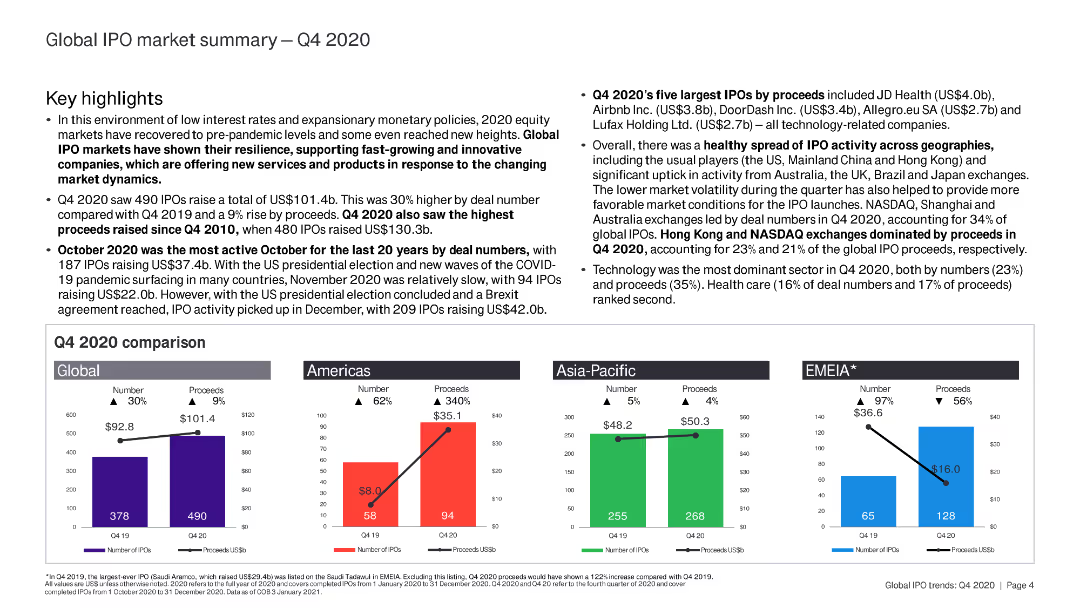
The slide is text-heavy with key highlights and comparative analysis of IPO markets in Q4 2020. It includes small bar charts for regional comparisons.
Market Analysis and Trends
Financial Services
This slide summarizes the global IPO market in Q4 2020, covering key highlights, largest IPOs, and regional analysis.
IPO, Q4 2020, global market, key highlights, regional analysis
Multiple Chart
EY
Saved
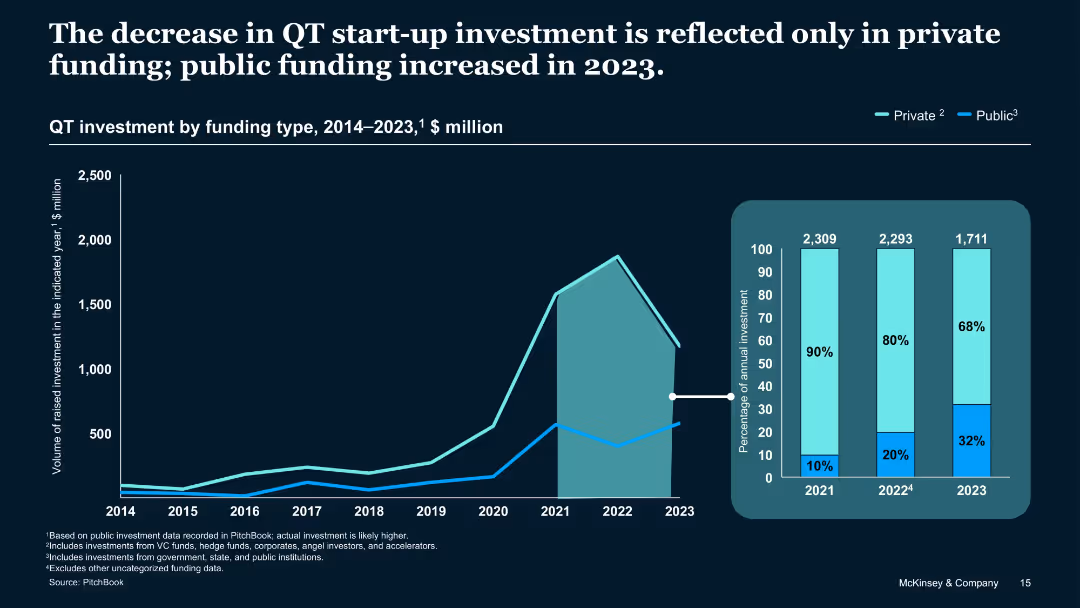
Area chart and stacked bar chart illustrating funding sources over time
Investment Analysis
Artificial Intelligence
Shows the 2023 decline in QT investment was primarily in private funding, while public investment increased. Public funding grew to 32% of total share. Annotations highlight recent shifts in the funding composition.
Public vs private, 2023 funding mix, investment breakdown, VC, trends
Single Chart
McKinsey
Saved
Slide with a process timeline and funding source breakdown, including bar and line graphics to represent stages from pre-commercial development to market roll-out.
Market Analysis and Trends
Energy & Utilities
Discusses the EU’s support mechanisms for hydrogen technology through various funding stages, from proof of concept to market readiness, highlighting different EU funding sources.
EU, Funding, Hydrogen, Innovation, Scale-up
Linear Flow
McKinsey
Saved
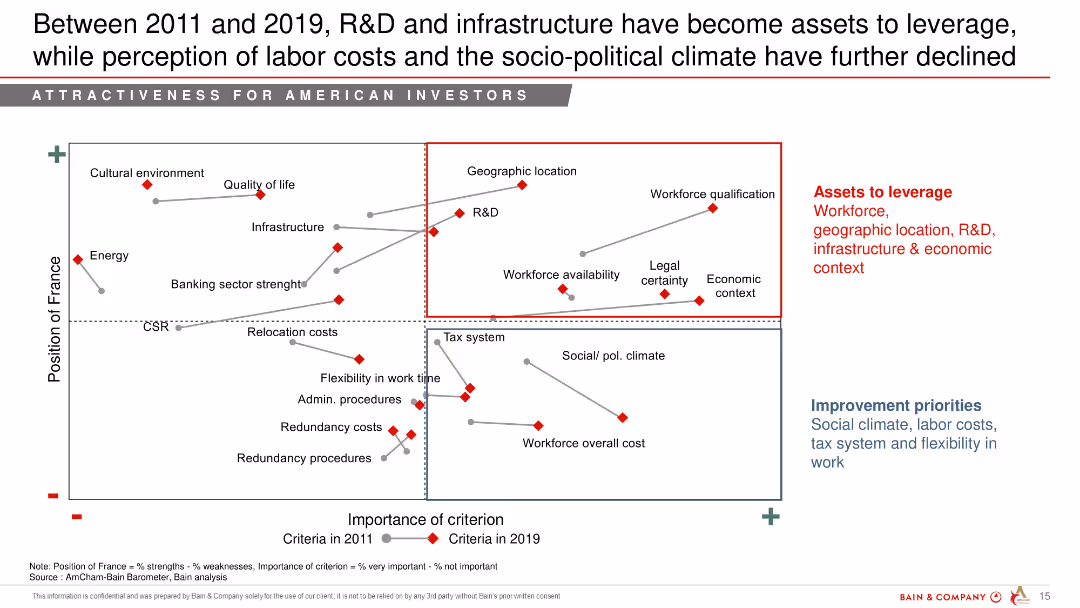
Scatter plot comparing the importance of various criteria for American investors in France between 2011 and 2019.
Strategic Planning
Professional Services
This slide shows the shift in American investors' perceptions of France's attractiveness criteria from 2011 to 2019, focusing on R&D, infrastructure, and labor costs.
R&D, infrastructure, labor costs, socio-political climate, perception, American investors
Mixed Chart
Bain
Saved
Table with projects for delivery years and their values, client names. Column chart for net order book by segments. List of projects under execution. Company logo.
Operational Efficiency
Energy & Utilities
Details robust order book valued at ~$18B, upcoming project deliveries, and the segmentation of net order book. Used for showcasing financial strength and operational capacity.
order book, projects, net value, clients, execution, rigs, floaters, financial strength
Mixed Chart
Morgan Stanley
Saved
This slide has a dual-topic layout with text summaries. It discusses the need for business portfolio adjustments and activism risk management, with a straightforward design for clear communication.
Strategic Planning
Professional Services
Discusses the importance for companies to adapt their business portfolios and address activism risks, useful in strategic business planning sessions.
Portfolio Management, Activism Risk, Business Strategy, Acquisitions, Divestitures, Market Adaptation, Risk Mitigation, Business Fundamentals, Strategic Decisions, Investor Advice
Text Only
BCG
Saved
The slide displays a column chart side by side, one showing a decrease in 'cost to serve per CCB household' and another with icons and text highlighting efficiency examples.
Operational Efficiency
Financial Services
Focuses on JP Morgan's reduction in customer service costs and enhancements in operational efficiency, marked by self-service and workforce transformation. It targets an audience interested in operational improvements and cost management.
Self-Service, Operational Efficiency, Cost Reduction, Workforce Transformation
Mixed Chart
JP Morgan
Saved
The slide contains two charts: a bar chart showing the price-to-earnings ratios for various Latin American countries and a line chart depicting earnings per share (EPS) trends. The charts use multiple colors for different countries and time periods.
Market Analysis and Trends
Financial Services
It compares valuations and earnings across Latin American countries, providing insights into market performance and potential investment opportunities in these regions.
Latin America, valuations, earnings, price-to-earnings, EPS
Multiple Chart
JP Morgan
Saved
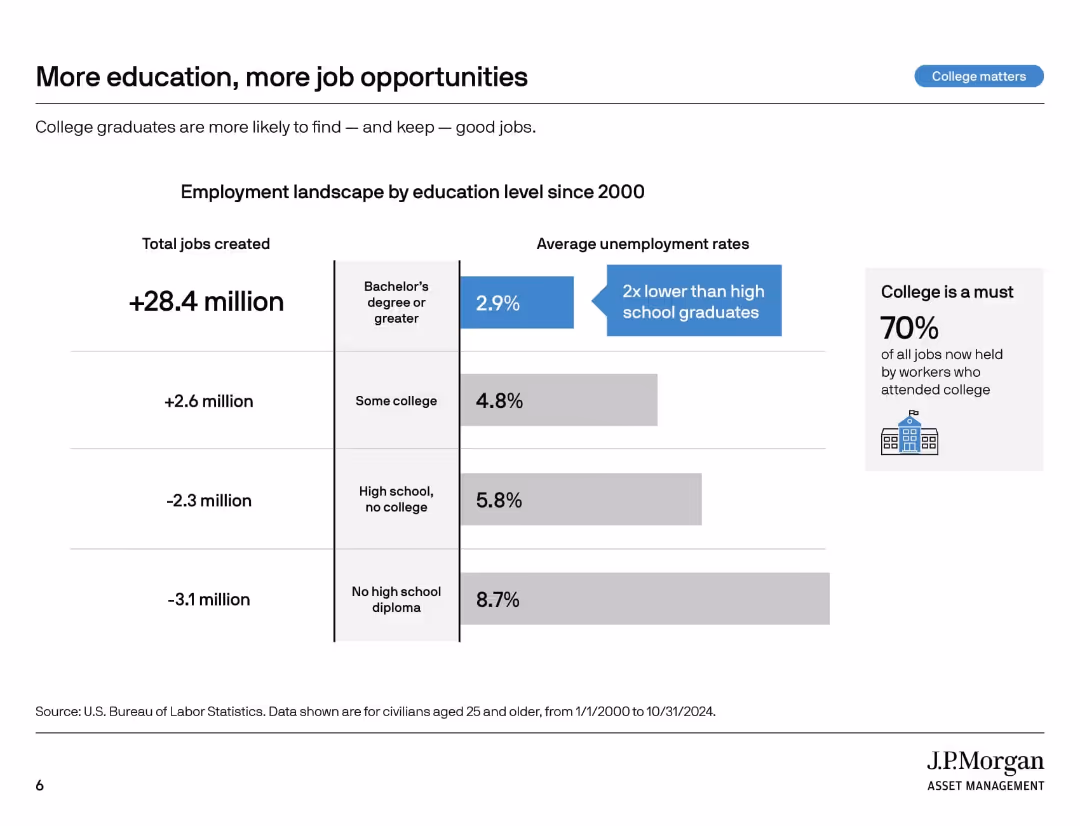
Vertical segmented graphic with job creation and unemployment stats by education level. Sidebar emphasizes importance of college.
Market Analysis and Trends
Education & Training
This slide outlines employment and unemployment rates since 2000 by education level. College graduates have gained more jobs and show lower unemployment. The takeaway is that higher education improves job security and access to employment.
employment stats, college impact, unemployment rates, education levels, labor market, job creation, job opportunities, workforce trends, higher education
Mixed Chart
JP Morgan
Saved
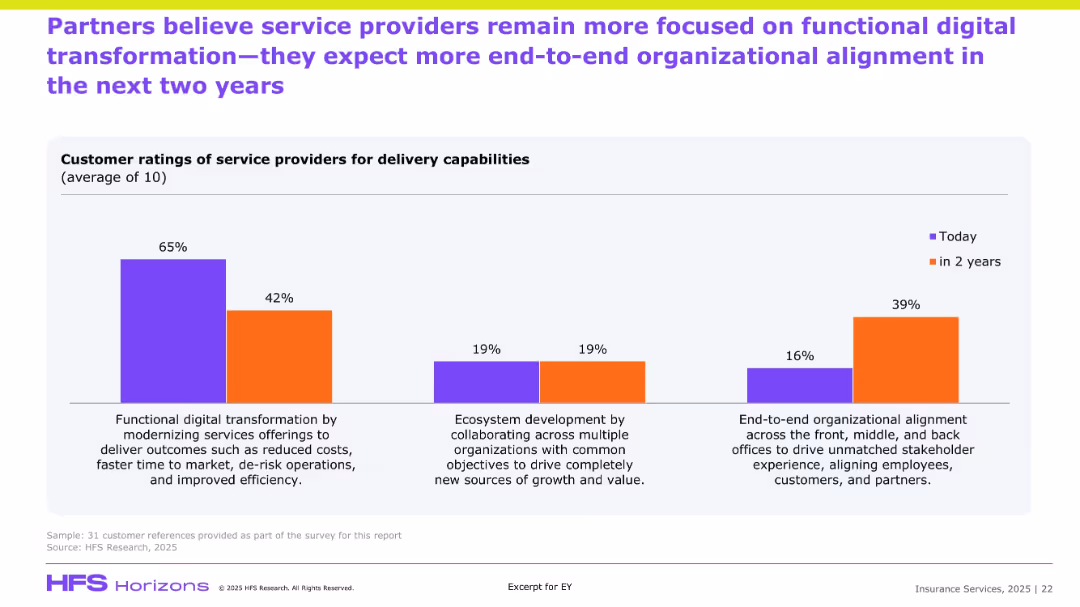
Similar bar chart format to previous slide but focused on partner perceptions; compares current and future priorities in service delivery.
Customer and Market Segmentation
Financial Services
Partners echo a sentiment similar to clients, indicating a strong current focus on cost-efficient transformation but predicting growth in end-to-end organizational alignment and ecosystem-based collaboration. The shift highlights strategic evolution in partner expectations of service delivery, aiming for deeper stakeholder integration.
Partner ratings, transformation, ecosystem, alignment, efficiency, service expectations
Single Chart
EY
Saved
Column chart showing VC deals and investments in the Indian EV sector.
Investment Analysis
Transportation & Logistics
Highlights the growth and distribution of venture capital investments in India’s EV ecosystem.
EV, venture capital, investments, India, market growth
Mixed Chart
PwC/Strategy&
Saved
This slide contains a series of bar charts depicting the environmental impacts of the Kiruna-1 satellite across multiple indicators like climate change and resource use. Each category of impact is shown in different colors with comparisons between production, infrastructure, operations, and maintenance activities.
Product and Service Analysis
Environmental Services & Sustainability
The slide provides a comprehensive breakdown of the environmental impact of the Kiruna-1 satellite, particularly emphasizing the major contributions from infrastructure in terms of resource use and emissions.
environmental, sustainability, satellite, infrastructure, emissions, climate change, resource use, bar charts, impact assessment
Mixed Chart
Deloitte
Saved
Utilizes a stacked bar chart to compare digital marketing maturity across multiple industries. The design is clear, using shades of green to differentiate maturity levels.
Market Analysis and Trends
Media & Entertainment
Evaluates digital marketing maturity across various industries in Asia Pacific, showcasing a significant range of maturity levels. This slide helps in identifying industry-specific trends and planning targeted marketing strategies.
digital marketing, Asia Pacific, industry comparison, maturity levels, marketing trends, targeted strategies, stacked bar chart, industry-specific analysis
Single Chart
BCG
Saved
Features a structured checklist format outlining various governmental actions needed to meet COP26 ambitions, including strategies for decarbonization, energy transition costs, and green financing.
Regulatory and Compliance
Energy & Utilities
Details a comprehensive framework for government actions within SEA to build visibility and implement actionable plans that align with COP26 ambitions, focusing on regulatory, financial, and collaborative measures to facilitate the green transition.
COP26, Government Strategies, Decarbonization, SEA, Green Financing
Header Horizontal
Bain
Saved
A stylistic column chart with projected quarterly growth, using contrasting colors and a clear timeline, also includes bullet points on rate outlook and loan growth.
Financial Performance
Financial Services
Forecasts the net interest income growth for a financial institution, detailing contributing factors and expectations for the upcoming quarters.
NII, financial forecast, interest income, growth, quarterly, finance, loan growth, projections
Single Chart
JP Morgan
Saved
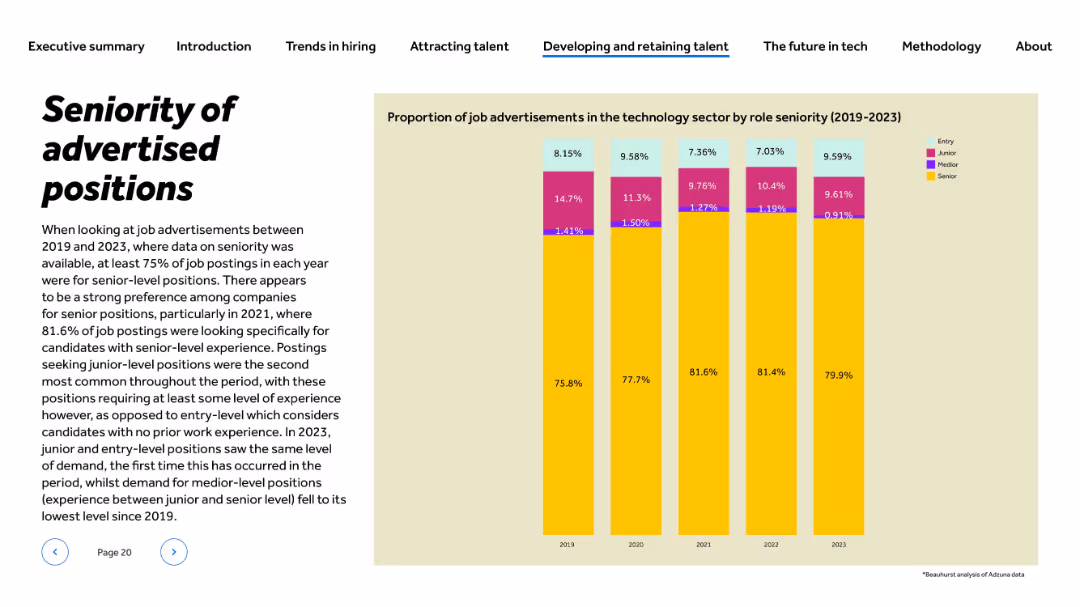
Title and paragraph left-aligned; vertical stacked bar chart on right showing role levels (2019–2023)
Human Resources and Talent Management
Technology & Software
This slide presents the distribution of job advertisements in tech by role seniority from 2019 to 2023. Senior roles consistently dominate, peaking at 81.6% in 2021. Entry and junior positions remain minor but saw parity in 2023. The slide illustrates a clear preference for experienced candidates across years, highlighting hiring practices in tech recruitment.
seniority, job levels, entry-level, hiring trends, experience, recruitment, talent demand, HR, tech roles, 2023 hiring
Mixed Chart
Barclays
Saved
This slide features a column chart showing the distribution of surveyed companies by industry and a world map highlighting the locations of the respondents. It also includes a pie chart depicting revenue segments.
Industry Overview
Technology & Software
The slide provides an overview of the research methodology, including details on the industries surveyed, geographic distribution, and revenue categories of the participating companies.
research methodology, survey data, industry distribution, revenue segments, geographic distribution
Mixed Chart
Accenture
Saved
This slide combines bar chart and a line graph to illustrate vaccination rates and daily vaccine doses administered in the Philippines.
Market Analysis and Trends
Government & Public Sector
This slide offers a visual analysis of COVID-19 vaccination progress in the Philippines, highlighting coverage and vaccination rates.
COVID-19, vaccination, Philippines, public health, pie charts, line graph, vaccine doses, coverage
Multiple Chart
Deloitte
Saved
Slide includes a column chart showing the evolution of Fed's supervision and regulation letters by topics, with a focus on process, technology, and other non-core topics over traditional reasons for bank failures.
Regulatory and Compliance
Financial Services
Discusses increased regulatory complexities faced by banks over recent years, focusing on how topics of supervision have shifted away from core financial risks to broader operational and technological aspects.
banking regulation, compliance burden, financial institutions, Fed supervision
Mixed Chart
Accenture
Saved
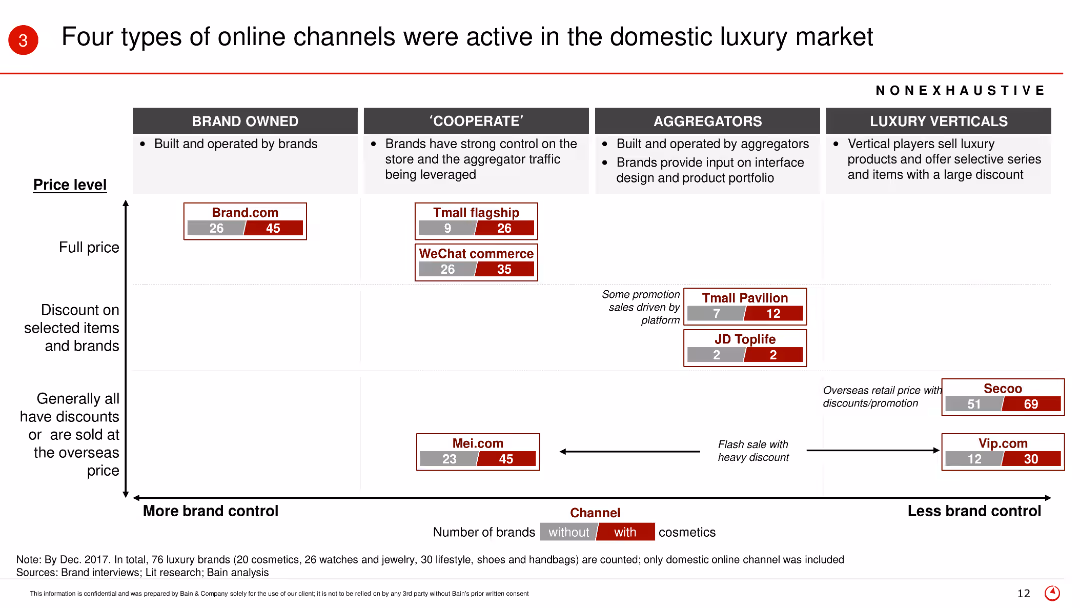
The slide presents a matrix chart categorizing online channels into brand owned, cooperate, aggregators, and luxury verticals, with various metrics such as price level and number of brands with/without cosmetics.
Market Analysis and Trends
Retail & E-commerce
This slide categorizes the different types of online channels in the luxury market, explaining their price levels and brand control, highlighting the role of cosmetics in each category.
Online channels, luxury market, brand control, cosmetics, price level, domestic market
Table
Bain
Saved
The slide features a graph comparing carbon reduction potential versus carbon abatement cost for different power-to applications and renewable productions.
Technology and Digital Transformation
Energy & Utilities
The slide discusses the high potential of various power-to applications and renewable production methods to decarbonize their respective sectors at low cost.
power-to-mobility, power-to-power, injection, renewable production, decarbonization
Single Chart
Kearney
Saved
Utilizes a bar chart and pie chart, display sector distribution and pie charts for business stage distribution.
Strategic Planning
Technology & Software
Analyzes the sector and development stage distribution of applications, focusing on agriculture, ICT, and education as key sectors.
sector, distribution, applications, stage, analysis
Multiple Chart
Accenture
Saved
A bar chart shows the importance of various aspects of public EV charging experiences and payment preferences, with sections color-coded for clarity.
Market Analysis and Trends
Transportation & Logistics
Evaluates consumer priorities for public EV charging, including charging speed and payment methods, informing service improvement and customer satisfaction strategies in the automotive sector.
electric vehicles, charging experience, fast charging, payment methods, consumer preferences, service improvement, automotive industry
Mixed Chart
Deloitte
Saved
Contains a matrix layout showing data on board composition regarding gender, alongside another section on independent chairmen percentages.
Organizational Structure and Change
Professional Services
Discusses corporate governance trends, particularly in diversity and independent leadership roles within companies. Useful for governance workshops and board training sessions.
governance, diversity, leadership, boards
Mixed Chart
PwC/Strategy&
Saved
Previous
Next
If nothing, comes up, please save your slides first
Create a FREE account to continue browsing
Receive Instant Access to 1,000+ slides from companies like McKinsey, Google, and Goldman Sachs
First Name
Last Name
Email
Password
I agree to all
Terms & Privacy Policy
Thank you! Your submission has been received!
Oops! Something went wrong while submitting the form.
Have an account?
Sign in
Column Chart
Heatmap
Chevron
Org Chart
Infographic
Callouts
Timeline
List
Graphic
Picture
Process Flow
Diagram
Paragraph
Map
Table
Framework
Subtitle
Takeaway Box
Icon
Other Chart
Radar Chart
Waterfall Chart
Mekko Chart
Pie Chart
Scatter Plot
Line Chart
Bar chart
Bullet points