My Account
My Slides
Search by Category
Templates
View All Templates
Download Template Slides
✦ AI Search
Feedback
Login
Logout
Get Started
Browse all Slides
Browse all Slides
Create a FREE Account
Instant access to 1,000+ real slides from top companies like McKinsey, BCG, Goldman Sachs, Google and many more!
First Name
Last Name
Email
Password
I agree to all
Terms & Privacy Policy
Thank you! Your submission has been received!
Oops! Something went wrong while submitting the form.
Have an account?
Sign in
Saved Slides
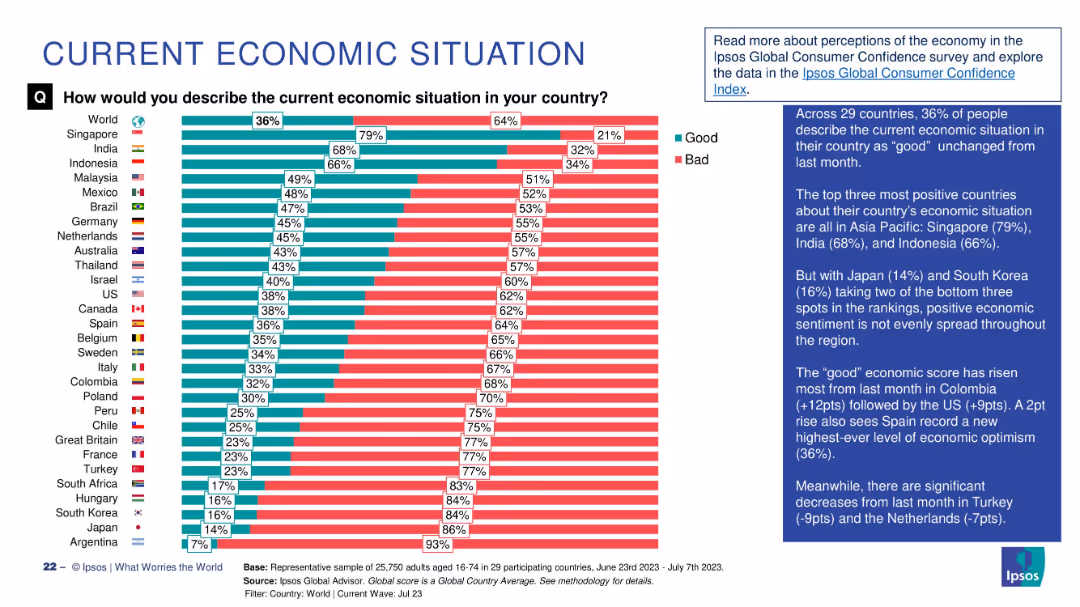
Bar chart comparing percentage of people in 29 countries describing the economy as "Good" vs "Bad", with annotations.
Market Analysis and Trends
Financial Services
This slide visualizes global public sentiment about the current economic situation, showing a 36% global average rating of "good". Singapore, India, and Indonesia lead in optimism, while Japan and Argentina have the lowest. Commentary highlights regional trends and month-over-month changes.
economic sentiment, global comparison, Ipsos, economic perception, survey, bar chart, economic optimism, Asia-Pacific, country ranking, economic trends
Mixed Chart
IPSOS
Saved
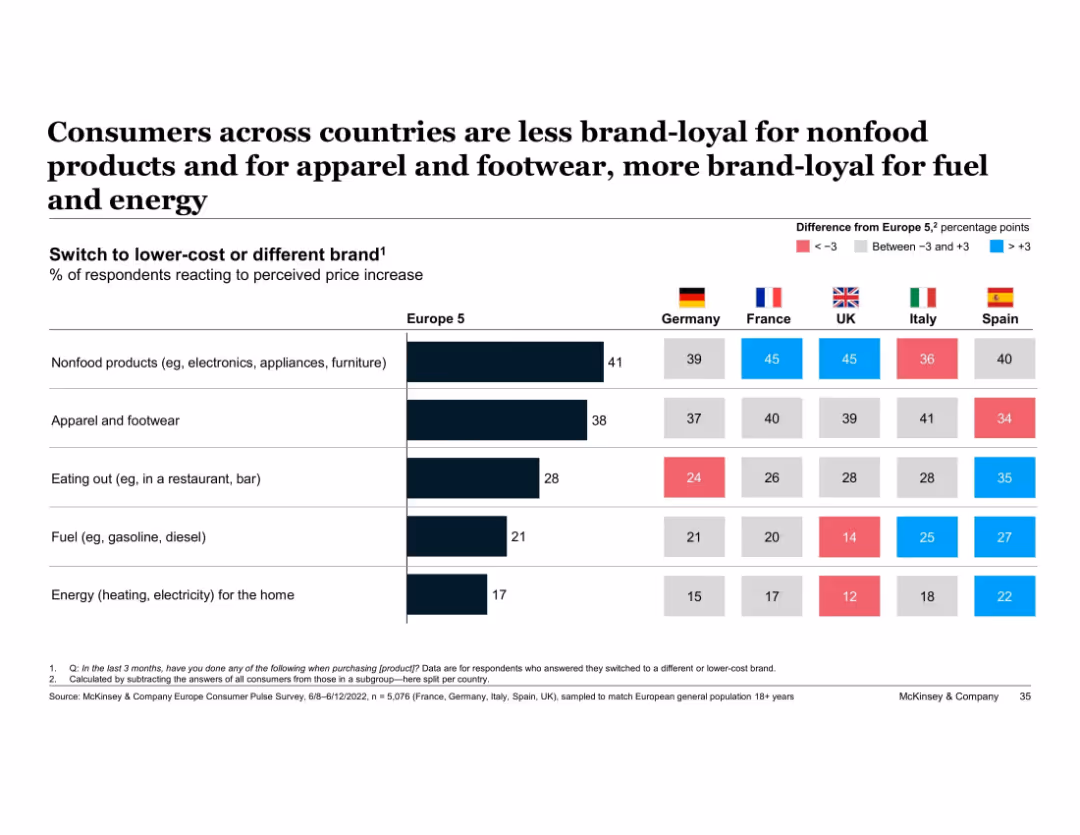
Horizontal bar chart with country-level comparison tables and color-coded difference indicators
Customer and Market Segmentation
Consumer Goods
Compares brand loyalty across five European countries by product category, showing who is more or less likely to switch brands due to price hikes. Differences from average are color-coded.
brand loyalty, price sensitivity, nonfood, energy, apparel, Europe, McKinsey, country comparison, switch behavior
Multiple Chart
McKinsey
Saved
Contains a column chart detailing Australian infrastructure work from FY07 to FY25, with actual and projected values. Features clear scenario distinctions and annotations for clarity.
Market Analysis and Trends
Real Estate & Construction
Discusses projections for infrastructure development in Australia, highlighting potential growth scenarios and their drivers, useful for policy making and investment decisions.
infrastructure, Australia, projections, growth scenarios, investment
Mixed Chart
Deloitte
Saved
Two comparative area charts show the risk premia components for South American Chemicals Company using Morgan Stanley’s SICR Analysis vs. traditional analysis methods.
Strategic Planning
Financial Services
The slide explains the decomposition of risk premia into US treasury, sovereign-induced corporate credit, and corporate spread over sovereign spread. Useful for strategic risk analysis.
risk premia, SICR, corporate credit, sovereign spread, analysis
Multiple Chart
Morgan Stanley
Saved
The slide presents a column chart with vertical bars representing different CO₂ capture technologies across various sectors. The chart uses distinct colors for each technology.
Market Analysis and Trends
Energy & Utilities
It shows the distribution of CO₂ capture technologies (oxy-combustion, pre-combustion, post-combustion) across sectors like chemicals, power generation, heavy industries, hydrogen, and oil and gas.
CO₂ capture, distribution, technologies, sectors, oxy-combustion, pre-combustion, post-combustion, energy
Single Chart
Kearney
Saved
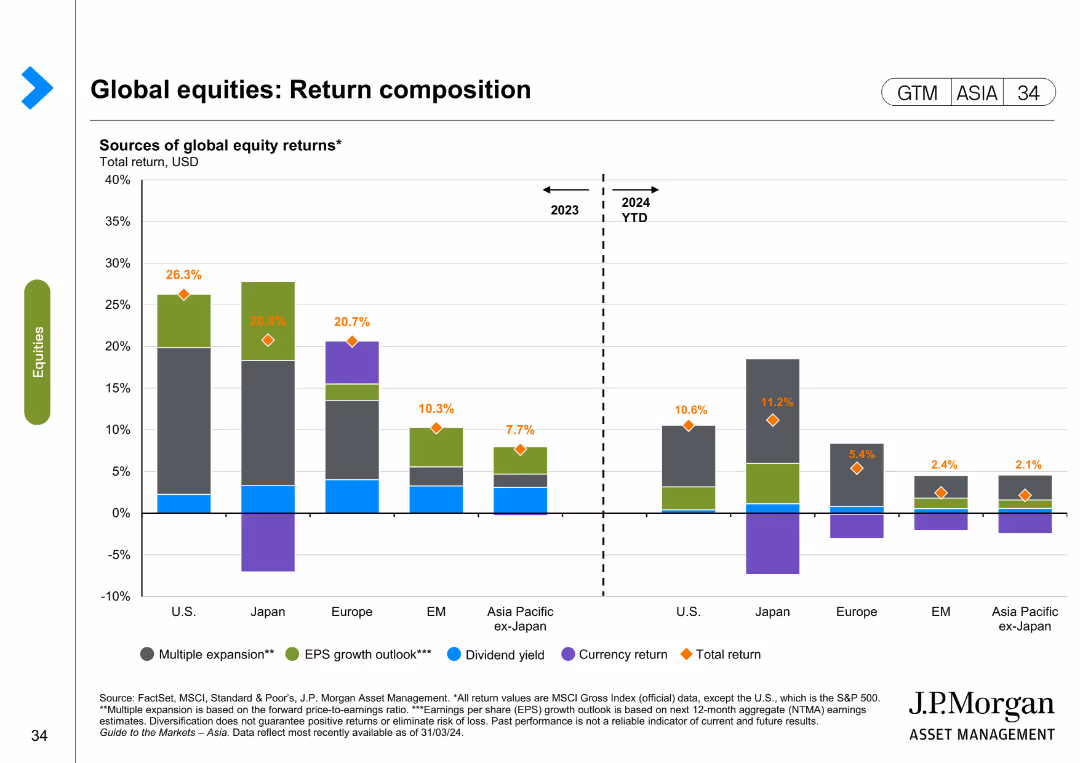
The slide features a column chart showing sources of global equity returns for different regions. The layout is detailed and moderately complex.
Investment Analysis
Financial Services
This slide analyzes the composition of global equity returns, breaking down the contributions of different factors such as multiple expansion and earnings growth.
global equities, return composition, investment analysis, regional comparison, equity returns
Single Chart
JP Morgan
Saved
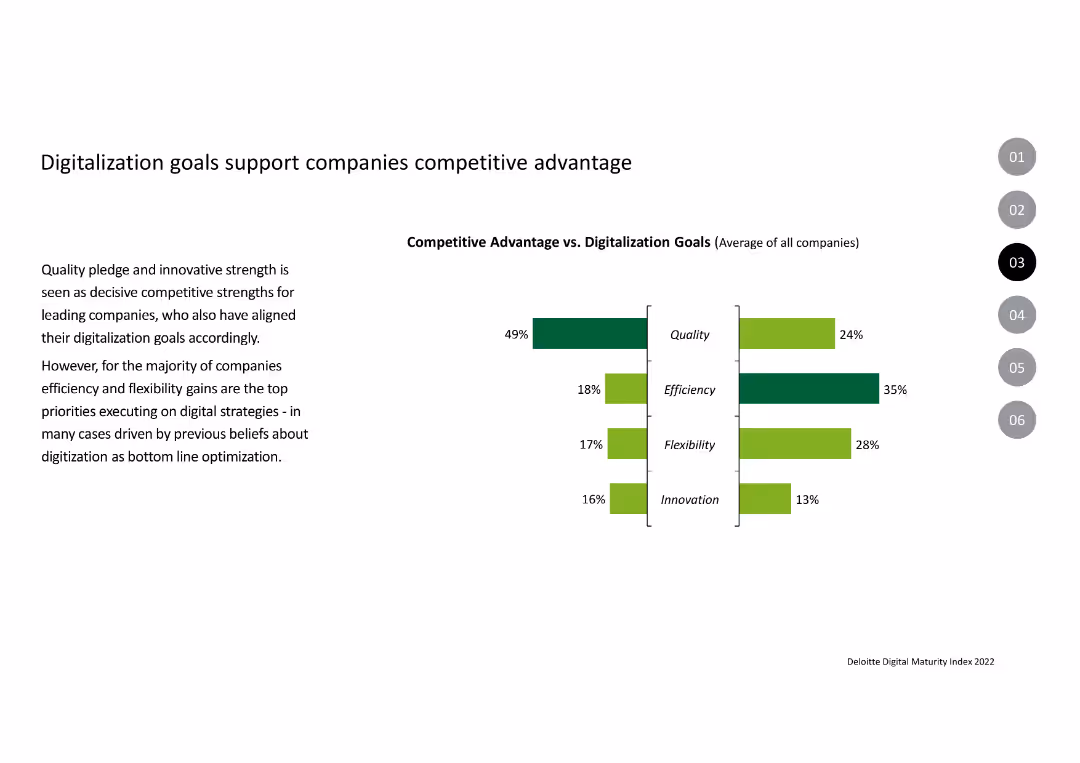
The slide contains a column chart comparing competitive advantages vs. digitalization goals across metrics like quality, efficiency, flexibility, and innovation.
Strategic Planning
Professional Services
This slide shows how companies align their digitalization goals with competitive advantages, focusing on quality, efficiency, flexibility, and innovation.
Digitalization, Competitive Advantage, Quality, Efficiency, Flexibility, Innovation
Multiple Chart
Deloitte
Saved
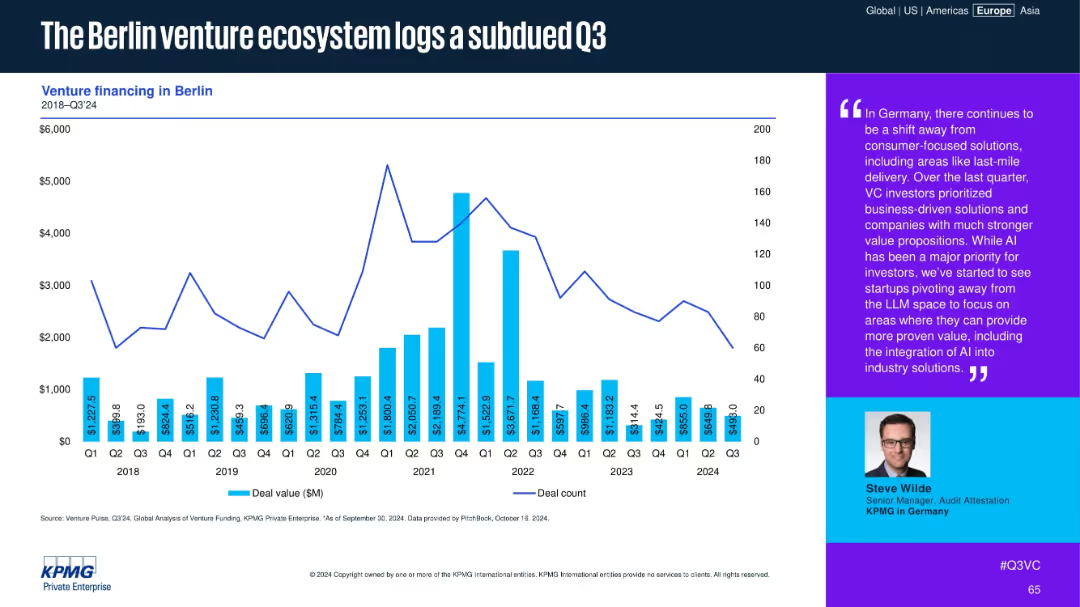
Bar and line chart of venture financing in Berlin (2018–Q3 2024), with quote highlighting VC investor behavior.
Market Analysis and Trends
Financial Services
Berlin's VC ecosystem softened in Q3 2024. Commentary suggests a shift away from last-mile delivery and LLMs, toward business-oriented solutions and AI integration into industrial processes, as investors pursue proven value.
Berlin, VC funding, Q3 2024, AI solutions, investor behavior, industry pivot, last-mile delivery, business focus
Mixed Chart
KPMG
Saved
The slide includes a column chart assessing risks and opportunities by corporate function. There are icons for each function and highlights per industry.
Strategic Planning
Transportation & Logistics
Analyzes the risks and opportunities of digitalization across various corporate functions, with a focus on logistics and finance sectors leveraging new technologies.
Digitalization, logistics, finance, opportunities, risks, strategic planning
Table
Roland Berger
Saved
Incorporates a detailed comparative chart mapping out emissions targets and carbon policies across several SEA countries.
Regulatory and Compliance
Government & Public Sector
Discusses the formation of national climate ambitions within SEA, focusing on emissions targets and carbon pricing strategies.
SEA, emissions targets, carbon pricing, climate policy
Table
Bain
Saved
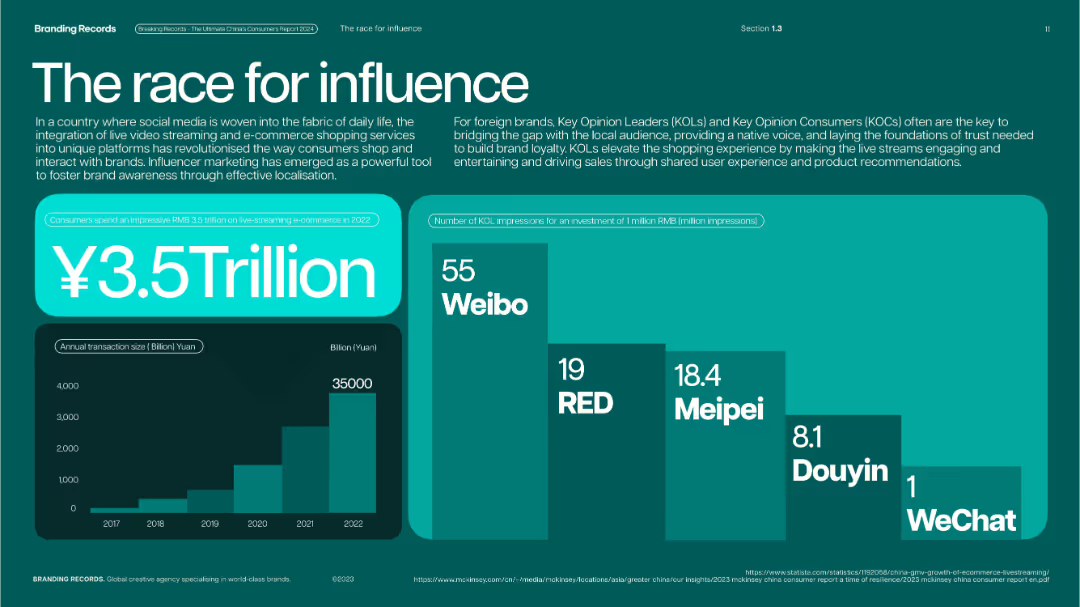
Teal-green layout with bar and stacked charts; large figure in center with visual emphasis.
Strategic Planning
Media & Entertainment
Illustrates the rise of influencer marketing and live-streaming commerce in China, with ¥3.5 trillion spent in 2022. Charts include annual transaction volume growth and KOL impressions by platform.
influencer marketing, KOLs, live-streaming, Weibo, RED, Meipei, Douyin, social commerce
Multiple Chart
McKinsey
Saved
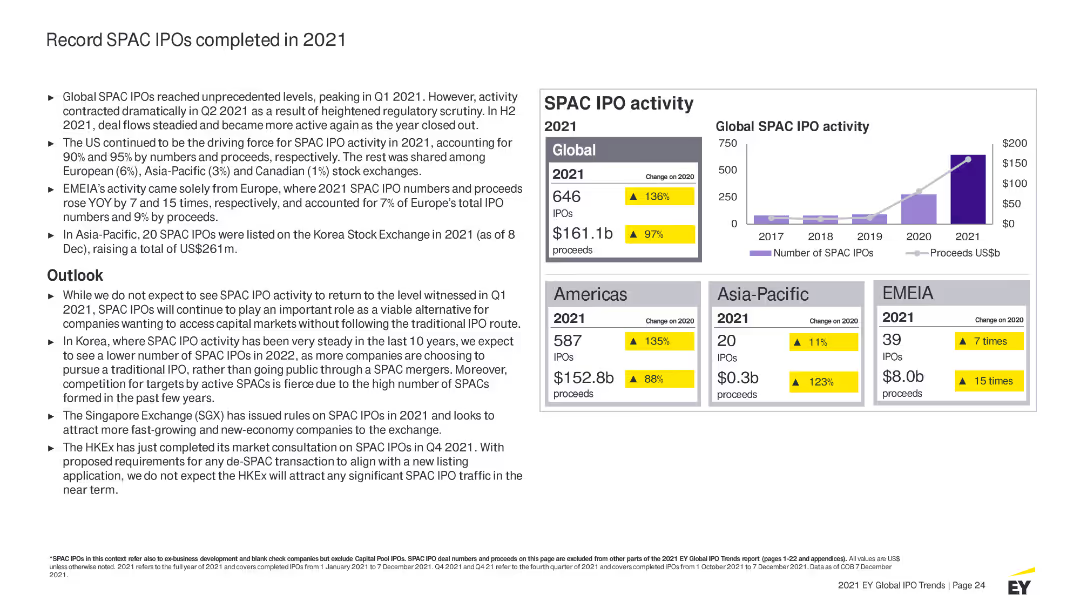
Presents column charts, tables, and text sections highlighting key statistics, with a purple and yellow color scheme to differentiate data points.
Market Analysis and Trends
Financial Services
Analyzes the record levels of SPAC IPOs completed in 2021 globally, detailing activities by region, sector performance, and outlook for SPAC IPOs.
SPAC, IPO, 2021 activity, market highlights, global trends, regions, sectors, proceeds, outlook, regulatory impact
Mixed Chart
EY
Saved
The slide contains a series of pie charts depicting the top skills required in risk management over the next three years, categorized by overall, G-SIB, and non-G-SIB responses.
Risk Assessment and Management
Financial Services
This slide identifies the top skills needed in the risk management function, such as data science, cybersecurity, and AI-based model risk management, crucial for future preparedness.
risk management, skills, pie charts, G-SIB, non-G-SIB
Multiple Chart
EY
Saved
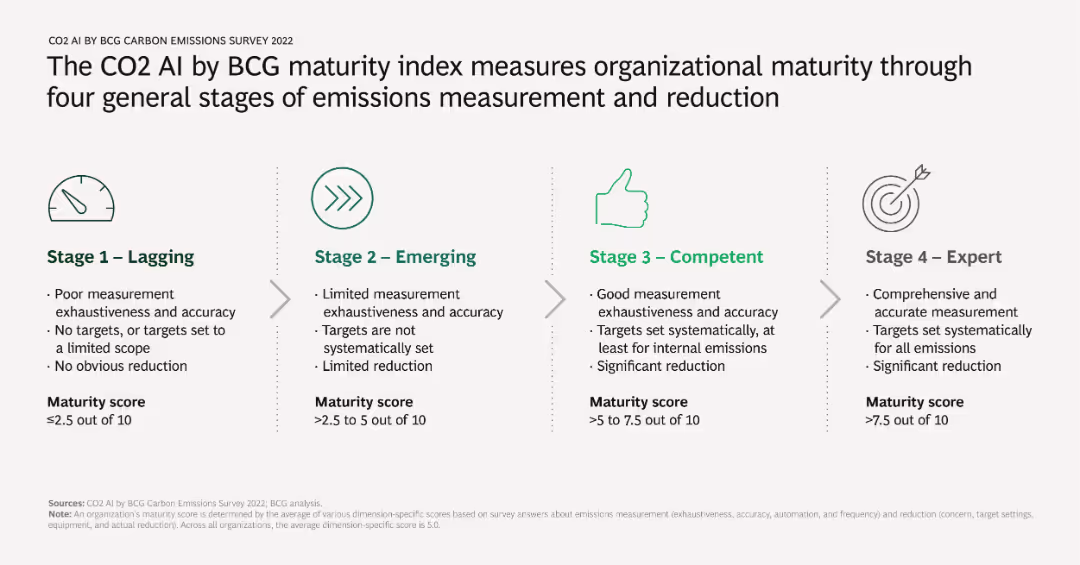
Diagram illustrating four stages of organizational maturity in emissions measurement and reduction: Lagging, Emerging, Competent, and Expert. Each stage includes criteria such as measurement exhaustiveness, accuracy, target setting, and reduction achievements.
Strategic Planning
Environmental Services & Sustainability
Outlines the maturity index used by BCG to evaluate how well organizations measure and reduce emissions. Provides a framework for companies to assess their current level and identify areas for improvement.
maturity index, emissions measurement, organizational stages, BCG, reduction
Linear Flow
BCG
Saved
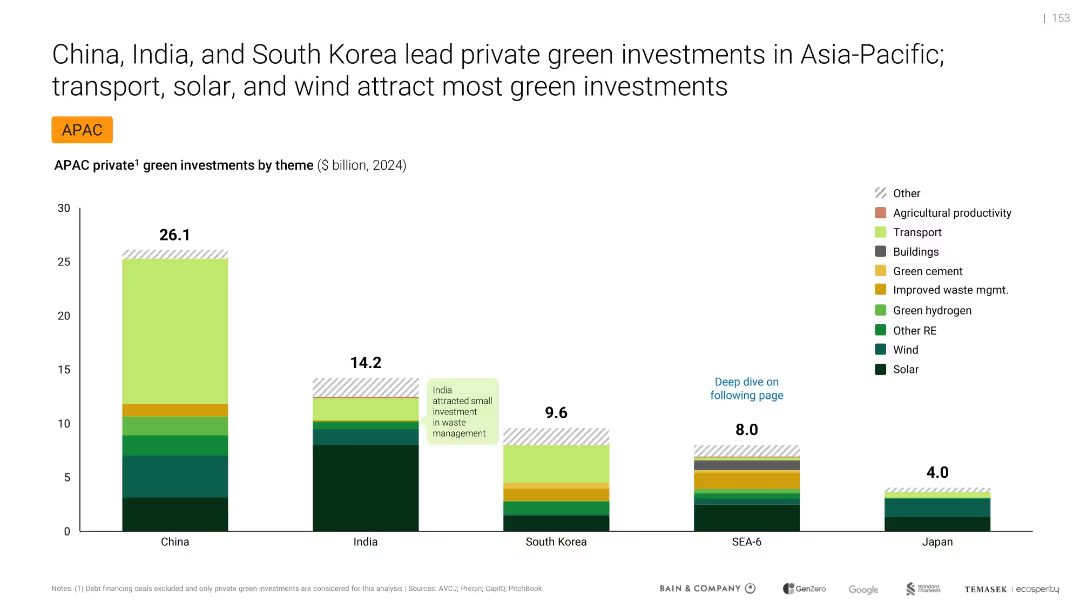
Bar chart comparing green investments by country and theme, labeled and color-coded
Investment Analysis
Environmental Services & Sustainability
Compares private green investments in APAC by theme and country for 2024. China leads with $26.1B, followed by India and South Korea. Main investment themes include solar, wind, and transport. Highlights regional differences and India’s underinvestment in waste management.
green investments, APAC, solar, wind, transport, China, India, South Korea, private capital
Single Chart
Bain
Saved
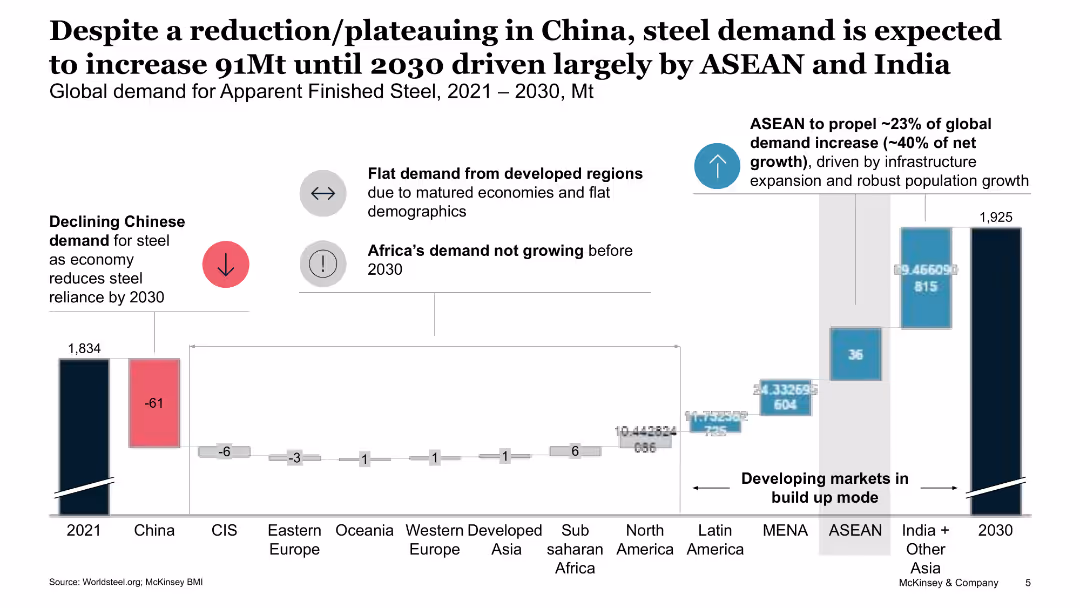
The slide features a complex column chart illustrating global steel demand projections, highlighting demand changes by region, with a focus on ASEAN and India.
Market Analysis and Trends
Industrial & Manufacturing
This slide forecasts global steel demand growth until 2030, driven by ASEAN and India, and discusses the reduction in Chinese demand and flat demand in developed regions.
steel demand, ASEAN, India, global projections, market trends
Mixed Chart
McKinsey
Saved
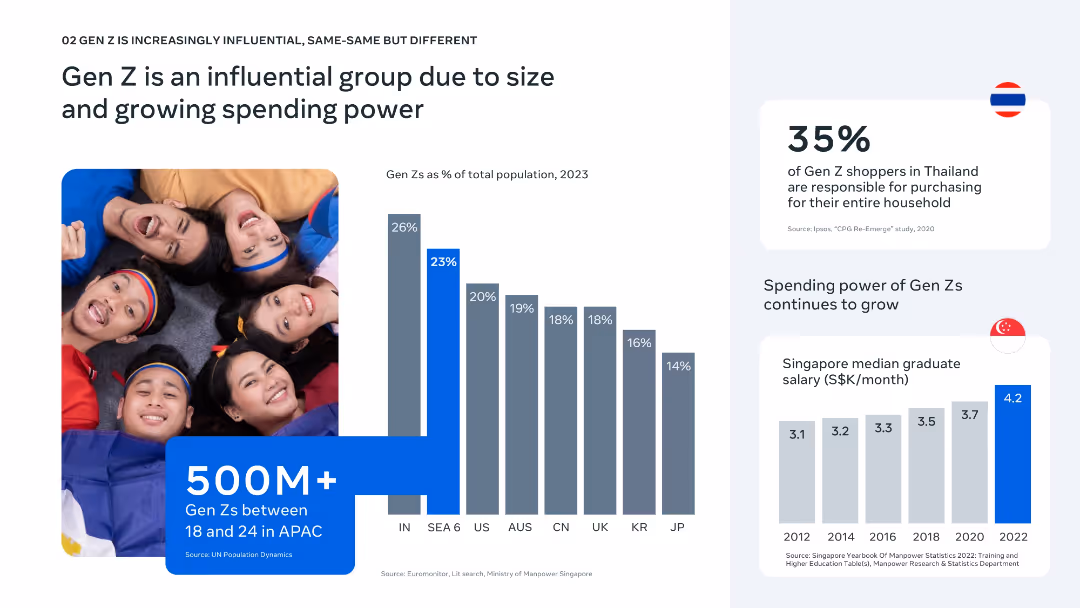
Side-by-side layout with image left, bar charts and stat blocks right; bright, youthful aesthetic.
Customer and Market Segmentation
Consumer Goods
Gen Z represents a significant share of the population in SEA and plays a key purchasing role. The slide includes data on population percentage, purchasing influence, and growing median salaries in Singapore as an example of increasing power.
Gen Z, population, spending power, household influence, APAC, income growth, graduate salary, youth market, Southeast Asia, purchasing behavior
Multiple Chart
Bain
Saved
Features icons and descriptive boxes outlining wider contributions, with a straightforward, moderate design complexity.
Strategic Planning
Industrial & Manufacturing
The slide illustrates various wider contributions of the Tempest programme, such as skill spillovers, R&D spillovers, and regional development, aligning with government objectives.
Tempest, development, government, UK
Header Vertical
PwC/Strategy&
Saved
Consists of column charts showing financial metrics such as IRR, MOIC, and dividends over time in various green tones.
Financial Performance
Energy & Utilities
Provides a comprehensive overview of Colgate's financial performance, including shareholder returns and investment dividends over recent years.
financial performance, dividends, returns, Colgate, energy
Multiple Chart
Barclays
Saved
Contains a descriptive block on the left about Palsgaard's focus, a complex table in the center with checkboxes marking the strategic direction in relation to specific SDGs, and the SDG logos for 'Responsible Consumption' and 'Climate Action'.
Strategic Planning
Environmental Services & Sustainability
This slide details Palsgaard’s strategic focus on SDG 12 and 13, highlighting initiatives like responsible resource use and CO2 emissions reduction. The central table checks align Palsgaard’s operations with these SDGs, pointing out their commitment to innovation in sustainability and the impact on operational costs and global CO2 management.
SDG 12, SDG 13, Sustainability, CO2 Reduction, Resource Management
Table
McKinsey
Saved
The slide includes pie and column charts displaying trends in liquidity ratios and funding sources over several quarters. The information is organized in a clear, easy-to-follow layout.
Financial Performance
Financial Services
Outlines the funding and liquidity status of a financial institution, highlighting the diversified deposit base and liquidity ratios. Useful for financial analysis and discussions on maintaining liquidity in banking operations.
funding, liquidity, finance, banking, stability
Multiple Chart
Deutsche Bank
Saved
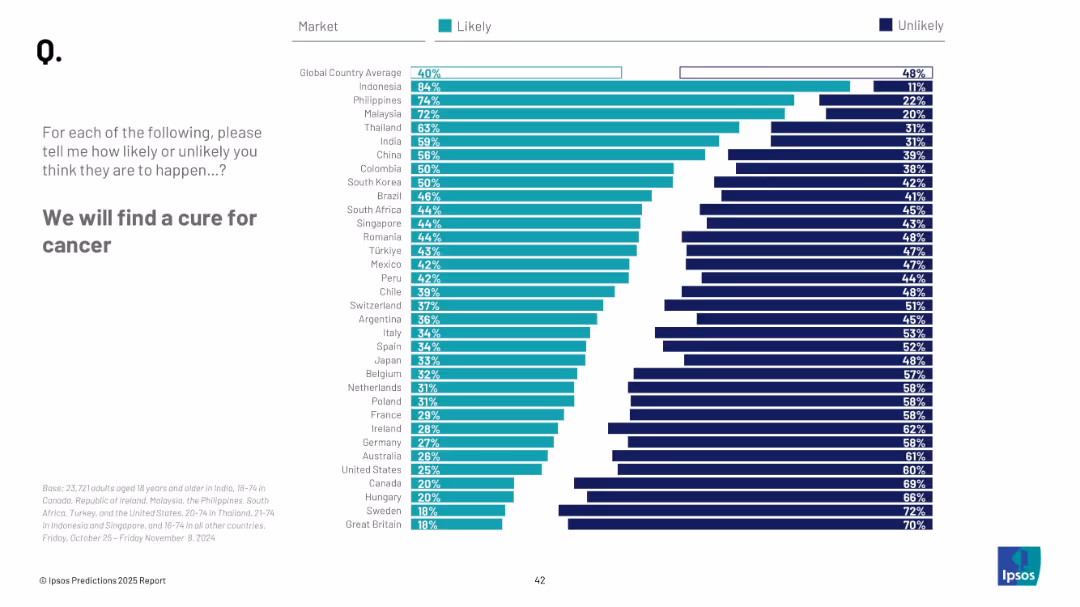
Horizontal bar chart; ranked likelihood by country; teal and navy color coding for likelihood and unlikelihood
Strategic Planning
Healthcare & Pharmaceuticals
This slide reflects global beliefs on the likelihood of a cancer cure. Indonesia and the Philippines are most hopeful, with an overall global likelihood of 40%.
healthcare, cancer, medical breakthrough, global opinion, research, hope, cure, innovation, prediction, Ipsos
Mixed Chart
IPSOS
Saved
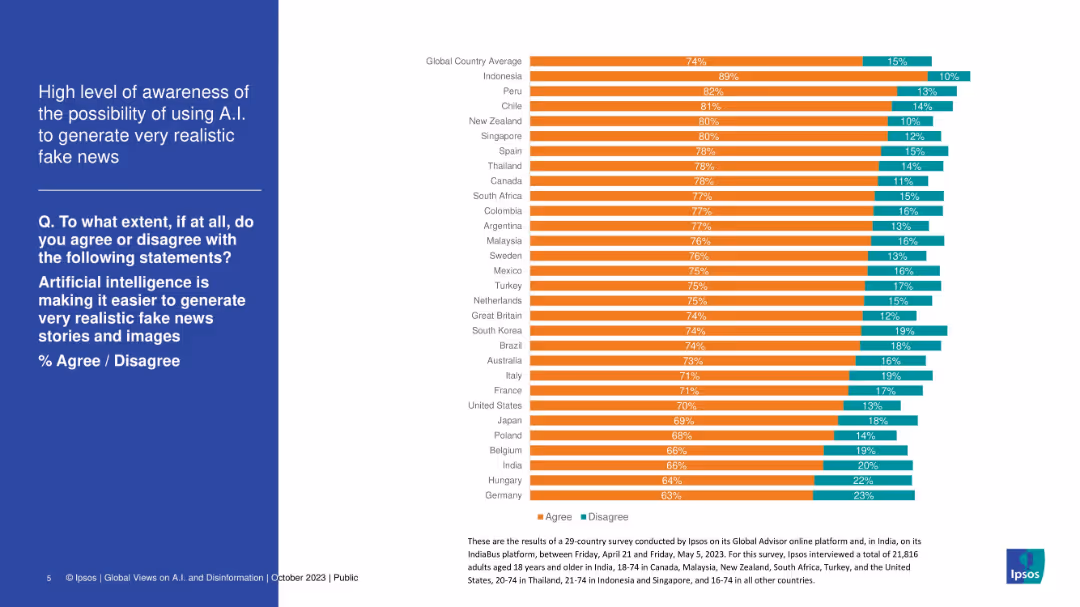
Stacked bar chart displaying country-level agreement that AI makes fake news creation easier. Nearly all bars show high agreement (orange).
Risk Assessment and Management
Artificial Intelligence
This slide reveals overwhelming global awareness of the risks AI poses in generating realistic fake news. Most countries show over 70% agreement, highlighting public concern about deepfakes and AI-generated misinformation, particularly in Indonesia, Peru, and Chile.
artificial intelligence, fake news, public concern, misinformation, AI risk, deepfake, survey, Ipsos
Mixed Chart
IPSOS
Saved
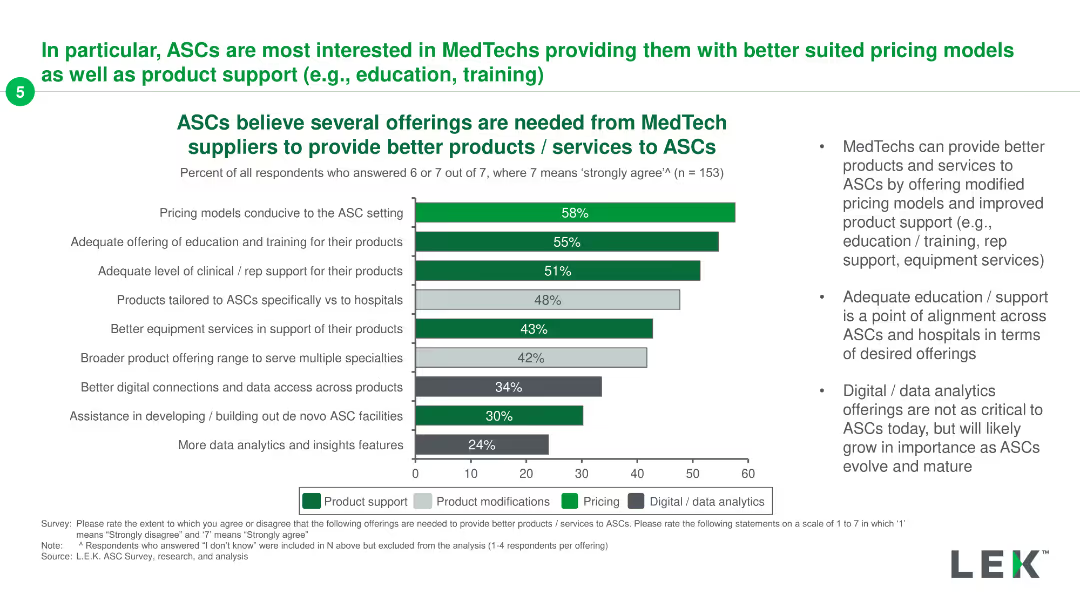
Horizontal bar chart with multiple categories like product support, product modifications, pricing, and digital/data analytics, each represented with different colored bars.
Product and Service Analysis
Healthcare & Pharmaceuticals
The slide presents survey data on what offerings ASCs need from MedTech suppliers, highlighting product support, modifications, pricing, and digital/data analytics.
ASCs, MedTech, product support, pricing, data analytics
Mixed Chart
LEK
Saved
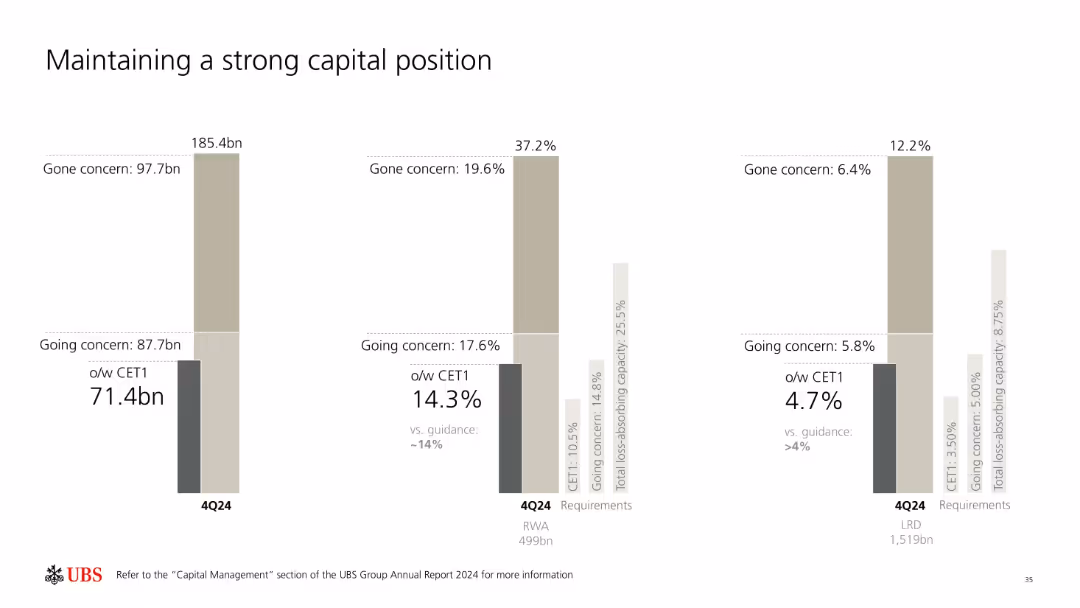
Three vertical stacked bars showing capital structure (CET1, Going/Gone Concern) with percentages and labels. Explains compliance with regulatory capital requirements.
Regulatory and Compliance
Financial Services
Details UBS’s capital adequacy metrics for 4Q24, including CET1, going concern, and gone concern resources. Compares these against regulatory thresholds and guidance levels. Highlights sufficient buffers and capital structure components supporting regulatory compliance.
capital adequacy, CET1, UBS, regulatory, going concern, buffers
Single Chart
UBS
Saved
Previous
Next
If nothing, comes up, please save your slides first
Create a FREE account to continue browsing
Receive Instant Access to 1,000+ slides from companies like McKinsey, Google, and Goldman Sachs
First Name
Last Name
Email
Password
I agree to all
Terms & Privacy Policy
Thank you! Your submission has been received!
Oops! Something went wrong while submitting the form.
Have an account?
Sign in
Column Chart
Heatmap
Chevron
Org Chart
Infographic
Callouts
Timeline
List
Graphic
Picture
Process Flow
Diagram
Paragraph
Map
Table
Framework
Subtitle
Takeaway Box
Icon
Other Chart
Radar Chart
Waterfall Chart
Mekko Chart
Pie Chart
Scatter Plot
Line Chart
Bar chart
Bullet points