My Account
My Slides
Search by Category
Templates
View All Templates
Download Template Slides
✦ AI Search
Feedback
Login
Logout
Get Started
Browse all Slides
Browse all Slides
Create a FREE Account
Instant access to 1,000+ real slides from top companies like McKinsey, BCG, Goldman Sachs, Google and many more!
First Name
Last Name
Email
Password
I agree to all
Terms & Privacy Policy
Thank you! Your submission has been received!
Oops! Something went wrong while submitting the form.
Have an account?
Sign in
Saved Slides
Features two column charts comparing estimated contract values and contract awards from 2016 to 2019, annotated with statistical data. There's also a key at the bottom for color references.
Financial Performance
Energy & Utilities
This slide provides financial data on the growth and success of integrated contracts and specific subsea projects under the Subsea Integration Alliance, highlighting significant industry collaboration and achievements.
financials, contracts, growth, subsea, integration
Multiple Chart
Barclays
Saved
Scatter plot analyzing the correlation between financial performance and business & technology dimensions among companies.
Technology and Digital Transformation
Technology & Software
Evaluates how companies with strong business and technological capabilities tend to outperform in long-term profitability.
business capabilities, technology, financial performance, profitability, long-term growth, scatter plot, business dimensions, technology investment
Mixed Chart
Accenture
Saved
Simple design focusing on a pie chart with a small legend describing regional differences in processes. The color green is used to denote different responses, facilitating an easy visual distinction between categories.
Regulatory and Compliance
Healthcare & Pharmaceuticals
Discusses the consistency of processes and technology for healthcare professional engagement across different regions. It highlights varying levels of adoption and challenges in standardizing practices globally, aiming to underline the importance of unified operational strategies.
healthcare processes, regional differences, operational consistency, survey analysis
Single Chart
Deloitte
Saved
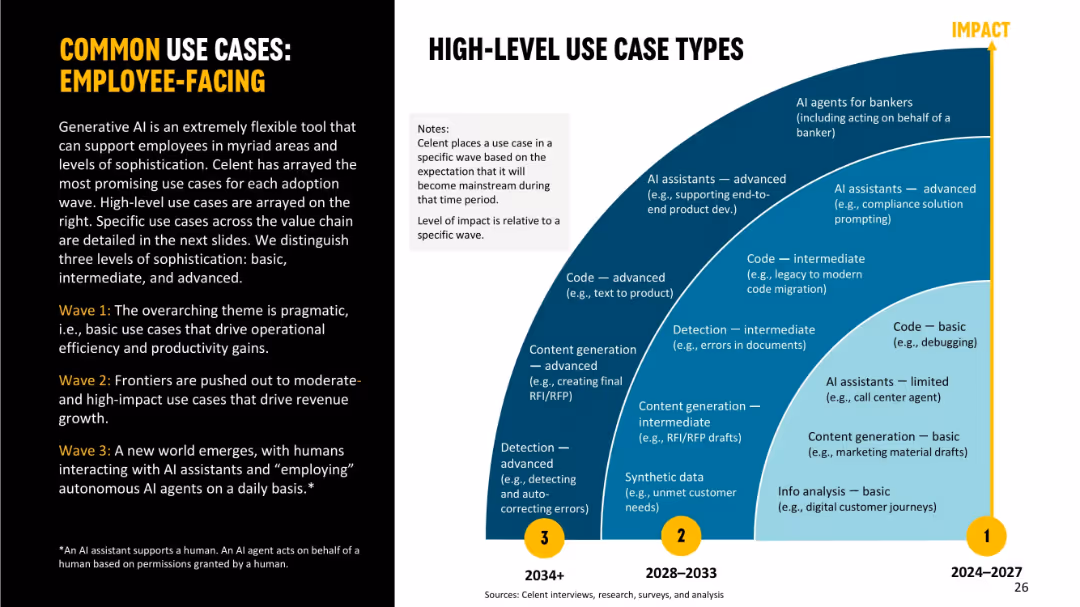
Left panel with wave description text and right semi-arch visual segmented into use case levels (basic → advanced). Use case types positioned by wave and impact.
Human Resources and Talent Management
Financial Services
Focuses on employee-facing GenAI applications over three waves. Wave 1 is basic efficiency use (e.g., debugging); Wave 2 introduces intermediate applications like document detection and code migration; Wave 3 features advanced AI agents acting on behalf of humans. Emphasizes transformation of employee tasks via increasing AI integration.
employee-facing, use cases, GenAI, code, detection, AI assistant, automation, productivity
Mixed Chart
Oliver Wyman
Saved
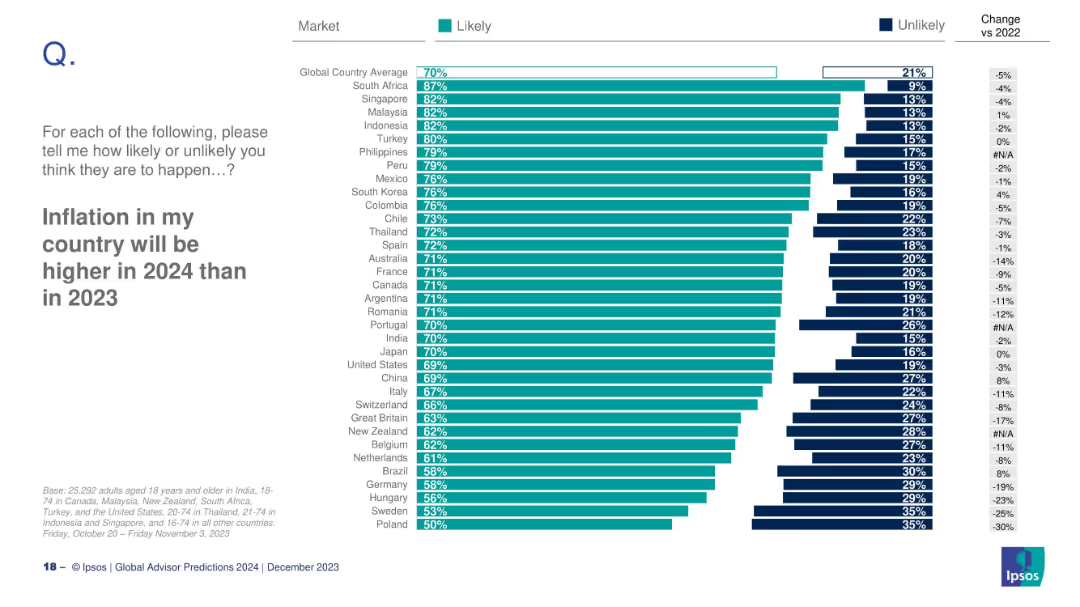
Bar chart comparing countries by percentage of people who think inflation will rise in 2024 vs. 2023
Market Analysis and Trends
Financial Services
This slide presents public opinion across countries on whether inflation is expected to increase in 2024 compared to 2023. The data shows a global average and lists countries from highest to lowest belief in future inflation.
inflation, global perception, 2024 forecast, economic outlook, countries
Mixed Chart
IPSOS
Saved
This slide includes icons, a pie chart, and key financial highlights to underscore the leading position in global markets.
Market Analysis and Trends
Financial Services
Highlights sustained growth and client excellence in global markets, detailing revenue and market share statistics.
markets, financial growth, market leadership, client relationships, revenue
Mixed Chart
JP Morgan
Saved
Features a balance of text and images, illustrating various funding models and their applicability in Indonesian school connectivity projects, using a complex text layout.
Strategic Planning
Telecommunications
Explores different funding models for improving school connectivity in Indonesia, discussing their theoretical benefits and practical challenges, and assessing the potential for scalable solutions.
connectivity, schools, Indonesia, funding, models
Mixed Chart
BCG
Saved
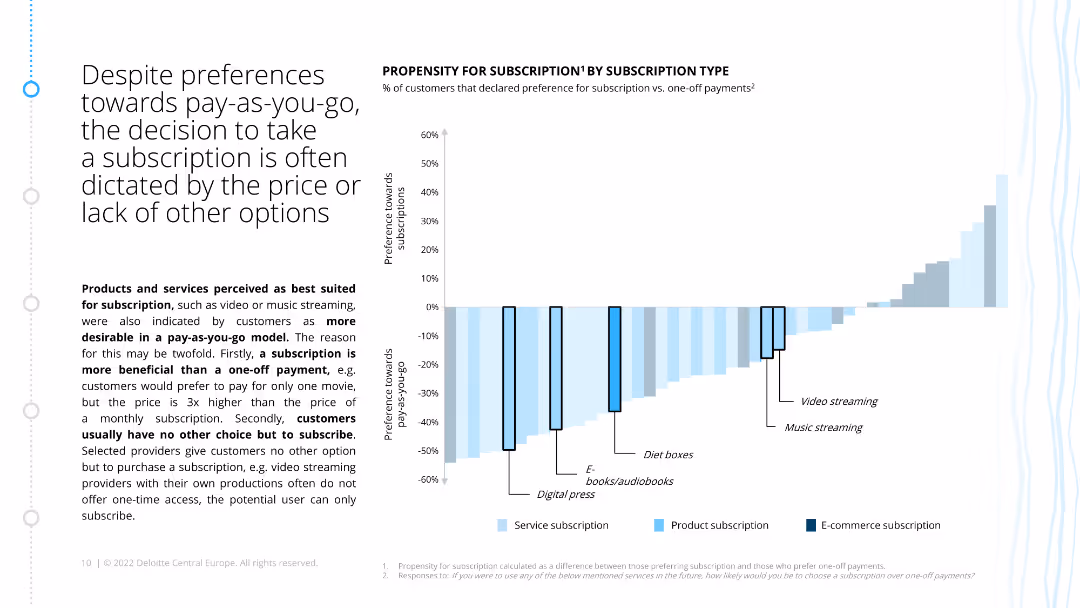
The slide includes a bar chart showing the factors influencing customers' decisions to subscribe, categorized by different subscription types such as digital services, consumable products, and e-commerce.
Customer and Market Segmentation
Consumer Goods
The slide identifies key factors that drive customers to subscribe, including financial incentives, convenience, and access to premium offerings, with varying importance across subscription types.
decision factors, subscription, financial incentives, convenience, premium offerings
Mixed Chart
Deloitte
Saved
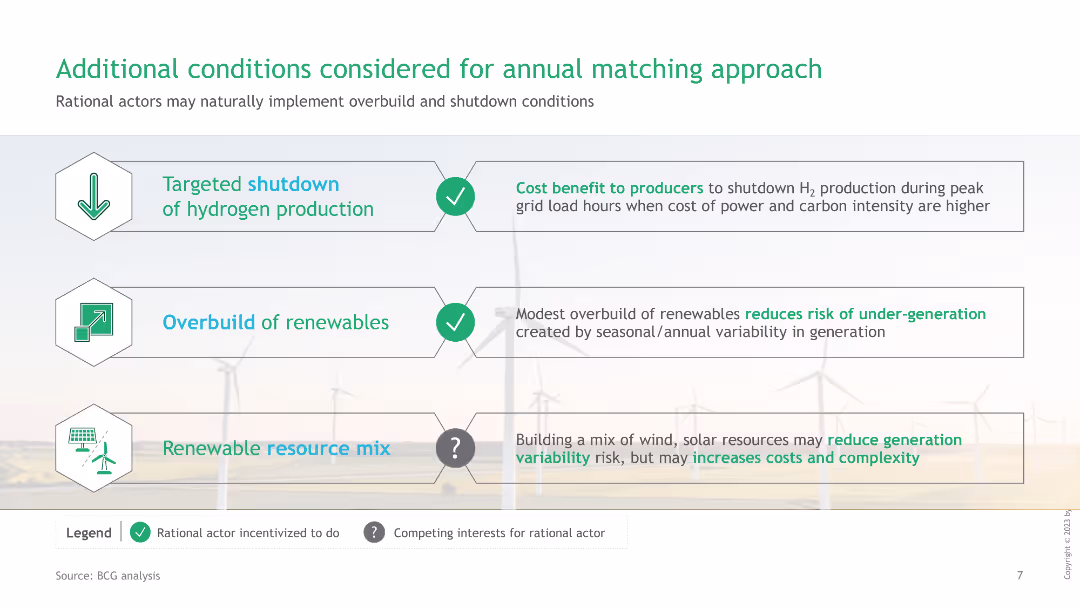
The slide features three icons with corresponding descriptions for conditions considered in annual matching: Targeted shutdown, Overbuild of renewables, Renewable resource mix.
Strategic Planning
Energy & Utilities
This slide explains additional conditions like targeted shutdown, overbuild of renewables, and renewable resource mix, which are considered for implementing an annual matching approach in green hydrogen production.
green hydrogen, annual matching, targeted shutdown, renewables, resource mix
Table
BCG
Saved
A combination of a line chart and a stacked column chart. The line chart shows GDP per capita vs. urbanization. The stacked column chart shows middle-class growth contribution.
Market Analysis and Trends
Financial Services
The slide compares GDP per capita against urbanization ratios and forecasts the contribution of different regions to middle-class growth from 2024 to 2030.
GDP, urbanization, middle-class, growth, forecast, regions, contribution, financial trends, economic analysis, development
Multiple Chart
JP Morgan
Saved
Column chart depicting changes in CET1 capital ratio from 2Q22 to 3Q22 with annotations for key factors.
Financial Performance
Financial Services
Analyzes the changes in CET1 capital ratio over a period, highlighting significant contributors and their impacts.
CET1 capital, equity, financial performance, UBS, 3Q22, leverage ratio, share buybacks, net profit
Mixed Chart
UBS
Saved
Features a maturity score chart across industries like aerospace, high-tech, and automotive, showing levels of resiliency maturity using a horizontal bar graph with a scoring scale.
Risk Assessment and Management
Industrial & Manufacturing
Provides a comparative analysis of resiliency maturity scores by industry, showing variations and benchmarks, and stressing the need for advanced capabilities in handling disruptions.
resiliency, industry analysis, maturity scores, benchmarking, capability advancement, disruption handling, Accenture Research
Mixed Chart
Accenture
Saved
This slide features a table format discussing the impact on integrator industry over the last three years, industry drivers, and digitalization. It also includes quotes from industry leaders and logos of companies such as Schott, Edgewater Automation, Kuka, and Strama-MPS.
Competitive Landscape
Industrial & Manufacturing
The slide outlines key themes and challenges for system integrators, including market commentary on the impact of recent years on the integrator industry, industry drivers, and the importance of digitalization.
System Integrators, Industry Challenges, Market Commentary, CEO Interviews, Digitalization
Table
LEK
Saved
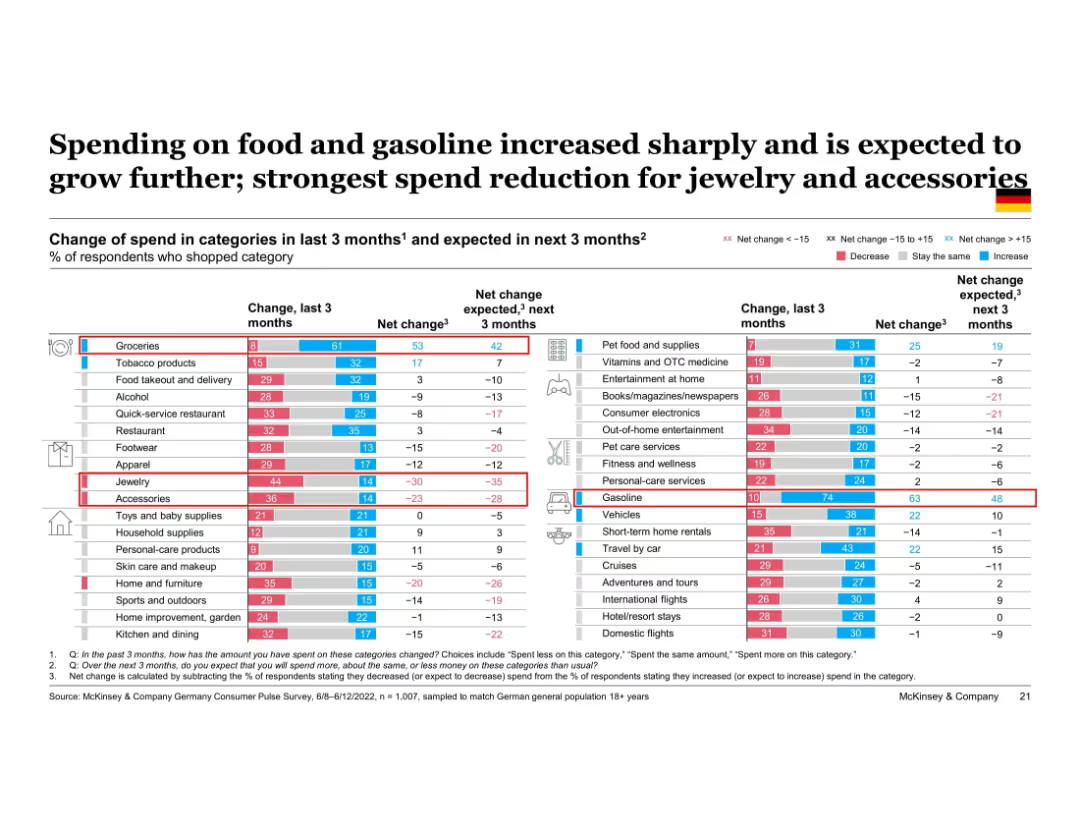
Large, detailed table chart ranking change in spend for 30+ product categories over past and next 3 months. Columns show net change with red/blue color scales. Categories sorted by net change.
Market Analysis and Trends
Financial Services
This slide offers a deep dive into German consumer spend patterns by product category. Groceries and gasoline show sharp increases, while categories like jewelry and accessories are seeing sharp cuts. Net change indicators highlight trends in both past and expected future consumption shifts.
spending trends, category spend, Germany, groceries, gasoline, discretionary cutbacks, inflation impact, purchase behavior
Single Chart
McKinsey
Saved
This slide is a visual timeline from 2017 to 2020, showing major milestones and events in the company’s history. It uses a green arrow to depict progress over time, with text boxes providing details on key initiatives and changes.
Strategic Planning
Financial Services
The slide outlines the company’s strategic journey, showcasing major milestones such as acquisitions and corporate changes. It is useful for illustrating a company's evolution, strategy execution, and future plans.
Timeline, Strategic Journey, Milestones, Company Evolution, Future Plans
Linear Flow
Morgan Stanley
Saved
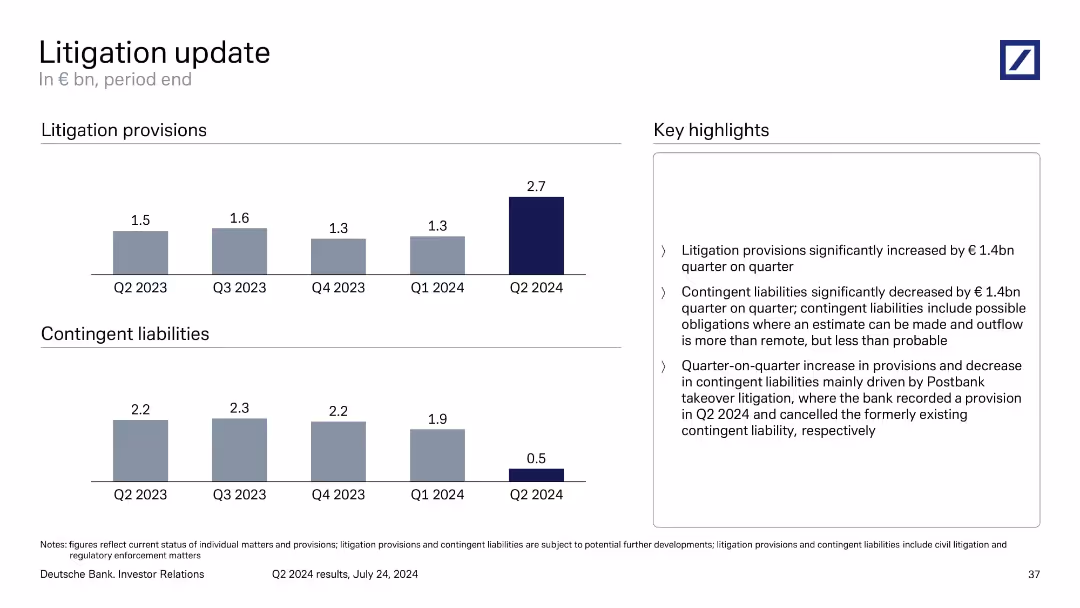
Split layout with bar charts for provisions and contingent liabilities on the left and explanatory text on the right.
Regulatory and Compliance
Financial Services
The slide highlights a significant increase in litigation provisions (€2.7bn in Q2 2024) and a corresponding drop in contingent liabilities. The changes are mainly attributed to the Postbank takeover litigation. It underscores how litigation events can impact financial reporting and provisioning requirements.
litigation, provisions, contingent liabilities, Postbank, legal risks
Multiple Chart
Deutsche Bank
Saved
The slide features a balance sheet summary on the left with a simple table layout, and credit metrics on the right with numerical highlights and explanatory texts. The design includes shaded boxes and clear separation of content areas.
Financial Performance
Financial Services
This slide compares a company's balance sheet and credit profile, with a focus on cash, debt, and capital structure, as well as credit metrics like EBITDA and leverage ratio. It’s tailored for financial analysts or investors looking at company stability, creditworthiness, and financial health.
Balance Sheet, Credit Profile, EBITDA, Net Leverage, Capital, Financial Health
Boxed
Goldman Sachs
Saved
A column chart showing incremental sales growth from product innovation over several fiscal years, with a goal marker for FY19. The graph uses shades of blue and green to denote different years, with a simple, clean design.
Product and Service Analysis
Consumer Goods
Outlines Clorox's historical sales growth from innovation, setting a target for future growth. Useful in discussions on product development, innovation strategies, and financial forecasting.
innovation, sales growth, product development, Clorox, financial goals
Single Chart
Barclays
Saved
This slide features a detailed diagram and images emphasizing the importance of social impact in luxury purchasing decisions among younger generations. It combines text and visual elements like charts to convey complex social dynamics.
Market Analysis and Trends
Consumer Goods
Highlighting the growing importance of social impact in luxury purchasing, this slide discusses how younger generations, particularly Millennials and Gen Z, prioritize values like diversity and environmental sustainability in their buying decisions. It suggests a shift in luxury market strategies to accommodate these evolving consumer values.
luxury purchasing, social impact, Millennial and Gen Z, diversity, sustainability
Diagram
Bain
Saved
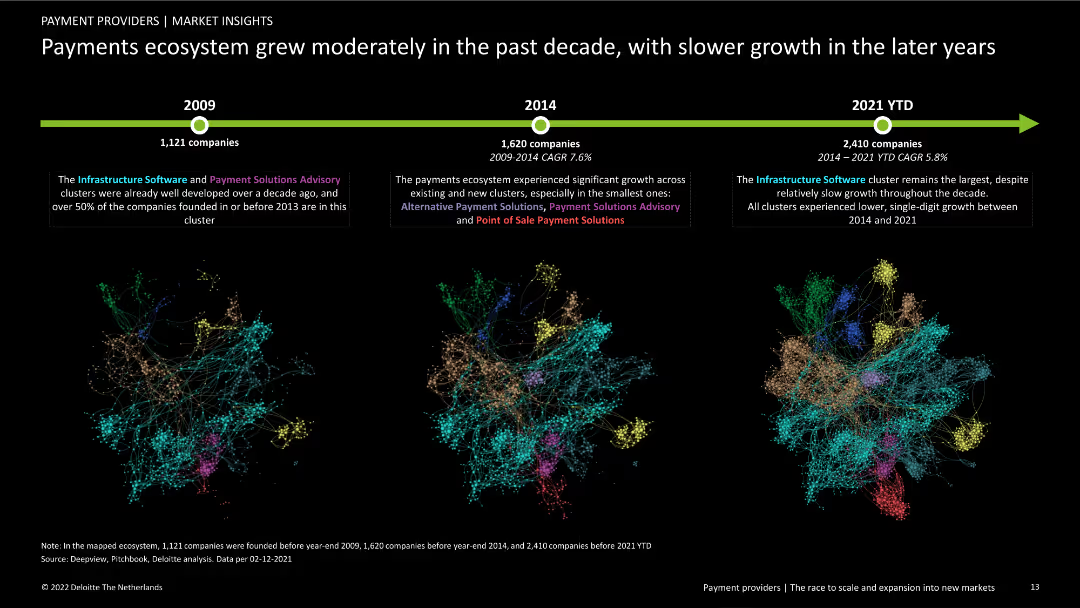
Contains three column charts showing the growth of companies from 2009, 2014, and 2021 YTD. Includes text boxes explaining cluster developments and a timeline at the top.
Market Analysis and Trends
Financial Services
Analysis of the growth in the European payments ecosystem over the past decade, focusing on company numbers and cluster evolution from 2009 to 2021.
growth, timeline, payments ecosystem, clusters, market analysis, financial services, trends, historical data, company numbers
Linear Flow
Deloitte
Saved
Multiple line graphs track retail goods sales, excluding auto and fuel, across various countries.
Strategic Planning
Retail & E-commerce
Discusses the shift in retail sales during the pandemic, comparing growth or decline across months and countries, offering insights into consumer behavior changes.
retail sales, trends, pandemic, analysis
Table
BCG
Saved
The slide presents a side-by-side comparison of old vs. new product frameworks with emphasis on features like sustainability and nutrition.
Product and Service Analysis
Consumer Goods
Explains the new holistic product design framework adopted since 2019, highlighting improvements in sustainability and nutritional content.
product design, sustainability, nutrition, strategic planning, holistic approach
Framework
Deutsche Bank
Saved
Features multiple bar charts grouped by firm size, revenue, and sector showing the percentage of budgets and revenues.
Financial Performance
Financial Services
Compares marketing budget allocations across different sectors and scales of business, indicating sector-specific investment tendencies. Ideal for sector analysis and budget planning.
marketing, budgets, industry, comparison, financial, sectors, planning, allocation
Multiple Chart
Deloitte
Saved
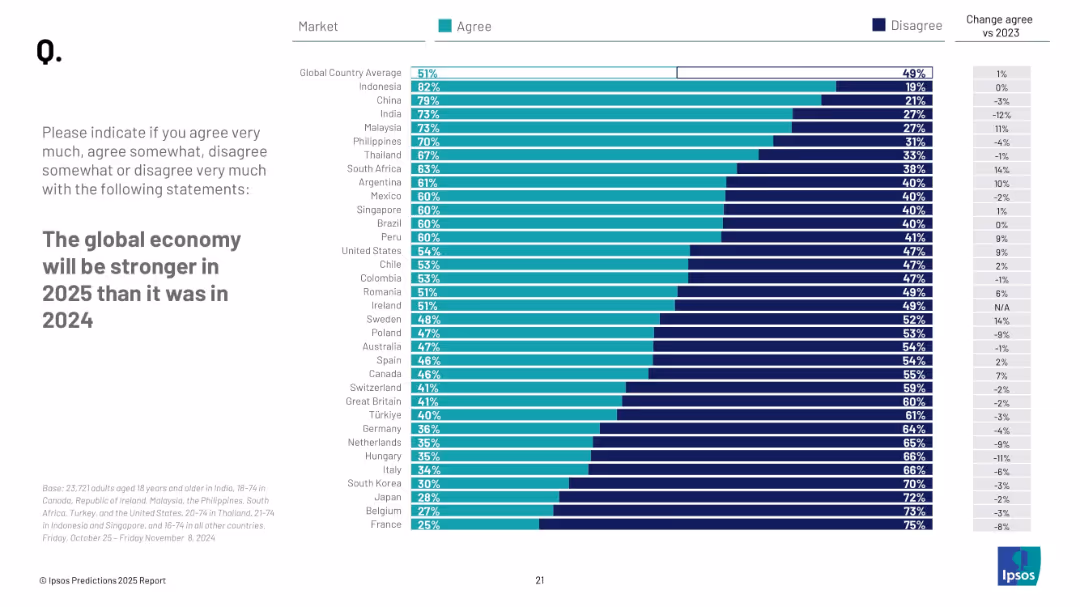
Bar chart with "Agree" and "Disagree" percentages by country; sorted descending by "Agree"; includes a "Change agree vs 2023" column on the right.
Market Analysis and Trends
Financial Services
This slide measures confidence in global economic recovery or strength in 2025, comparing multiple markets. It also shows how sentiment has changed versus the previous year (2023).
economic outlook, global economy, recovery expectations, country comparison, Ipsos, 2025 forecast
Mixed Chart
IPSOS
Saved
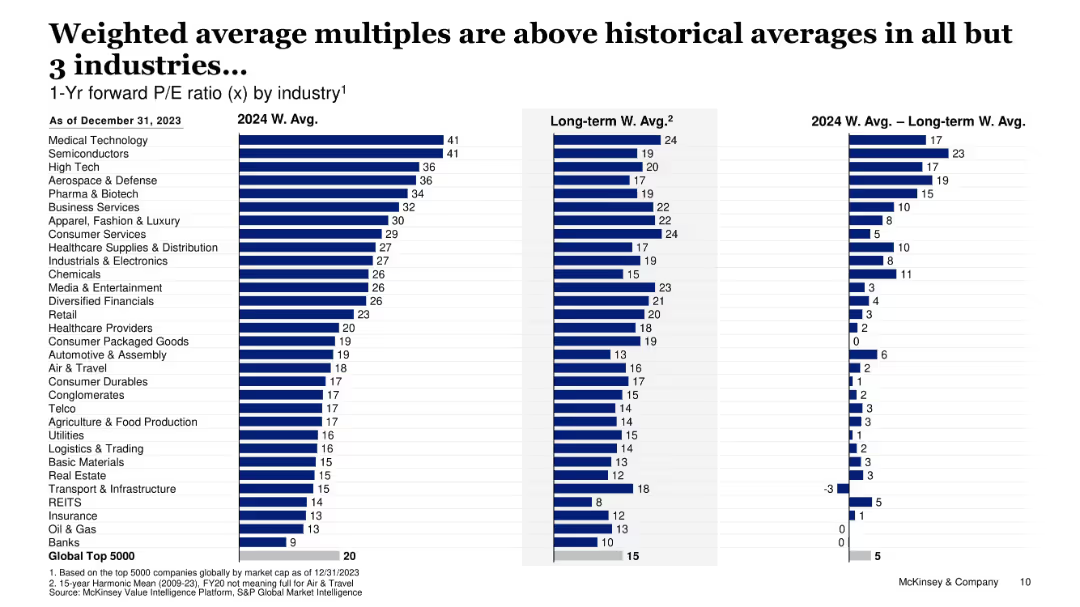
Bar charts comparing 2024 vs historical P/E ratios by industry
Financial Performance
Financial Services
Compares forward P/E ratios in 2024 against long-term averages across industries, showing elevated valuations in most, particularly in tech and medical sectors.
P/E ratio, valuation multiples, sector analysis, financial trends, overvaluation
Single Chart
McKinsey
Saved
Previous
Next
If nothing, comes up, please save your slides first
Create a FREE account to continue browsing
Receive Instant Access to 1,000+ slides from companies like McKinsey, Google, and Goldman Sachs
First Name
Last Name
Email
Password
I agree to all
Terms & Privacy Policy
Thank you! Your submission has been received!
Oops! Something went wrong while submitting the form.
Have an account?
Sign in
Column Chart
Heatmap
Chevron
Org Chart
Infographic
Callouts
Timeline
List
Graphic
Picture
Process Flow
Diagram
Paragraph
Map
Table
Framework
Subtitle
Takeaway Box
Icon
Other Chart
Radar Chart
Waterfall Chart
Mekko Chart
Pie Chart
Scatter Plot
Line Chart
Bar chart
Bullet points