My Account
My Slides
Search by Category
Templates
View All Templates
Download Template Slides
✦ AI Search
Feedback
Login
Logout
Get Started
Browse all Slides
Browse all Slides
Create a FREE Account
Instant access to 1,000+ real slides from top companies like McKinsey, BCG, Goldman Sachs, Google and many more!
First Name
Last Name
Email
Password
I agree to all
Terms & Privacy Policy
Thank you! Your submission has been received!
Oops! Something went wrong while submitting the form.
Have an account?
Sign in
Saved Slides
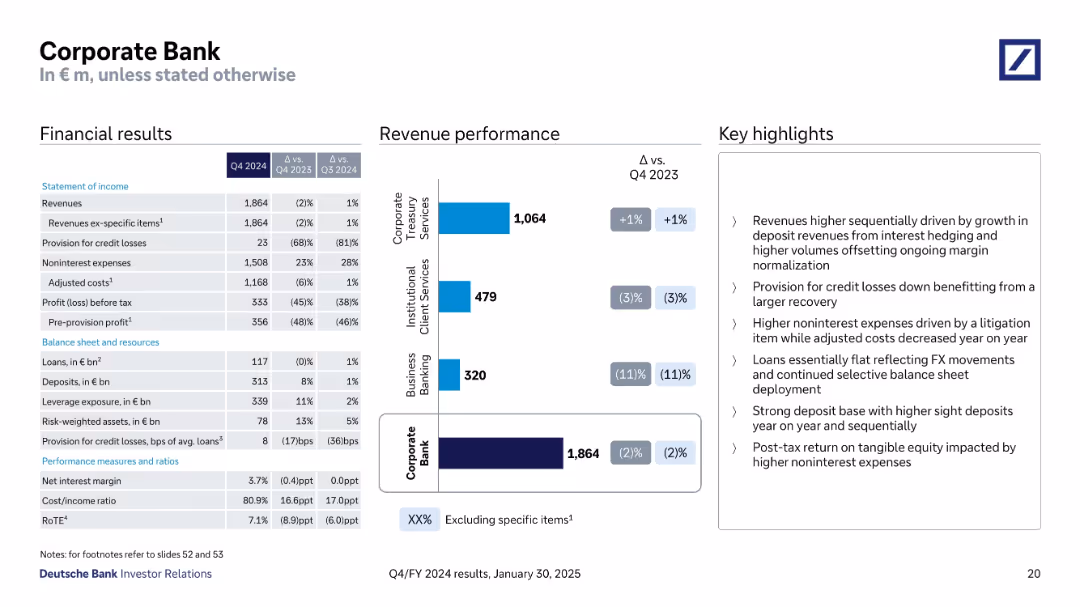
Three-panel format: financial results (left table), revenue performance (center bar chart), and key highlights (right).
Product and Service Analysis
Financial Services
Provides Q4 2024 financial and operational data for the Corporate Bank segment. Breaks down revenue by sub-segments and highlights margin trends, credit loss provisions, and cost movement. Notes deposit growth and impact from litigation on expenses.
corporate banking, revenue, deposit growth, litigation, segment analysis
Mixed Chart
Deutsche Bank
Saved
Column chart showing the Net Promoter Score (NPS) for recommending France as a country to settle from 2014 to 2019, with quotes from respondents.
Market Analysis and Trends
Professional Services
The slide presents the decline in NPS for recommending France as a place to settle, despite the positive feedback on quality of life.
NPS, settle, France, quality of life, decline, recommendation
Mixed Chart
Bain
Saved
Contains icons representing survey data on manager stress and support across countries.
Organizational Structure and Change
Professional Services
Examines the growing difficulties in management roles, highlighting issues like stress and lack of support, crucial for discussions on organizational restructuring and manager support systems.
management challenges, job stress, support, organizational change, survey data, international comparison, professional services, management trends
Header Horizontal
BCG
Saved
Slide includes comparative line graphs for various GDP scenarios worldwide. Uses shades of blue for differentiation.
Market Analysis and Trends
Financial Services
This slide analyzes multiple global GDP scenarios, aiding in understanding potential economic futures based on virus impacts.
GDP, Scenarios, Global, Economy, Forecast
Single Chart
McKinsey
Saved
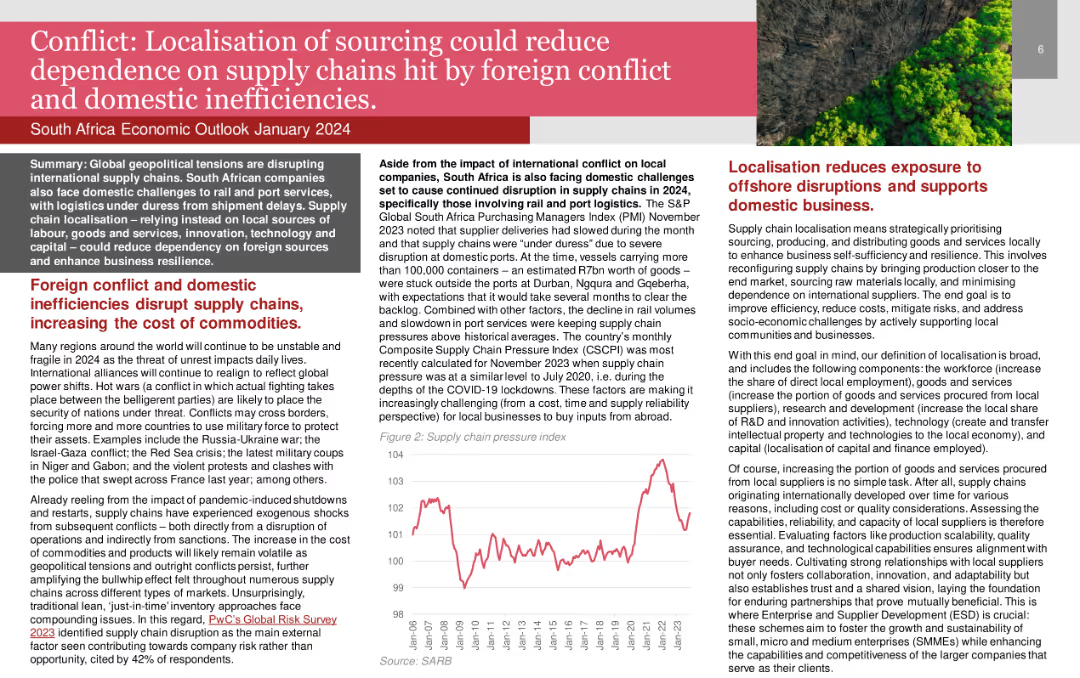
Line chart showing the Supply Chain Pressure Index over time.
Risk Assessment and Management
Transportation & Logistics
Highlights the benefits of localizing sourcing in South Africa to reduce reliance on disrupted international supply chains.
Localisation, Supply Chains, Conflict, Domestic Inefficiencies, South Africa
Mixed Chart
PwC/Strategy&
Saved
The slide has a bar chart of investment products held and a pie chart of the percentage invested in at least one financial product. Colors are used to distinguish categories.
Market Analysis and Trends
Financial Services
This slide presents data on the types of investment products held by respondents and the percentage of respondents with at least one financial product investment.
investment, products, financial, percentage, crypto
Multiple Chart
IPSOS
Saved
Utilizes column charts to compare potential ammonia markets by 2030, highlighting key importers and consumption levels.
Investment Analysis
Energy & Utilities
Evaluates export opportunities for Chile in ammonia, focusing on markets like China, EU, and USA.
ammonia, exports, Chile, market analysis, China, EU, USA, consumption
Single Chart
McKinsey
Saved
A pie chart illustrating the proportion of users who recall receiving risk information from crypto trading platforms in 2023, compared to 2022.
Risk Assessment and Management
Financial Services
This slide shows the percentage of users who remember receiving risk information before purchasing crypto assets, comparing 2023 with 2022.
Risk, information, crypto, trading, platforms, 2023, 2022
Mixed Chart
IPSOS
Saved
Contains an octagonal diagram highlighting various aspects of education reform needed to bridge the skills gap due to automation. The diagram emphasizes areas like lifelong learning, employer-informed curricula, integration of stakeholders, and policy development.
Human Resources and Talent Management
Education & Training
This slide proposes a multi-faceted approach to educational reform aimed at bridging the skills gap created by technological advancements. It emphasizes the importance of dynamic, continuous learning and collaboration between educational institutions and employers, presenting a framework for future discussions on enhancing the adaptability and skill levels of the workforce.
education reform, skills gap, lifelong learning, policy
Framework
McKinsey
Saved
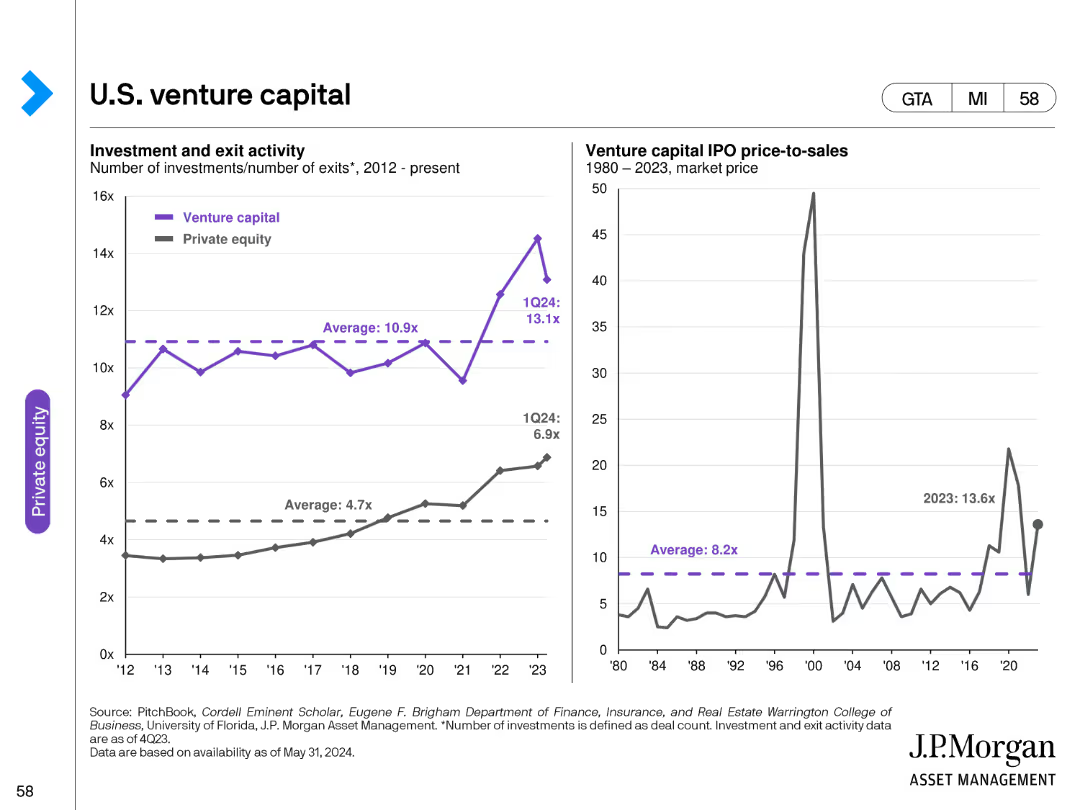
The slide features two line charts: one showing venture capital investment and exit activity, and the other depicting IPO price-to-sales ratios over time.
Investment Analysis
Financial Services
It provides a detailed analysis of U.S. venture capital activities, highlighting investment and exit trends as well as IPO price-to-sales ratios.
venture capital, U.S., investments, exits, IPO, price-to-sales, trends, financial, data analysis
Multiple Chart
JP Morgan
Saved
The slide features charts and graphs on performance metrics, quality & security, and automation, illustrating improvements in coding hours, reduction in incidents, and increased automation.
Performance Metrics and KPIs
Technology & Software
This slide highlights the impact of tool chain telemetry on improving coding output, quality, and market delivery time, with specific metrics and visualizations.
telemetry, coding output, quality, security, automation, performance metrics, KPIs, coding hours, incidents reduction, market delivery
Multiple Chart
Credit Suisse
Saved
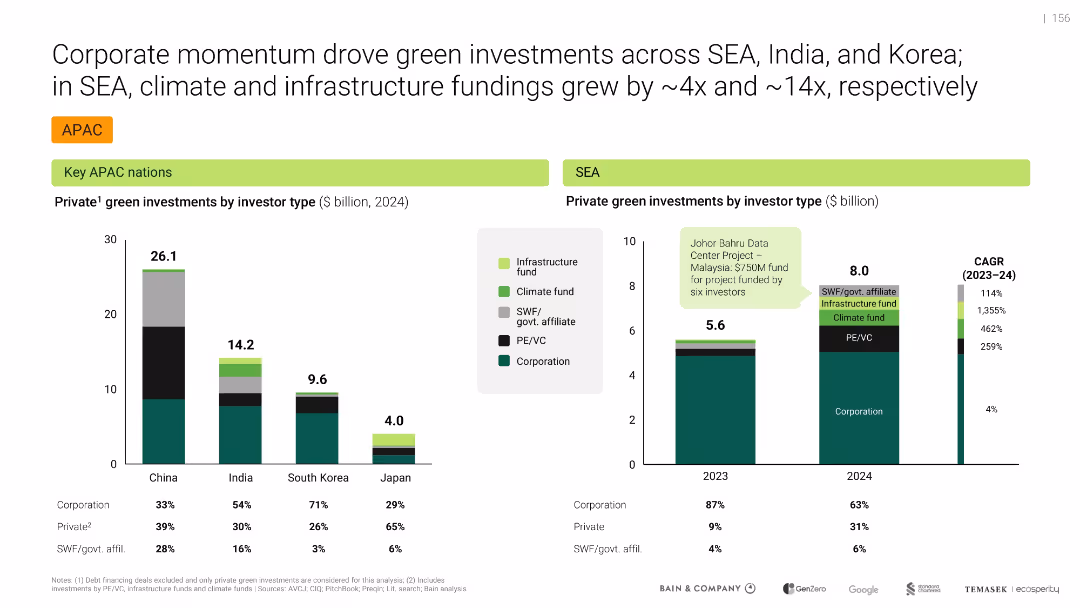
Dual bar charts for APAC and SEA investment by investor type, color-coded with clear segmentation
Investment Analysis
Environmental Services & Sustainability
Analyzes investor-type contributions to private green investments across key APAC nations and SEA. Corporate investors led in 2023; in 2024, private and government-related investors showed sharp growth, particularly in Malaysia.
APAC, SEA, Investor types, Green funding, Corporations, PE/VC, Climate funds, Infrastructure, Growth, Malaysia
Multiple Chart
Bain
Saved
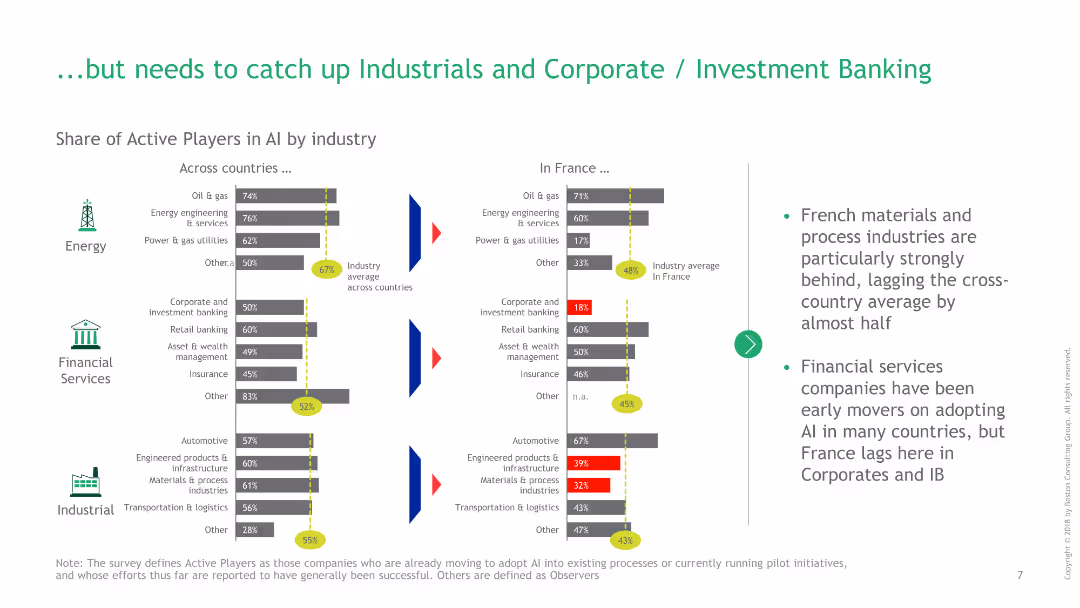
Bar charts showing the share of active AI players in energy, financial services, and industrial sectors between France and other countries.
Competitive Landscape
Financial Services
This slide highlights areas where France lags in AI adoption, particularly in industrial and corporate banking sectors, compared to other countries.
AI, France, financial services, industrial, investment banking, energy, comparison, active players, bar charts, industry average
Multiple Chart
BCG
Saved
Contains multiple line graphs depicting a hypothetical recurrent virus impact on GDP. Colored lines represent different regions.
Market Analysis and Trends
Financial Services
Discusses how a potential virus recurrence could impact GDP in various major economies, useful for strategic economic planning.
GDP, Recurrence, Virus, Economic impact, Planning
Single Chart
McKinsey
Saved
The slide contains text, percentage data, and circular charts showing expected benefits of Generative AI for IT & InfoSec leaders and realized benefits for D&A leaders.
Strategic Planning
Technology & Software
This slide highlights the benefits of Generative AI as seen by IT & InfoSec leaders and D&A leaders, including financial performance, model accuracy, and data privacy.
Generative AI, Benefits, IT Leaders, Financial Performance, D&A Leaders
Mixed Chart
Gartner
Saved
Scatter plot correlating the S&P 500 share of oil and gas with Brent oil prices over time, differentiated between 2000-2015 and 2016-June 2019.
Market Analysis and Trends
Financial Services
This slide presents the declining trend of oil and gas industries' share in the S&P 500 index relative to oil prices, suggesting shifts in energy sector valuations influenced by market and price factors.
oil, gas, S&P 500, market trends, Brent oil
Single Chart
BCG
Saved
This slide features a circular diagram and a list of bullet points to the left, explaining the current ESG landscape on the Isle of Man. It uses a simple color scheme, primarily red and black, to denote various aspects of the regulatory environment and company reactions.
Regulatory and Compliance
Environmental Services & Sustainability
This slide addresses the lack of ESG regulation in the Isle of Man, noting that companies are still developing strategies due to external pressures and market expectations. It's used to discuss how entities can prepare for future regulations and leverage ESG for value, despite current non-regulation.
ESG, Regulation, Isle of Man, Market Expectations, Strategy Development, Diagram
Framework
PwC/Strategy&
Saved
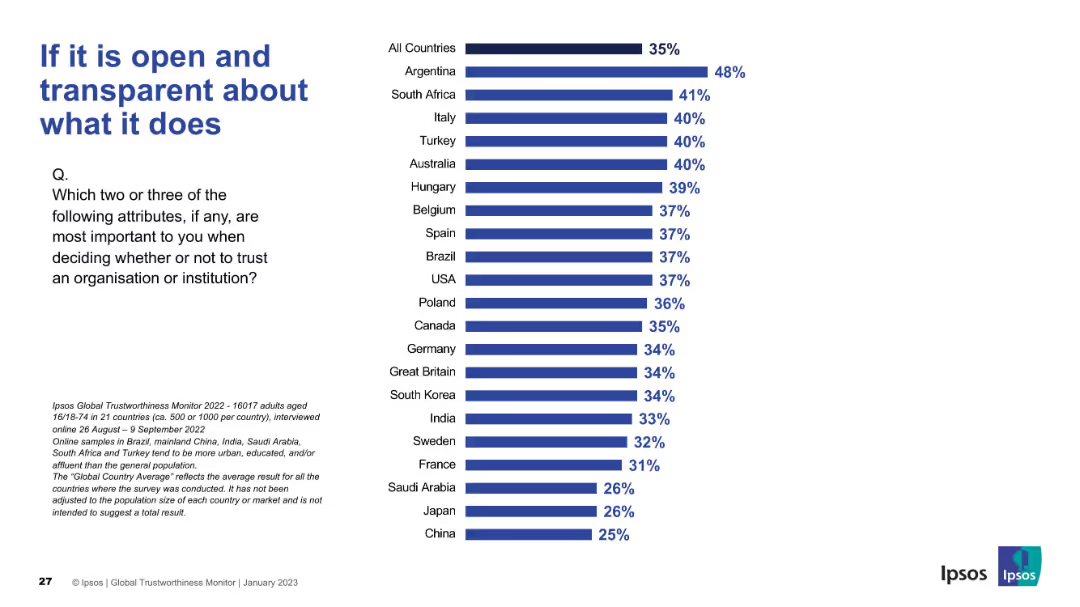
Features a global country bar ranking. Argentina ranks highest in prioritizing transparency. Uniform Ipsos slide layout.
Market Analysis and Trends
Professional Services
Transparency is shown as a top driver of organizational trust, especially in Argentina and South Africa. Consistent chart format with clear visual emphasis.
transparency, open communication, trust, Ipsos, survey insights, values
Mixed Chart
IPSOS
Saved
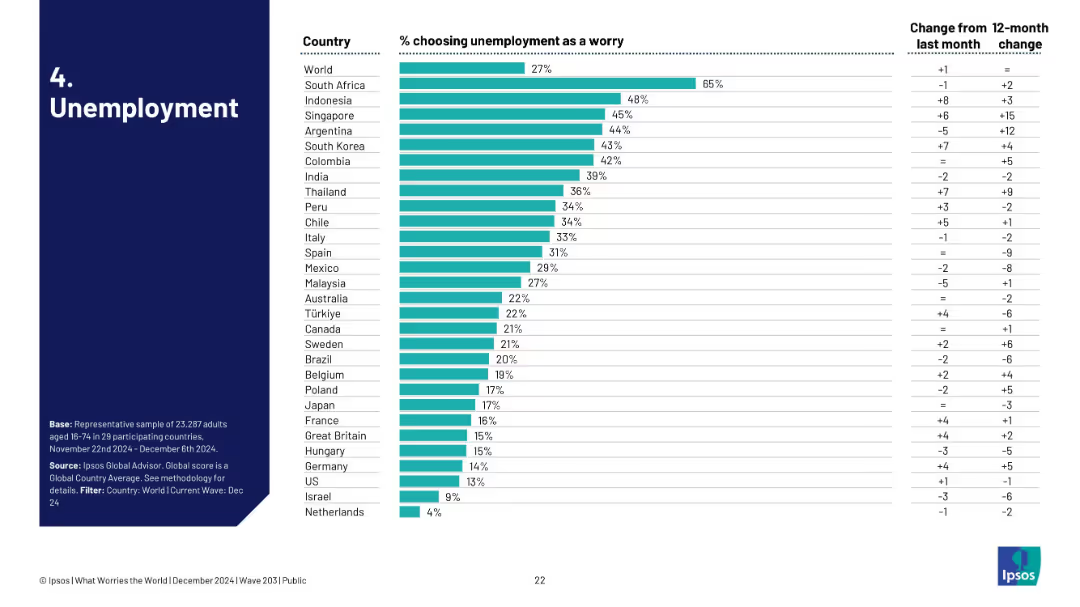
Bar chart of countries with highest concern over unemployment, includes trend comparison to last month and last year.
Performance Metrics and KPIs
Financial Services
The slide reveals 27% globally worry about unemployment. South Africa tops at 65%. It offers insight into short-term and long-term shifts, with notable concern increases in Singapore and Argentina.
unemployment, labor market, joblessness, global survey, economic trends
Single Chart
IPSOS
Saved
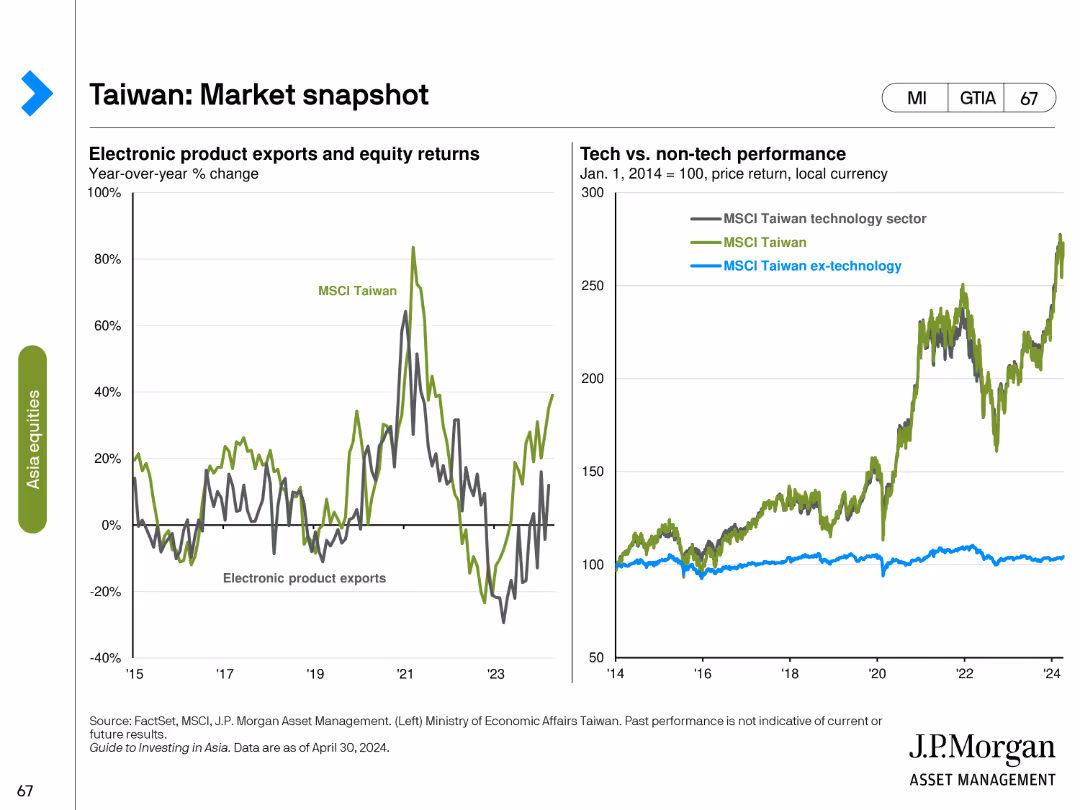
This slide includes two line charts: one showing electronic product exports and equity returns, and the other showing the performance of the MSCI Taiwan technology sector versus non-technology sectors.
Market Analysis and Trends
Financial Services
The slide provides an overview of Taiwan's market, focusing on the relationship between electronic product exports and equity returns, and comparing the performance of technology and non-technology sectors to identify key market drivers.
Taiwan, market snapshot, electronic exports, equity returns, MSCI Taiwan, technology sector, non-technology, market drivers, financial analysis, market overview
Multiple Chart
JP Morgan
Saved
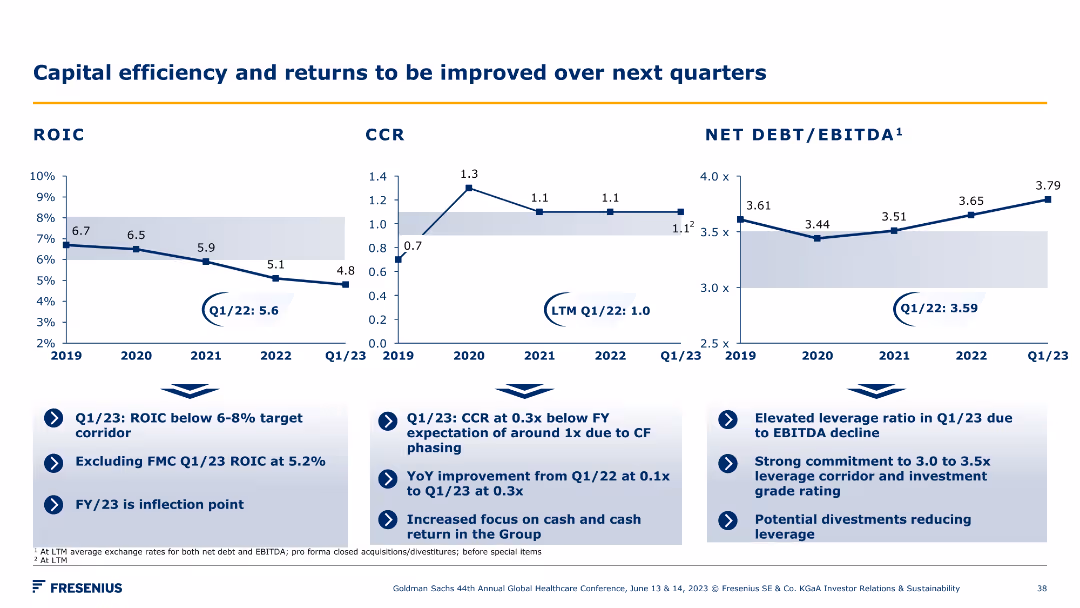
A series of line charts showing ROIC, CCR, and Net Debt/EBITDA trends over several years. Accompanied by bullet points summarizing key insights and improvement strategies.
Financial Performance
Financial Services
The slide presents trends in capital efficiency metrics like ROIC and CCR, and outlines strategies to improve returns and leverage over the next quarters.
ROIC, CCR, Net Debt, EBITDA, efficiency, returns
Multiple Chart
Goldman Sachs
Saved
Two pie charts comparing firmwide revenue by region and segment, additional infographics for headcount diversity. Blue and white color scheme with a structured layout.
Strategic Planning
Financial Services
Explores the international revenue distribution by region and segment and highlights diversity in workforce composition, emphasizing the company's global market reach.
Revenue distribution, diversity, global market, segmentation
Mixed Chart
Goldman Sachs
Saved
A slide with detailed text analysis on the left and a pie chart on the right illustrating the preferred online discovery channels for consumers.
Market Analysis and Trends
Retail & E-commerce
Analyzes the preferred online channels for product discovery, indicating a high preference for social media and video content as sources for finding new products and making purchasing decisions.
Discovery commerce, social media, video content, consumer preferences, pie chart
Single Chart
Bain
Saved
Two column charts comparing industry compliance costs and Credit Suisse compliance costs, with other performance metrics.
Regulatory and Compliance
Financial Services
The slide presents advanced technical capabilities to manage risk and compliance costs, showing industry and Credit Suisse comparisons.
Compliance costs, technical capabilities, risk management, industry comparison, performance metrics
Multiple Chart
Credit Suisse
Saved
The slide shows a complex diagram outlining the value chain of hydrogen-based energy conversion solutions. It includes multiple boxes connected by arrows, illustrating the flow from power-to-power, power-to-gas, and power-to-mobility applications.
Technology and Digital Transformation
Energy & Utilities
This slide explains the Power-to-X process, detailing how electricity is converted into hydrogen for various applications, including power generation, gas blending, and mobility. It highlights the different stages and technologies involved.
Power-to-X, hydrogen, energy conversion, power generation, mobility
Diagram
Kearney
Saved
Previous
Next
If nothing, comes up, please save your slides first
Create a FREE account to continue browsing
Receive Instant Access to 1,000+ slides from companies like McKinsey, Google, and Goldman Sachs
First Name
Last Name
Email
Password
I agree to all
Terms & Privacy Policy
Thank you! Your submission has been received!
Oops! Something went wrong while submitting the form.
Have an account?
Sign in
Column Chart
Heatmap
Chevron
Org Chart
Infographic
Callouts
Timeline
List
Graphic
Picture
Process Flow
Diagram
Paragraph
Map
Table
Framework
Subtitle
Takeaway Box
Icon
Other Chart
Radar Chart
Waterfall Chart
Mekko Chart
Pie Chart
Scatter Plot
Line Chart
Bar chart
Bullet points