My Account
My Slides
Search by Category
Templates
View All Templates
Download Template Slides
✦ AI Search
Feedback
Login
Logout
Get Started
Browse all Slides
Browse all Slides
Create a FREE Account
Instant access to 1,000+ real slides from top companies like McKinsey, BCG, Goldman Sachs, Google and many more!
First Name
Last Name
Email
Password
I agree to all
Terms & Privacy Policy
Thank you! Your submission has been received!
Oops! Something went wrong while submitting the form.
Have an account?
Sign in
Saved Slides
The slide includes a waterfall chart depicting changes in tangible book value per share (TBVPS) from 3Q22 to 4Q22.
Financial Performance
Financial Services
This slide explains the impact of the rights issue and net loss on TBVPS, detailing various contributing factors like FX and own credit.
TBVPS, rights issue, net loss, tangible book value, financial impact
Single Chart
Credit Suisse
Saved
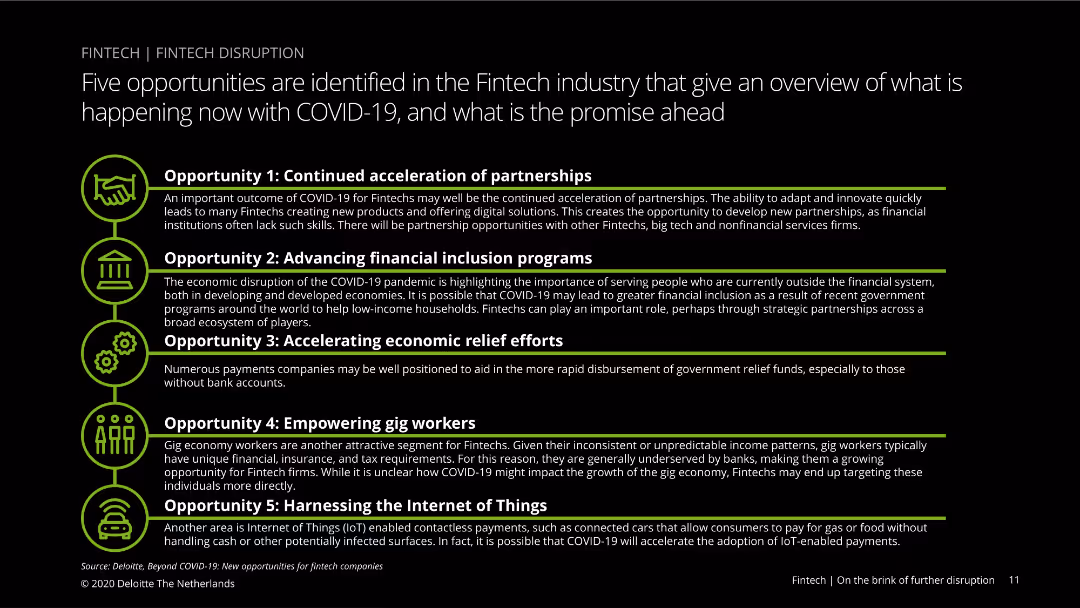
Features five opportunities for fintechs during COVID-19, each with an icon and brief text description. Opportunities include partnerships, financial inclusion, economic relief, etc.
Strategic Planning
Financial Services
Identifies and explains five key opportunities for fintech companies during the COVID-19 pandemic, such as partnerships, advancing financial inclusion, and leveraging the Internet of Things.
fintech, opportunities, COVID-19, partnerships, financial inclusion, economic relief, gig workers, IoT, strategic planning, innovation
Vertical Flow
Deloitte
Saved
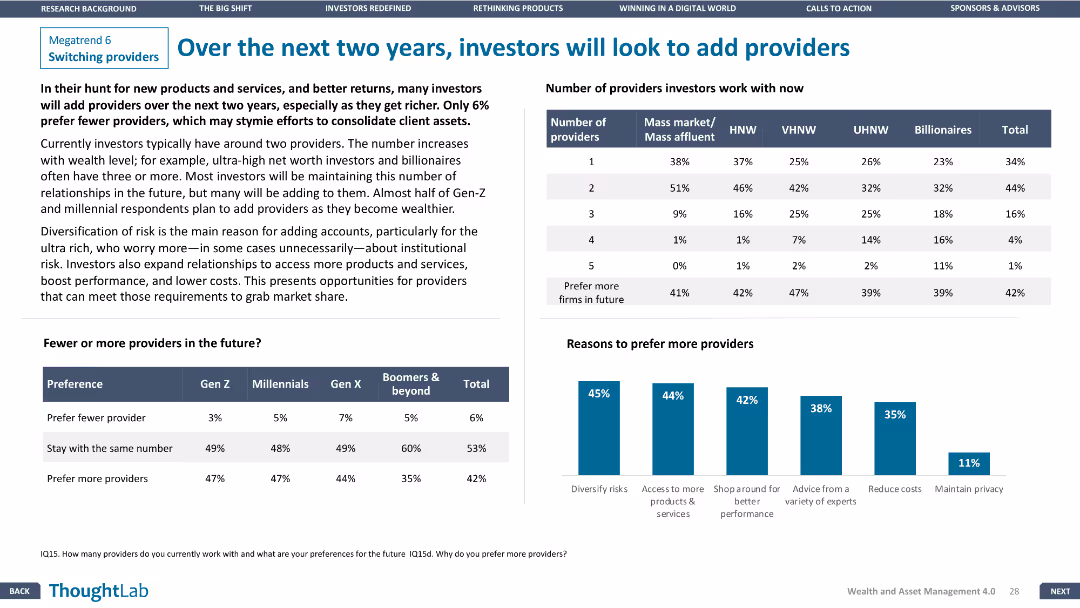
Column chart and bar graph showing investor preferences for number of providers and reasons for preferring more providers. Design is informative and clear.
Customer and Market Segmentation
Financial Services
Discusses future trends in investor preferences for the number of financial service providers and the main reasons for preferring more providers.
providers, investors, preferences, trends, reasons
Mixed Chart
Deloitte
Saved
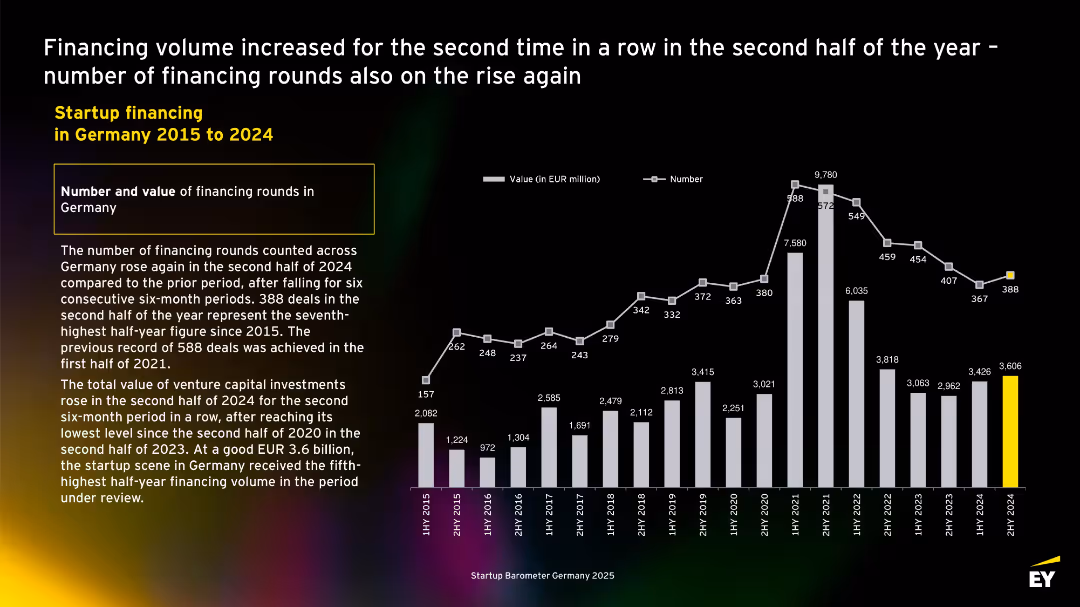
Dual-axis bar and line chart with semiannual VC data (2015–2024); left-aligned summary notes deal recovery and funding volume trends.
Investment Analysis
Financial Services
This slide presents semiannual VC trends in Germany. It highlights a funding recovery in 2H 2024, with €3.6B invested and 388 deals—the seventh-highest since 2015. The data show rebounding investor interest after prior declines.
semiannual trends, VC recovery, German startups, 2024 deals, financing volume, startup investment, historical comparison
Mixed Chart
EY
Saved
Pie chart showing the proportion of respondents who have sold or are considering selling investments to cover monthly expenses. Text provides additional context and insights.
Risk Assessment and Management
Financial Services
The slide presents data on the percentage of Canadian investors who sold or considered selling investments to cover monthly expenses due to financial strain during COVID-19. It highlights demographic differences and the factors influencing these decisions.
Investments, Monthly Expenses, COVID-19, Canadian, Selling
Mixed Chart
IPSOS
Saved
Slide features a world map pinpointing major hydrogen projects globally, supplemented by logos of participating companies.
Strategic Planning
Energy & Utilities
Highlights global investment in hydrogen projects, showing collaborations that aim to achieve technological and commercial maturity in the energy sector.
hydrogen projects, global investment, strategic planning, energy sector, industrial collaboration
Graphic
McKinsey
Saved
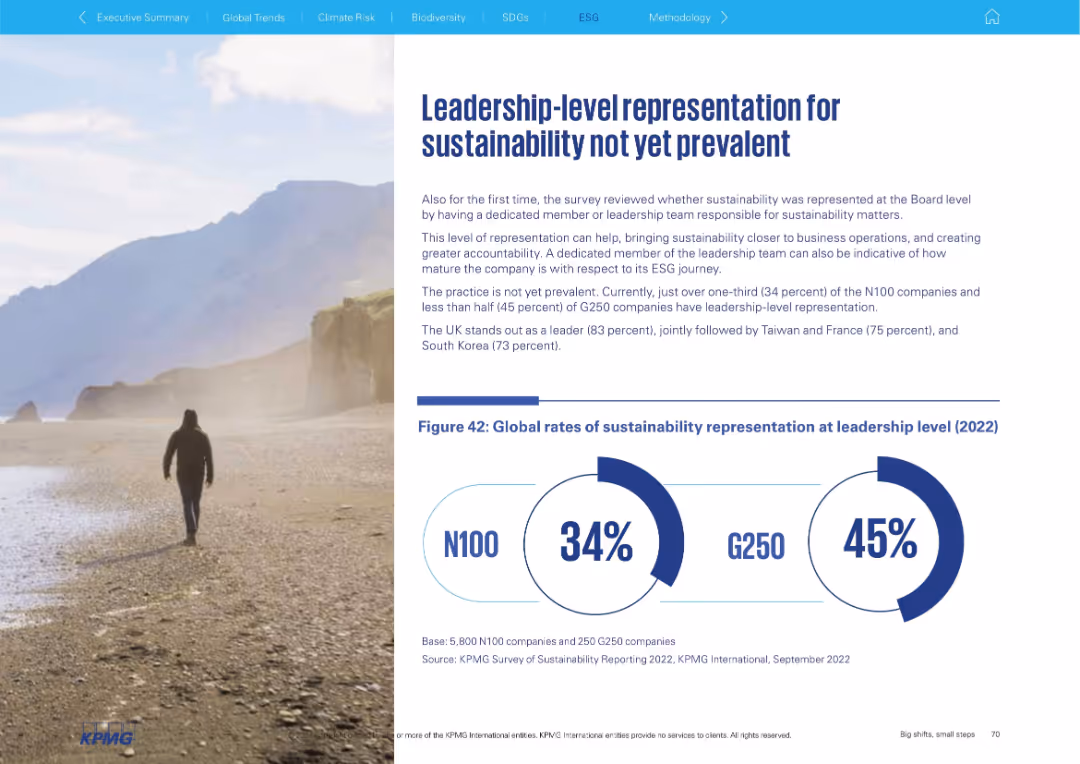
Visual of a person on a beach, with text and circular data graphs showing % of leadership representation in N100 and G250.
Human Resources and Talent Management
Professional Services
This slide discusses the relatively low adoption of sustainability-focused leadership roles. Just 34% of N100 and 45% of G250 companies have board-level sustainability roles. The UK, Taiwan, and France lead.
leadership, sustainability roles, ESG governance, board-level, G250, N100, accountability, representation
Mixed Chart
KPMG
Saved
Contains multiple bar graphs and textual analysis. Utilizes a clean, professional layout focusing on M&A trends in the Philippines, including top bidders and deal values.
Mergers and Acquisitions
Financial Services
Provides a detailed analysis of domestic and inbound M&A in the Philippines, including major deals and sector breakdown for top bidders from 2018 to 2020.
M&A, Philippines, domestic, inbound, deal analysis, sectors, bidders
Mixed Chart
Deloitte
Saved
Contains a series of bar charts that represent the percentage of the largest Danish companies engaging with various SDGs, with color-coding corresponding to different SDG goals.
Market Analysis and Trends
Environmental Services & Sustainability
This slide reviews the SDG engagement of top Danish companies, showing high involvement in goals related to industry, innovation, and climate action, as reported in their annual sustainability reports.
SDGs, Danish companies, sustainability reporting, corporate engagement
Single Chart
McKinsey
Saved
The slide contains two column charts. The first chart shows corporate cash as a percentage of current assets by sector. The second chart shows research & development and capital expenditure by sector.
Financial Performance
Financial Services
This slide details cash and capital expenditure in the United States by sector, focusing on corporate cash holdings and investment in research & development. It is used for financial performance analysis and strategic planning.
United States, cash, capital expenditure, sector, research & development, financial performance
Multiple Chart
JP Morgan
Saved
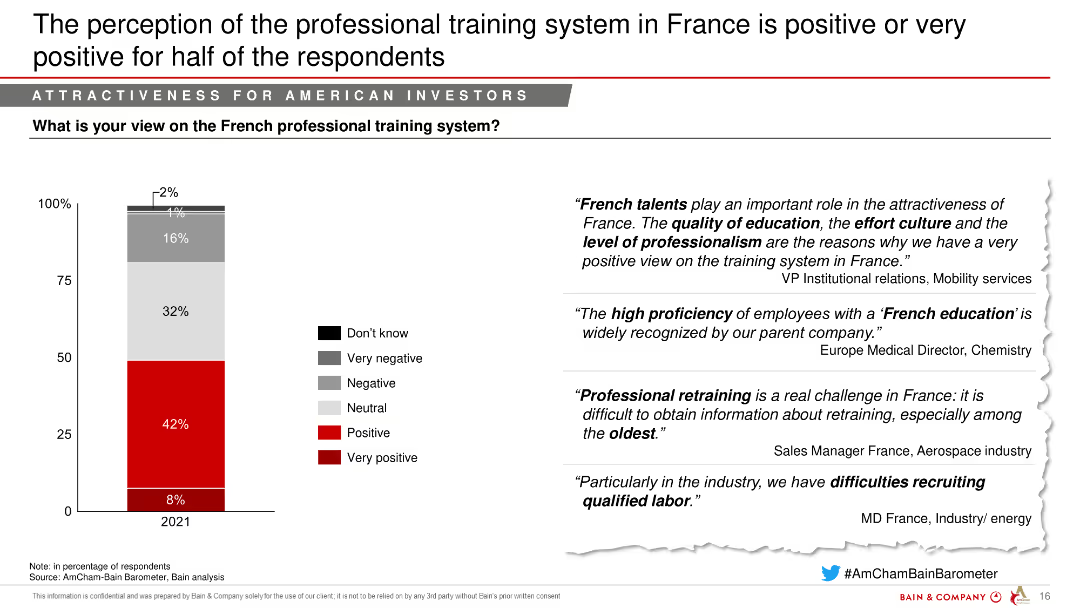
The slide features a column chart showing the perception of France's professional training system in 2021, segmented into positive, very positive, and other categories. Quotes from industry leaders are on the right.
Market Analysis and Trends
Government & Public Sector
This slide presents the perception of France's professional training system, indicating a generally positive outlook from respondents.
Professional training, Perception, Positive outlook, Aerospace, Defense
Mixed Chart
Bain
Saved
This slide features a world map with highlighted cities and corresponding icons that denote specific water supply challenges. There are bullet points with percentage statistics for each city, indicating problems like pollution, water use inefficiency, and infrastructure issues. It includes data visualizations like icons and a simple color code to represent various data points about water accessibility and issues in megacities like Mexico City, Buenos Aires, Nairobi, Kolkata, Karachi, and Shanghai.
Market Analysis and Trends
Environmental Services & Sustainability
The slide presents a comparison of water-related challenges faced by megacities across the globe. It highlights issues such as pollution, water use inefficiency, and inadequate infrastructure, providing a clear snapshot of major urban water management challenges.
water supply, pollution, megacities, infrastructure, sanitation, global health, urban planning, sustainability, resource management, water accessibility
Graphic
Roland Berger
Saved
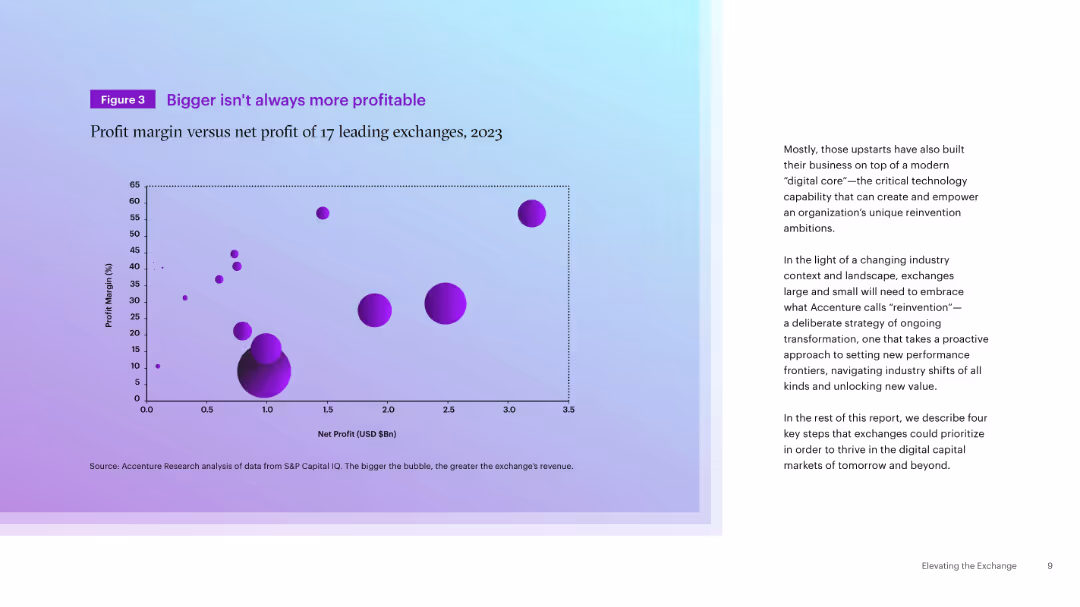
Left-aligned scatter plot with bubble chart (profit margin vs. net profit), accompanied by paragraph text on the right. Purple gradient background.
Financial Performance
Financial Services
The slide presents a bubble chart comparing the profit margins and net profits of 17 global exchanges in 2023, demonstrating that size does not equate to profitability. The accompanying text discusses the need for reinvention driven by digital transformation.
Profitability, Exchanges, Net Profit, Profit Margin, Digital Core, Reinvention, Financials, Market Performance, 2023
Mixed Chart
Accenture
Saved
Multiple small column charts integrated with a world map, color-coded to indicate different regions. Includes icons and labels for external factors affecting market growth.
Market Analysis and Trends
Transportation & Logistics
Predicts a 60% worldwide market share for battery electric vehicles by 2035 with regional differences. Factors like legislation, subsidies, and infrastructure development are highlighted as influences on market growth.
BEV, market share, 2035, global, electric vehicles
Multiple Chart
BCG
Saved
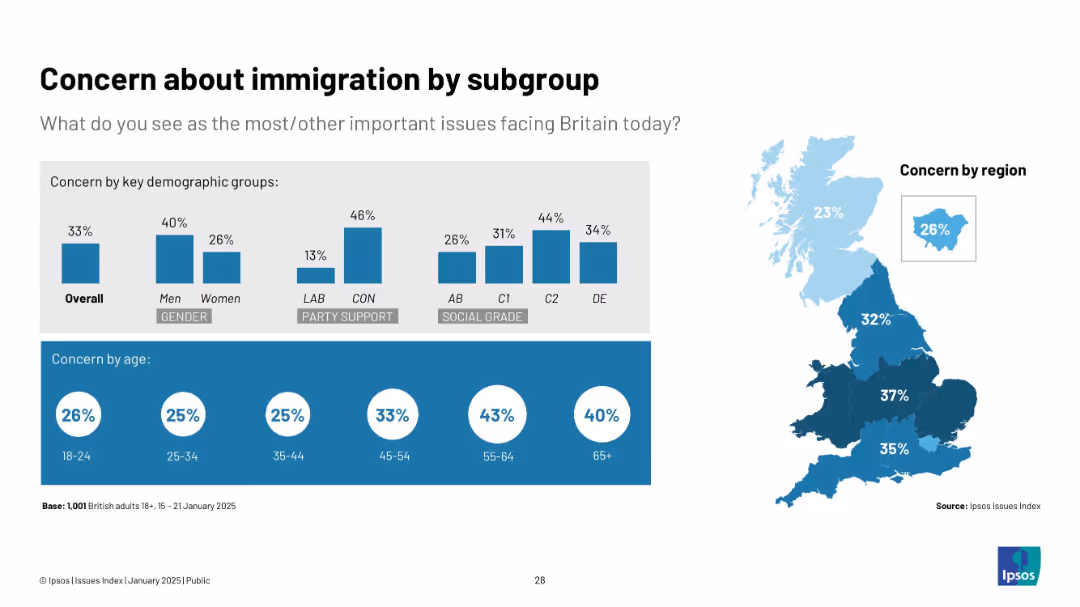
Mixed visuals: bar charts by gender, party, social grade, age + regional heat map.
Market Analysis and Trends
Government & Public Sector
This slide shows which subgroups are most concerned about immigration. Older adults and Conservative supporters show highest concern, while younger age groups show lower interest. Regional differences are also mapped.
immigration, region, age, politics, Ipsos, concern
Multiple Chart
IPSOS
Saved
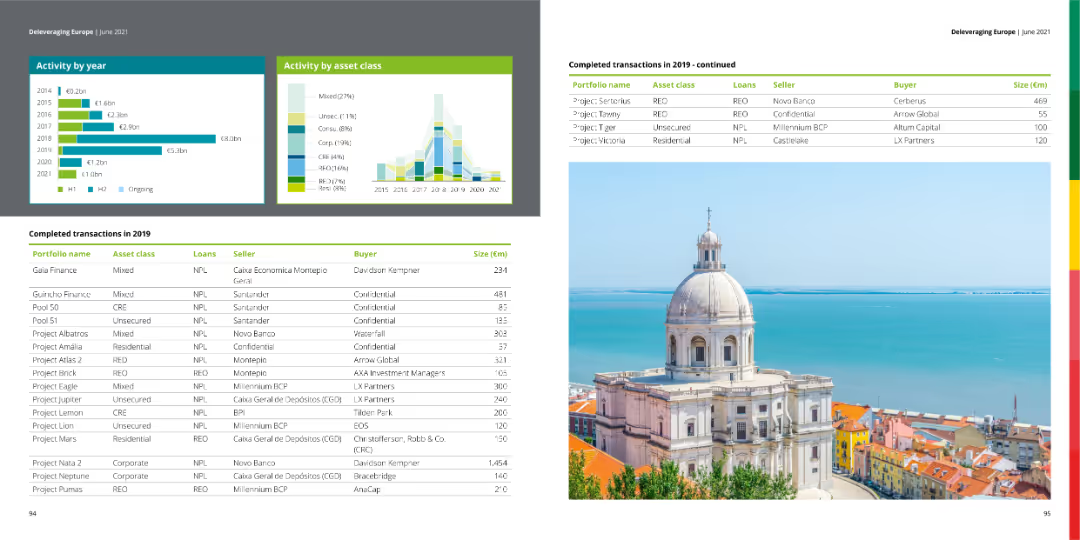
The slide contains column charts showing top sellers and buyers in 2019 and 2020. It also includes two tables of transaction data.
Financial Performance
Financial Services
This slide details completed transactions in 2020 and ongoing ones in 2021, showing top sellers and buyers with financial details.
transactions, financial services, column chart, sellers, buyers
Multiple Chart
Deloitte
Saved
This slide contains six circular blue icons with human silhouettes, each representing different categories of global digital engagement. These categories are labeled and quantified, such as 'Social networking users' or 'Cross-border e-commerce shoppers'. The icons vary in size reflecting the quantities they represent.
Market Analysis and Trends
Technology & Software
The slide presents statistics on individuals globally engaged in various activities, illustrating the significant number of people involved in social networking, travel, e-commerce, and education, enabled by digital means. It could be used in presentations analyzing global digital market trends or digital consumer behavior.
digital, global engagement, social networking, e-commerce, travel, education, statistics
Multiple Chart
McKinsey
Saved
The slide features text and two column charts. The charts outline elements of digital asset strategy pursued by banks and methods for informing the strategy.
Technology and Digital Transformation
Financial Services
It discusses the development of digital asset strategies by banks, including key elements and methods for effectively implementing and managing digital assets.
Digital assets, strategy, development, banks, management
Multiple Chart
EY
Saved
The slide is divided into two vertical sections with headers in dark blue. Each section has a thematic icon and contains text blocks describing company case studies. Page number is at the bottom right.
Client Case Studies
Financial Services
This slide presents two case studies related to sustainable finance: one focusing on clean energy through a partnership with BlocPower, and the other on community empowerment with the National Urban League. The slide details the company's contributions and solutions, such as providing equity and debt financing, and is suitable for demonstrating the impact and scope of the presenter's sustainable finance initiatives in real-world applications.
Case Studies, Clean Energy, Community, Finance, Equity, Debt, Empowerment, Sustainability
Table
Goldman Sachs
Saved
This slide features a complex line chart comparing inflation trends over time among the US, Eurozone, and UK. The chart is accompanied by detailed text explanations on both sides, highlighting key statistics and analysis.
Financial Performance
Financial Services
The slide compares inflation rates across developed economies with insights into potential economic rebounds and consumer confidence. It's suited for financial analysis presentations or economic briefings, offering a detailed view of inflation trends and their implications for future policies and decisions.
inflation, economic trends, line chart, developed economies, financial analysis, policy implications
Mixed Chart
McKinsey
Saved
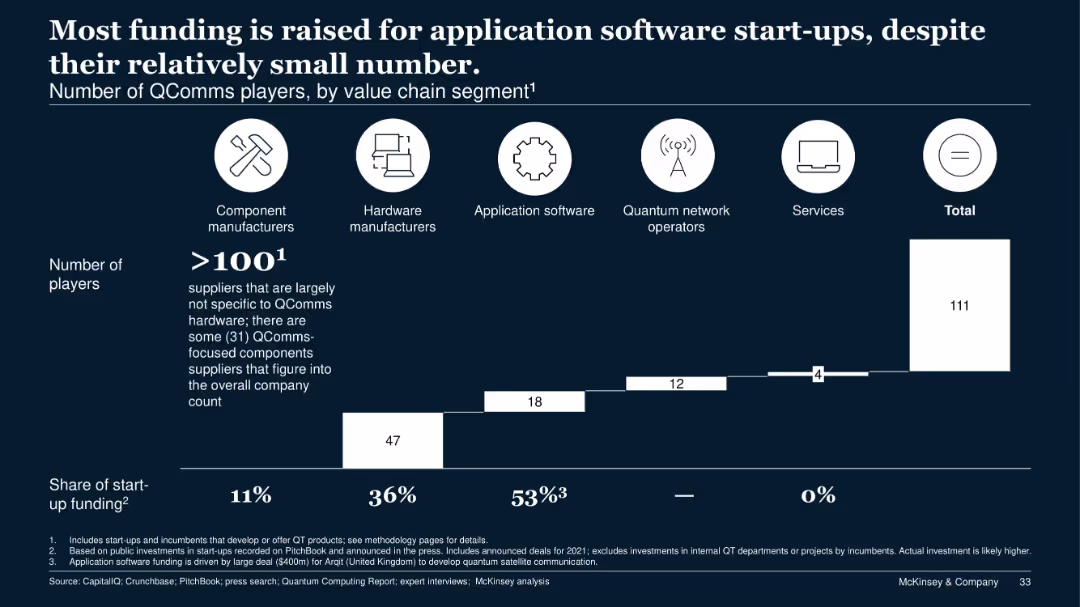
Horizontal bar chart and proportional block layout with white-on-navy theme, showing number of QComms players and startup funding shares across value chain segments.
Strategic Planning
Technology & Software
This slide breaks down the quantum communications (QComms) ecosystem by value chain, showing that most startup funding flows to application software companies, even though they represent a small portion of the total number of players. Component and hardware manufacturers also attract significant attention.
QComms, start-ups, application software, funding, value chain, investment, quantum tech, segmentation
Single Chart
McKinsey
Saved
This slide presents column charts comparing sector and regional financial data, with a focus on technology and China from 2015 to 2019.
Financial Performance
Financial Services
The slide shows financial performance variability across sectors and regions, highlighting opportunities for capturing market share.
Sector Wallet, Regional Wallet, Financial Data, Bar Chart, Technology, China, Market Share, Opportunities
Multiple Chart
JP Morgan
Saved
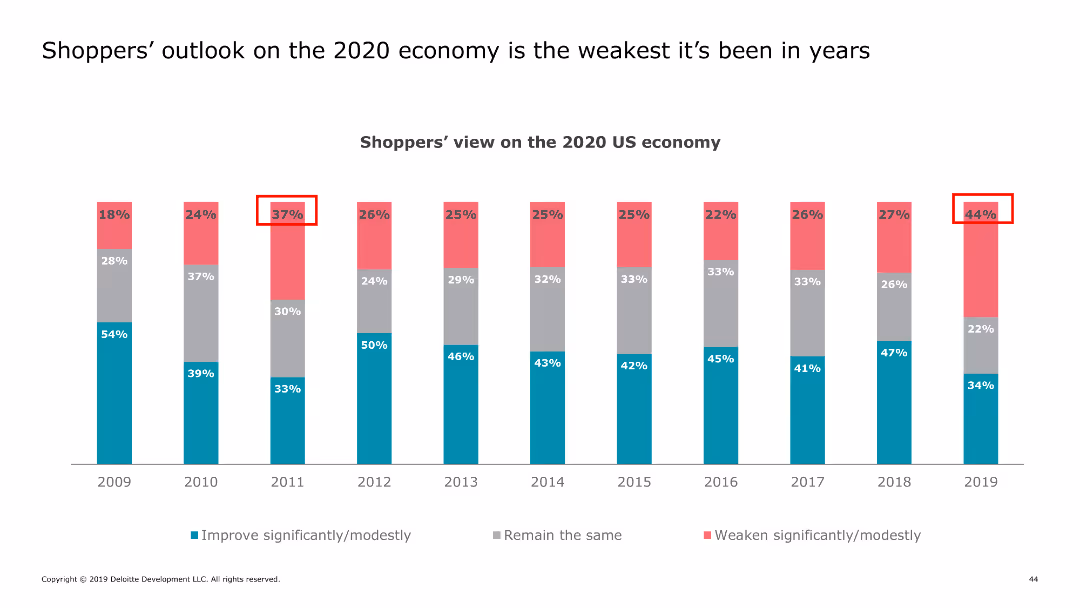
This slide presents a column chart tracking shoppers' views on the US economy over multiple years, with emphasis on the 2020 outlook. Different colors represent different levels of optimism.
Market Analysis and Trends
Retail & E-commerce
It reviews the declining optimism of shoppers regarding the US economy for the year 2020, compared to previous years, indicating a weak economic outlook.
economy, outlook, shoppers, US, trends
Single Chart
Deloitte
Saved
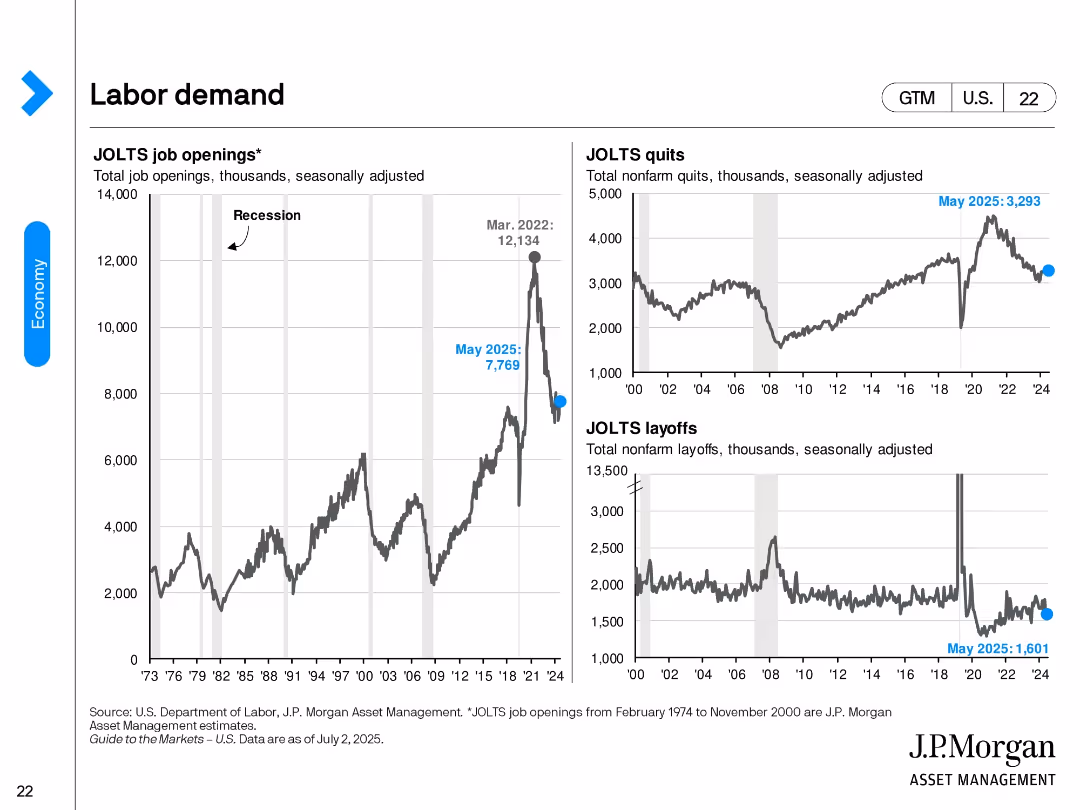
Three-panel layout showing JOLTS job openings, quits, and layoffs with long-term historical data. All charts are line graphs with recession periods shaded. Current values as of May 2025 are labeled.
Performance Metrics and KPIs
Financial Services
Examines labor market tightness through job openings, quits, and layoffs. Openings are down from 2022 peaks but still above pre-pandemic norms. Quits have stabilized, while layoffs remain low, indicating resilient labor demand.
labor market, JOLTS, job openings, quits, layoffs, workforce, recession, May 2025, employment trends
Multiple Chart
JP Morgan
Saved
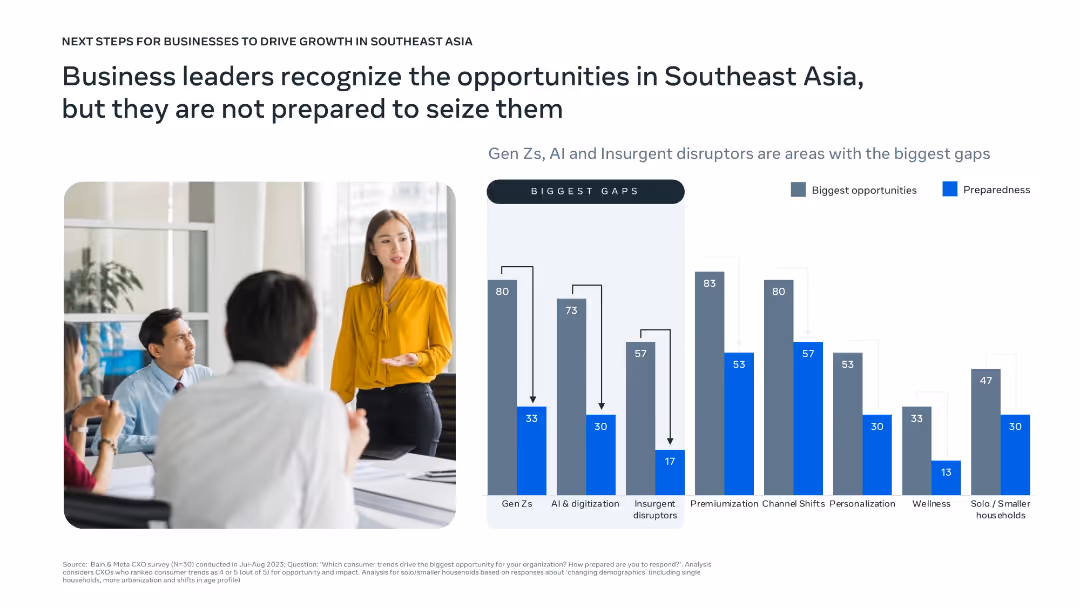
Bar chart compares opportunity vs. preparedness across categories like Gen Z, AI, insurgents, and personalization; photo of business meeting adds contextual visual.
Strategic Planning
Professional Services
Highlights the readiness gap among business leaders in seizing Southeast Asian opportunities. While areas like Gen Z, AI, and personalization are seen as high-potential, preparedness to address them is low. The slide calls attention to misalignment between market opportunity and corporate readiness.
business opportunity, SEA, readiness gap, Gen Z, AI, strategy
Mixed Chart
Bain
Saved
Previous
Next
If nothing, comes up, please save your slides first
Create a FREE account to continue browsing
Receive Instant Access to 1,000+ slides from companies like McKinsey, Google, and Goldman Sachs
First Name
Last Name
Email
Password
I agree to all
Terms & Privacy Policy
Thank you! Your submission has been received!
Oops! Something went wrong while submitting the form.
Have an account?
Sign in
Column Chart
Heatmap
Chevron
Org Chart
Infographic
Callouts
Timeline
List
Graphic
Picture
Process Flow
Diagram
Paragraph
Map
Table
Framework
Subtitle
Takeaway Box
Icon
Other Chart
Radar Chart
Waterfall Chart
Mekko Chart
Pie Chart
Scatter Plot
Line Chart
Bar chart
Bullet points