My Account
My Slides
Search by Category
Templates
View All Templates
Download Template Slides
✦ AI Search
Feedback
Login
Logout
Get Started
Browse all Slides
Browse all Slides
Create a FREE Account
Instant access to 1,000+ real slides from top companies like McKinsey, BCG, Goldman Sachs, Google and many more!
First Name
Last Name
Email
Password
I agree to all
Terms & Privacy Policy
Thank you! Your submission has been received!
Oops! Something went wrong while submitting the form.
Have an account?
Sign in
Saved Slides
Diagram with three main sections: Inspire, Engage, Impact, with supporting icons and text.
Strategic Planning
Environmental Services & Sustainability
Offers a structured guide to inspire and engage executives in SDG strategy implementation, measuring impact via surveys.
SDGs, strategic implementation, executive engagement, guide, impact measurement
Pillar
McKinsey
Saved
Slide with multiple pie charts and bullet points. Clean layout with distinct sections for commercial, consumer loans, investment portfolio, and long-term debt.
Financial Performance
Financial Services
This slide is structured to provide an overview of a company's loan distribution and investment portfolio details as of a specific date. It's used for financial analysis and to communicate financial health and strategy to stakeholders or investors.
Financials, Analysis, Loans, Portfolio, Debt
Multiple Chart
Morgan Stanley
Saved
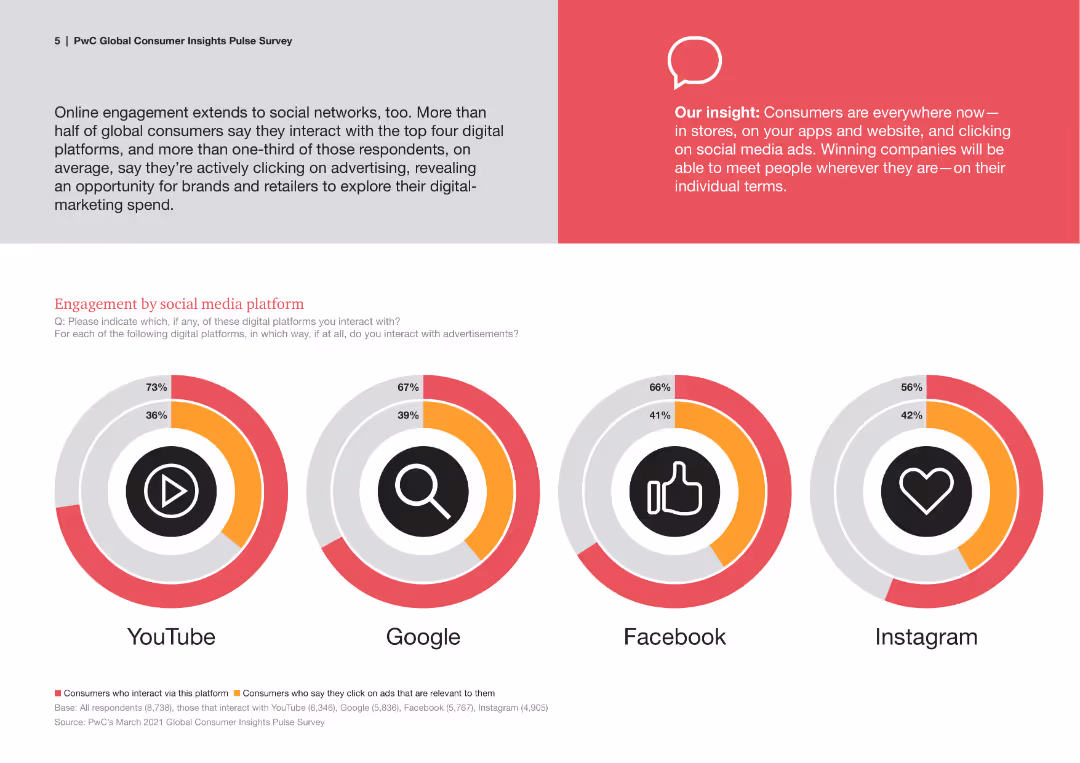
Donut charts displaying consumer engagement and ad interaction across YouTube, Google, Facebook, and Instagram.
Market Analysis and Trends
Media & Entertainment
The slide provides insights into how consumers engage with ads on various social media platforms, revealing interaction trends.
social media, engagement, ad interaction, YouTube, Google, Facebook, Instagram, trends
Multiple Chart
PwC/Strategy&
Saved
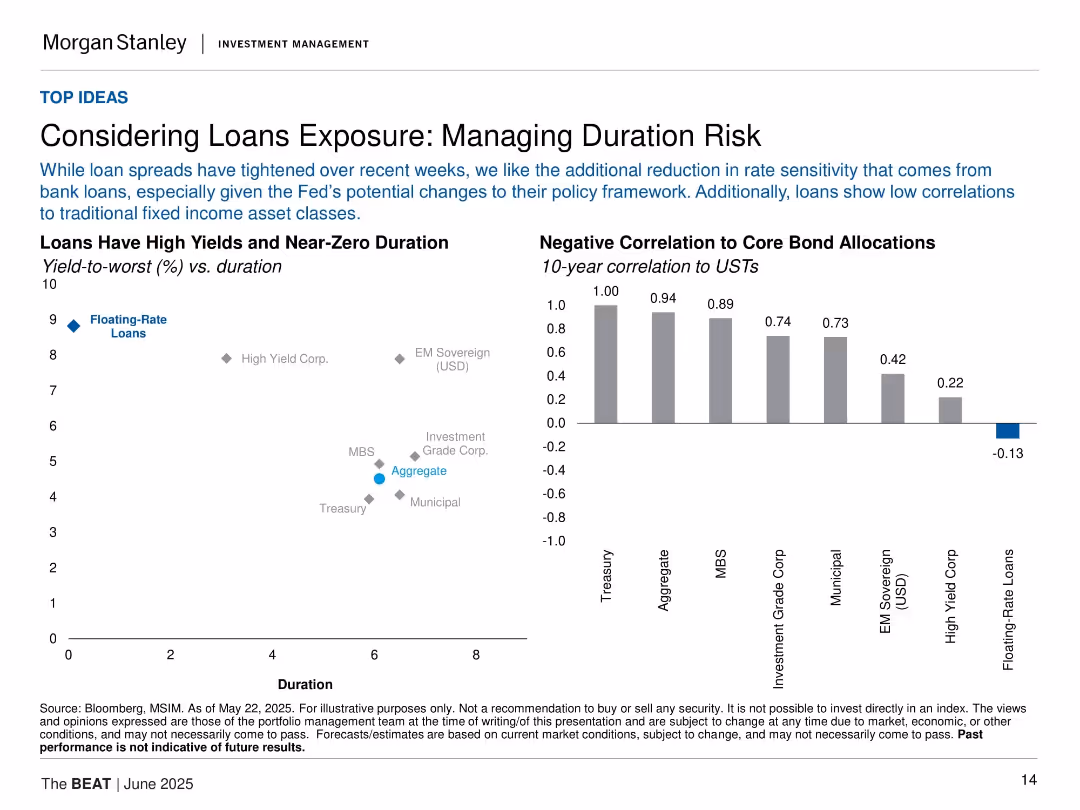
Two visualizations: scatter plot (yield vs. duration) and bar chart (correlation to USTs); grid layout.
Risk Assessment and Management
Financial Services
The slide highlights floating-rate loans as an attractive option for managing duration risk, especially given low correlations with core bond allocations. It shows yield/duration positioning and negative correlations to USTs.
loans, duration risk, floating-rate, correlation, fixed income, USTs, yield, bank loans, interest sensitivity
Multiple Chart
Morgan Stanley
Saved
Contains icons and brief text blocks in a clean layout highlighting key opportunities for SEA in sustainability sectors like energy, nature, and corporate structure.
Market Analysis and Trends
Environmental Services & Sustainability
Discusses SEA's potential for sustainability leadership, focusing on renewable energy, infrastructural improvements, and corporate roles in sustainability, targeting business strategists and environmental advocates.
SEA, sustainability, renewable energy, corporate strategies, icons, opportunities, market analysis, text blocks, clean layout
Pillar
Bain
Saved
The slide displays a complex vertical column chart tracing the company's profitability over the years, with a timeline of milestones beneath the chart.
Financial Performance
Financial Services
Reviews Macquarie's historical profitability and growth, ideal for investor relations or financial history presentations.
Profitability, Shareholder Return, Growth, Financial History, Milestones
Single Chart
Morgan Stanley
Saved
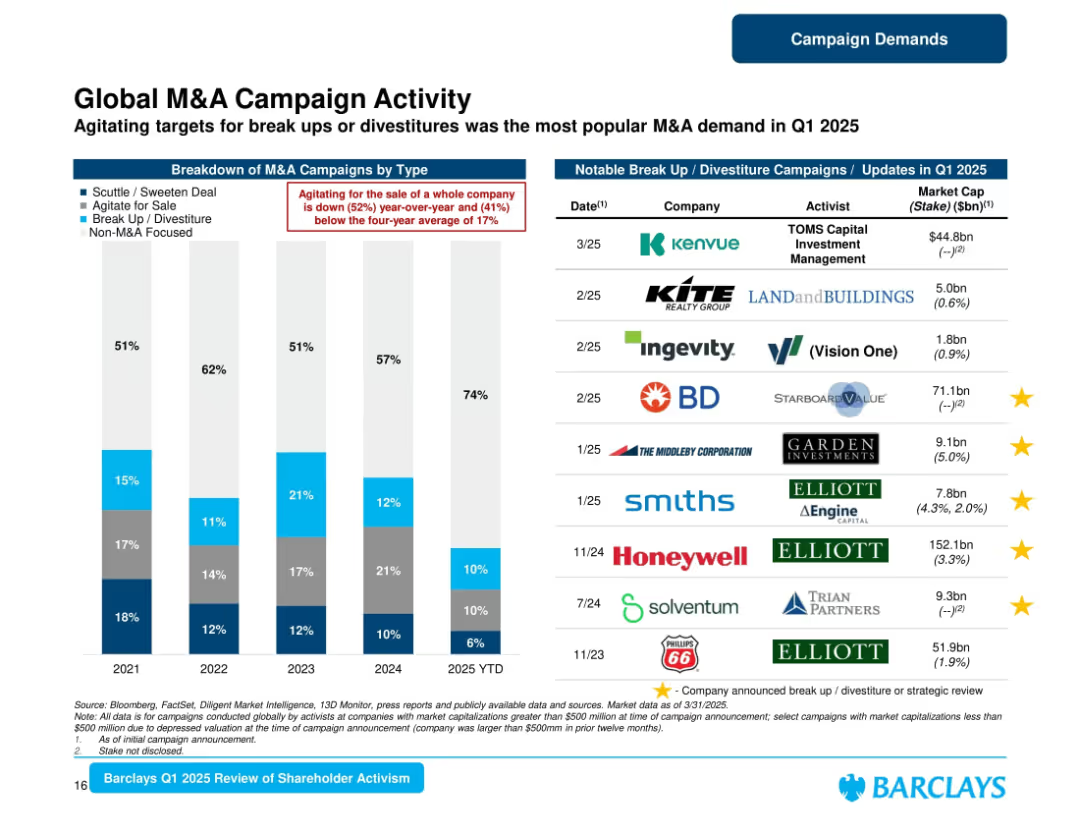
Left section shows stacked bars; right section is a table of notable campaigns with logos and company names.
Mergers and Acquisitions
Financial Services
Reviews M&A-related activist campaigns globally, showing breakdowns by type and a decline in campaigns agitating for full company sales. Includes a list of key break-up/divestiture campaigns with associated firms and market cap data.
M&A, Campaigns, Divestiture, Activists, Global, Shareholder, Barclays, Breakup, 2025
Mixed Chart
Barclays
Saved
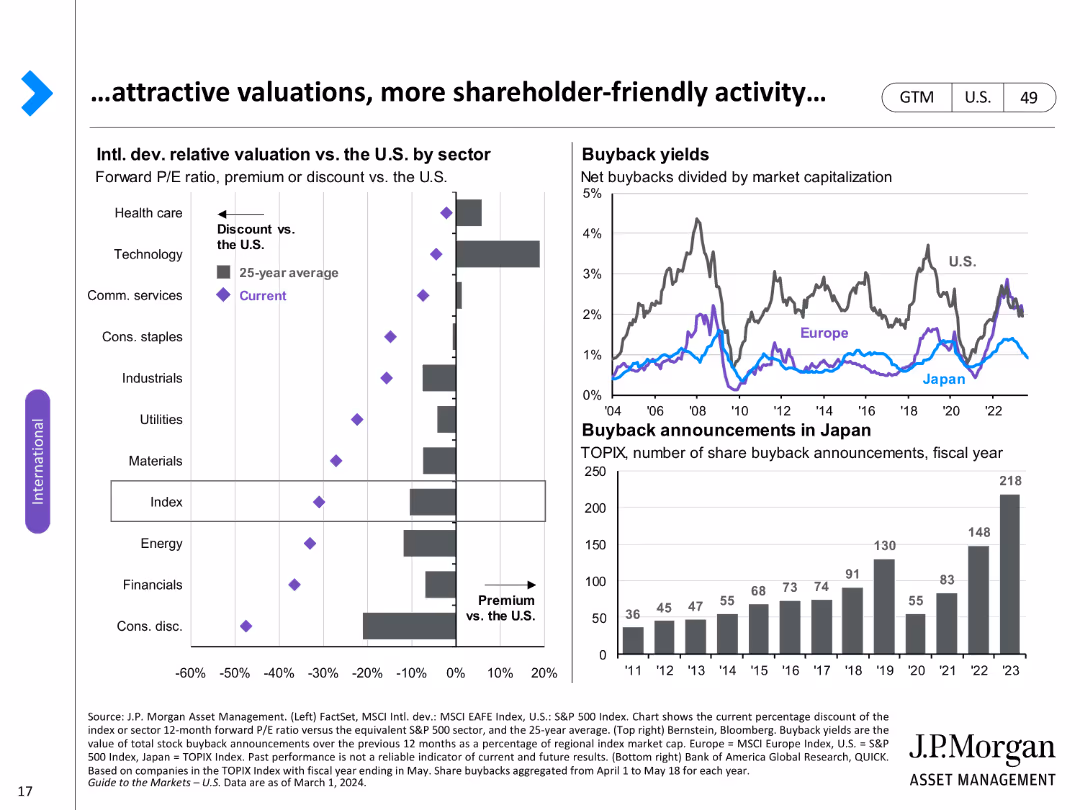
Two charts: a column chart showing relative valuation by sector and a line chart of buyback yields and announcements.
Investment Analysis
Financial Services
Analyzes relative valuations and buyback activity across different sectors, emphasizing shareholder value.
Valuations, buybacks, sectors, shareholder value, analysis, yields, announcements, activity, relative
Multiple Chart
JP Morgan
Saved
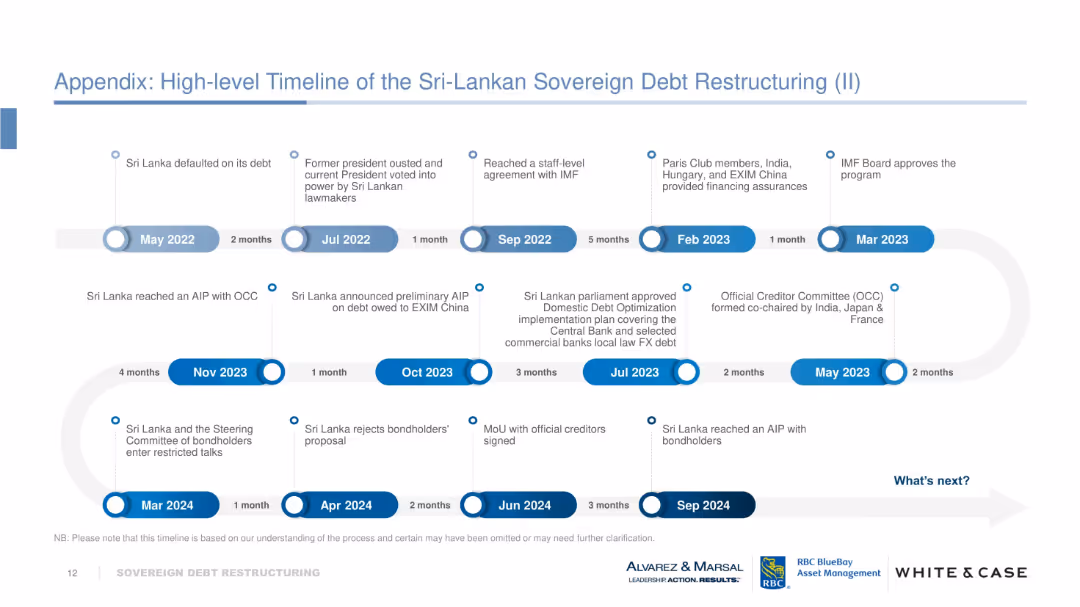
Horizontal timeline using labeled blue and white milestone circles connected by arrows. Covers events from May 2022 to Sep 2024 with major political and financial developments marked clearly. Uses a “What’s next?” callout.
Strategic Planning
Financial Services
This slide visually narrates the progression of Sri Lanka’s debt restructuring efforts, detailing political transitions, agreements with the IMF and OCC, domestic debt optimization, and bondholder negotiations. It emphasizes key events and intervals, forecasting the continuation of restructuring beyond Sep 2024.
Sri Lanka, debt restructuring, IMF, OCC, bondholders, default, timeline, AIP, milestones
Vertical Flow
Alvarez & Marsal
Saved
Includes a column chart showing NNA generation since end-2015 and bullet points detailing collaboration highlights with Private Banking.
Strategic Planning
Financial Services
The slide emphasizes the importance of collaboration with Private Banking, showcasing significant asset generation and outlining strategic priorities for growth.
Collaboration, Private Banking, NNA, Asset Generation, Strategic Priorities
Mixed Chart
Credit Suisse
Saved
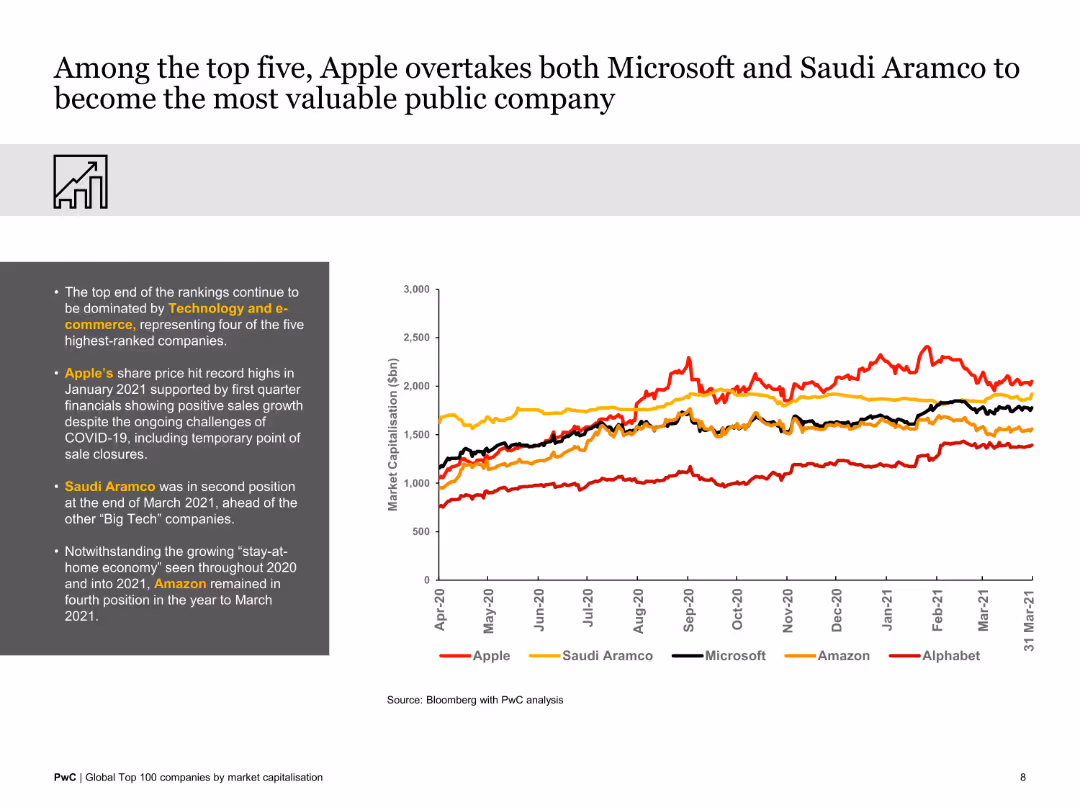
The slide features a line graph comparing the market capitalizations of top tech companies over a year. The visual is clean and focused on trends among the top five companies.
Market Analysis and Trends
Technology & Software
This slide illustrates how Apple surpassed Microsoft and Saudi Aramco to become the most valuable public company, highlighting trends from April 2020 to March 2021.
Apple, Microsoft, Saudi Aramco, market value, tech companies, 2020-2021, comparative analysis
Mixed Chart
PwC/Strategy&
Saved
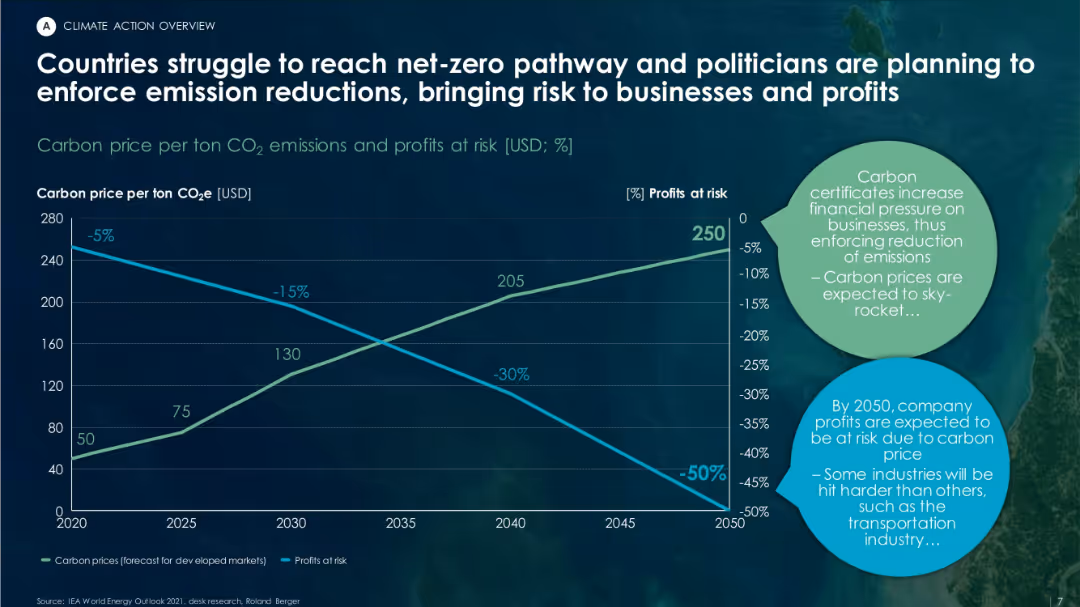
Dual-axis line graph showing increasing carbon prices and declining profit margins over time. Features circular text bubbles summarizing business impacts.
Risk Assessment and Management
Environmental Services & Sustainability
This slide projects the increasing financial burden of carbon pricing and regulatory pressure on companies through 2050. It forecasts higher carbon prices and decreasing profits, particularly for carbon-intensive industries like transportation.
carbon pricing, net-zero, emissions, regulatory risk, business impact, CO₂ cost
Mixed Chart
Roland Berger
Saved
The slide features a flow chart with icons and arrows detailing steps from 'Insight Generation' to 'New Product/Offerings Development' including intermediary processes.
Operational Efficiency
Professional Services
This slide outlines an operational framework for sustaining and scaling value creation in organizations through various phases like insight generation, concept creation, and portfolio management.
operations, innovation, management, strategy, process, portfolio, development, concept, insight, value
Linear Flow
McKinsey
Saved
Contains multiple mini graphs showing growth rates across various industries like agriculture and renewable energies.
Market Analysis and Trends
Technology & Software
Continues from the previous slide, detailing growth rates and revenue impacts of satellite data across more specific industries.
Satellite data, industry growth, agriculture, energy, data utilization
Single Chart
PwC/Strategy&
Saved
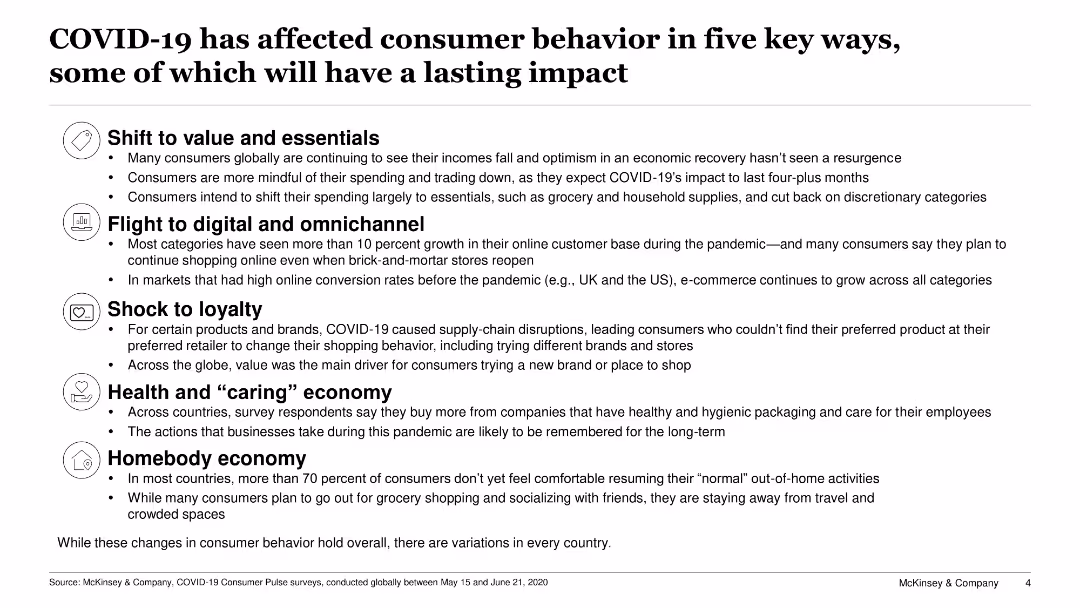
Lists five key impacts of COVID-19 on consumer behavior with bullet points for each, including value shift, digital shift, loyalty shock, health economy, and homebody economy.
Strategic Planning
Consumer Goods
The slide details the long-term impacts of COVID-19 on consumer behavior, emphasizing shifts towards value and essentials, digital adoption, changes in loyalty, and health-focused buying.
COVID-19, consumer behavior, long-term impact, digital shift, health economy
Header Vertical
McKinsey
Saved
The slide features a column chart with different colored sections representing the number of digital transformation projects. Another set of graphical rockets with different colors represents expected impacts of digital investments.
Market Analysis and Trends
Technology & Software
The slide examines how many digital transformation projects organizations have embarked on during the pandemic and the expected impacts of these investments.
digital transformation, investment, local market, projects, pandemic
Multiple Chart
EY
Saved
The slide features a column chart detailing the transport energy consumption forecast by subsectors (cars, trucks, other road vehicles, aviation, shipping, rail) from 2018 to 2040 under a stated policies scenario. It highlights the contributions of biofuels growth in transport industries.
Market Analysis and Trends
Transportation & Logistics
This slide forecasts energy consumption within the transport sector, emphasizing the role of biofuels in the growth of energy use in cars, trucks, aviation, and shipping, and projecting the contributions from different transport subsectors by 2040.
transport energy consumption, forecast, subsectors, cars, trucks, aviation, shipping, rail, biofuels growth
Single Chart
Kearney
Saved
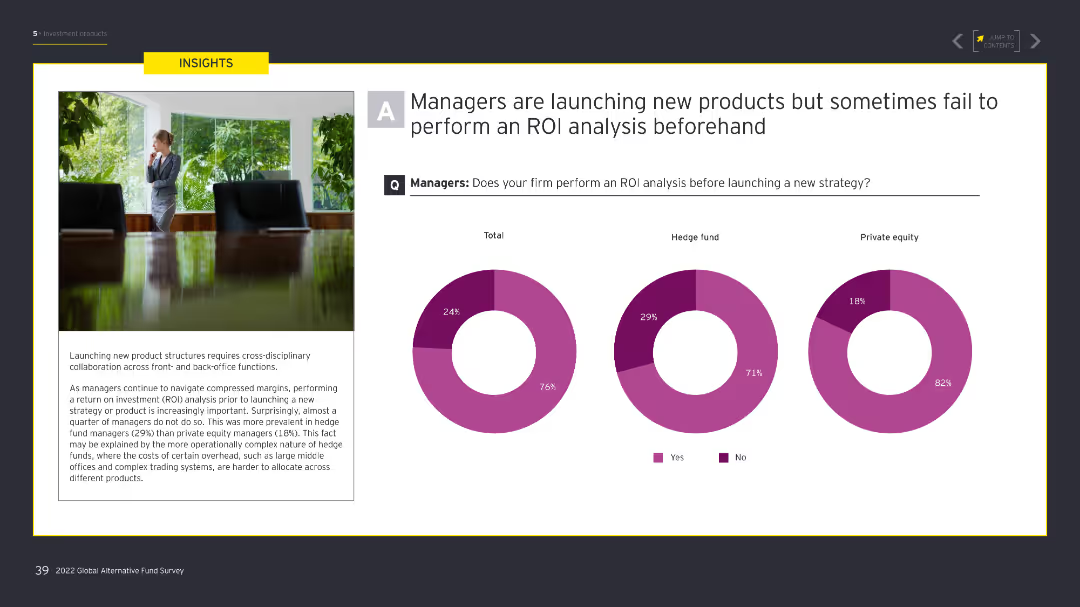
The slide includes two pie charts comparing the percentage of managers who perform ROI analyses before launching new strategies in hedge funds and private equity. An image of a professional in an office is on the left.
Investment Analysis
Financial Services
Discusses the tendency of managers to launch new products without performing an ROI analysis, focusing on hedge funds and private equity.
managers, ROI analysis, new products, launch, hedge funds, private equity, investment, strategies, office, professional
Multiple Chart
EY
Saved
Bar charts showing revenue growth rates for luxury brands during various economic conditions from 1994 to 2017.
Financial Performance
Consumer Goods
Examines revenue growth polarization among luxury brands across different periods, highlighting how external economic conditions like crises impact financial performance.
Revenue, Luxury Brands, Economy
Multiple Chart
Bain
Saved
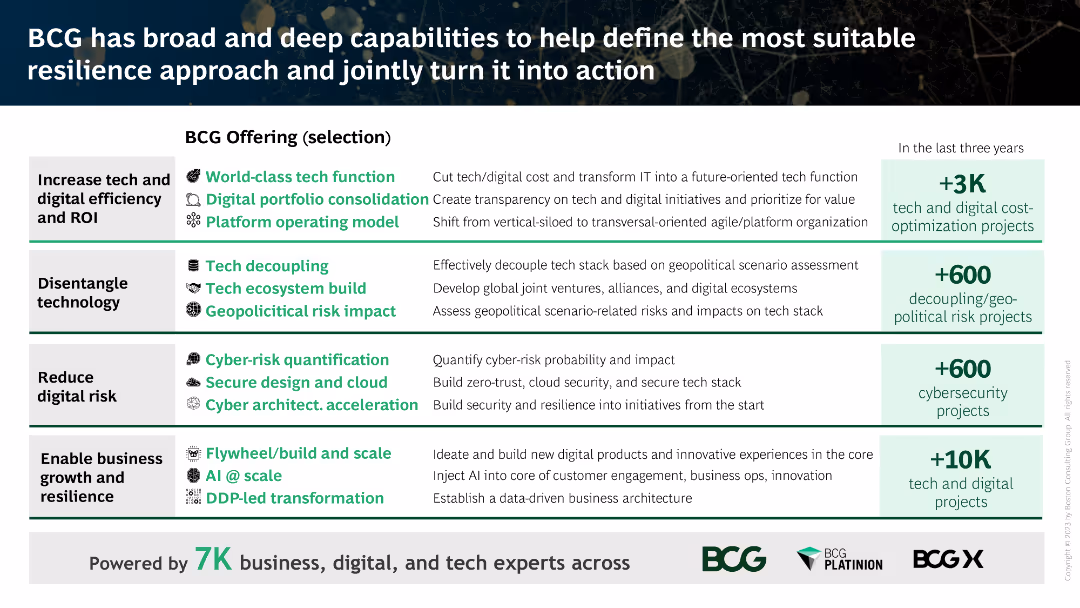
The slide is divided into multiple sections, each highlighting BCG's offerings with icons, descriptive text, and numerical data on completed projects.
Client Case Studies
Professional Services
This slide showcases BCG's capabilities in increasing tech efficiency, disentangling technology, reducing digital risk, and enabling business growth and resilience.
BCG, tech efficiency, digital risk, business growth, resilience
Vertical Flow
BCG
Saved
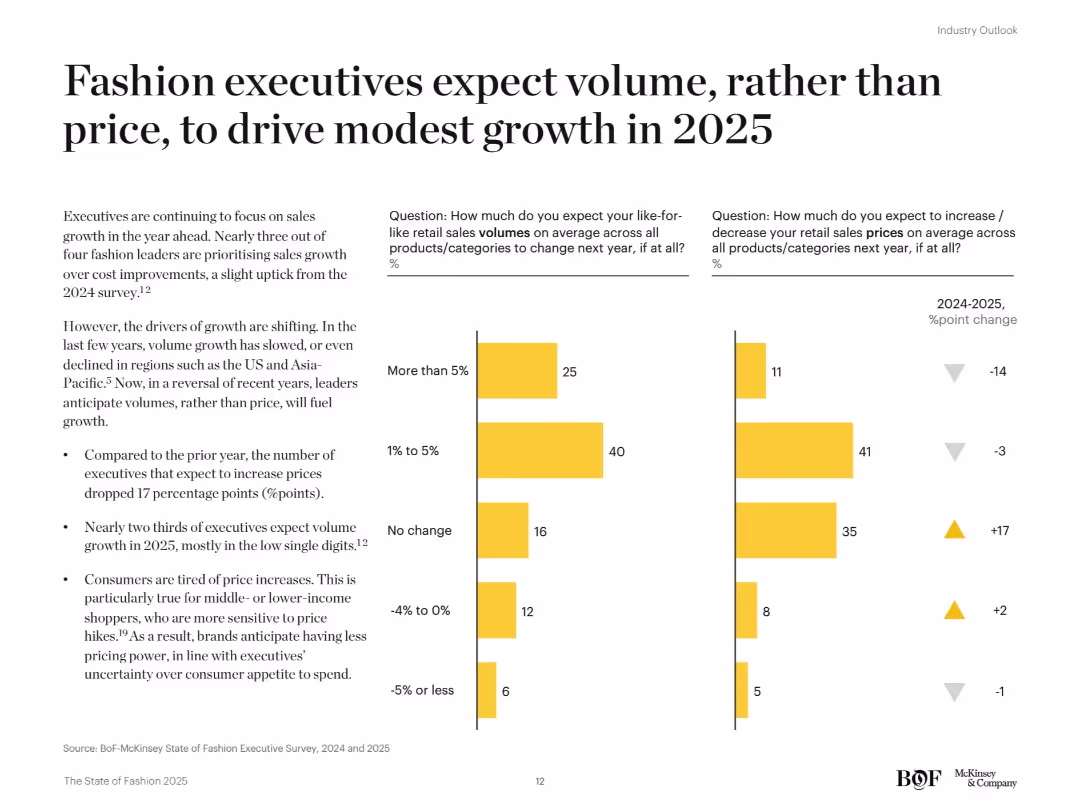
Two-bar chart columns comparing 2024 vs. 2025 executive expectations for volume and price changes. Yellow theme consistent with related slides. Additional commentary on trends provided in side text.
Market Analysis and Trends
Consumer Goods
Executives are shifting their focus from price-driven growth to volume growth for 2025, especially in low single-digit ranges. Fewer expect price increases than in 2024. This reflects consumer resistance to pricing and a focus on affordability and competitive market positioning.
pricing strategy, volume growth, executive expectations, consumer spending, fashion industry, 2025 forecast
Mixed Chart
McKinsey
Saved
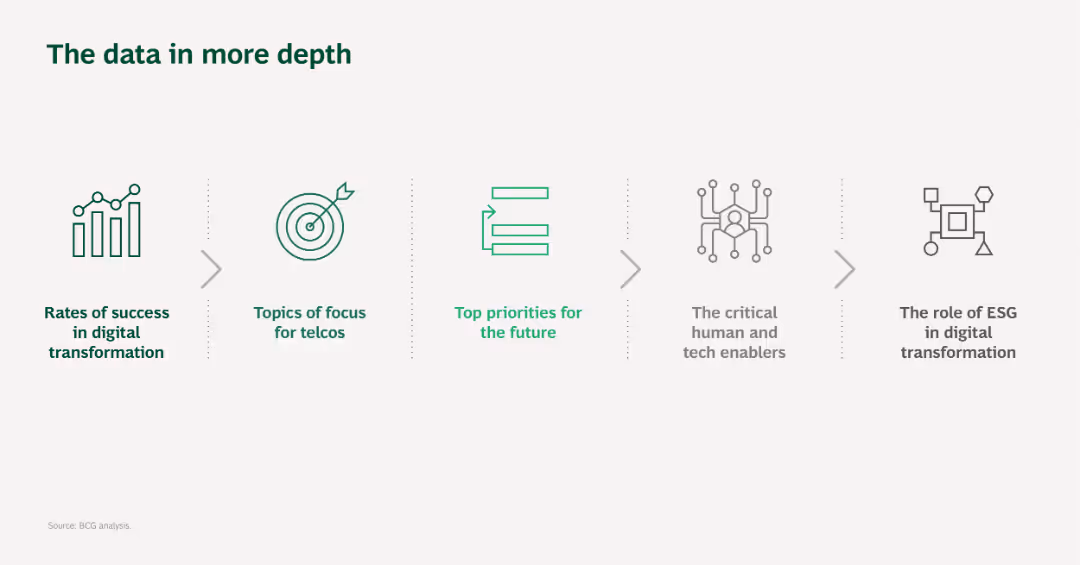
The slide uses a simple layout with five icons and brief text descriptions, visually connected by arrows, representing different focus areas in digital transformation for telcos.
Technology and Digital Transformation
Telecommunications
This slide provides an overview of the data topics covered in more detail later, focusing on digital transformation in the telecommunications sector.
Digital transformation, Telcos, Focus areas, Technology, Data analysis
Pillar
BCG
Saved
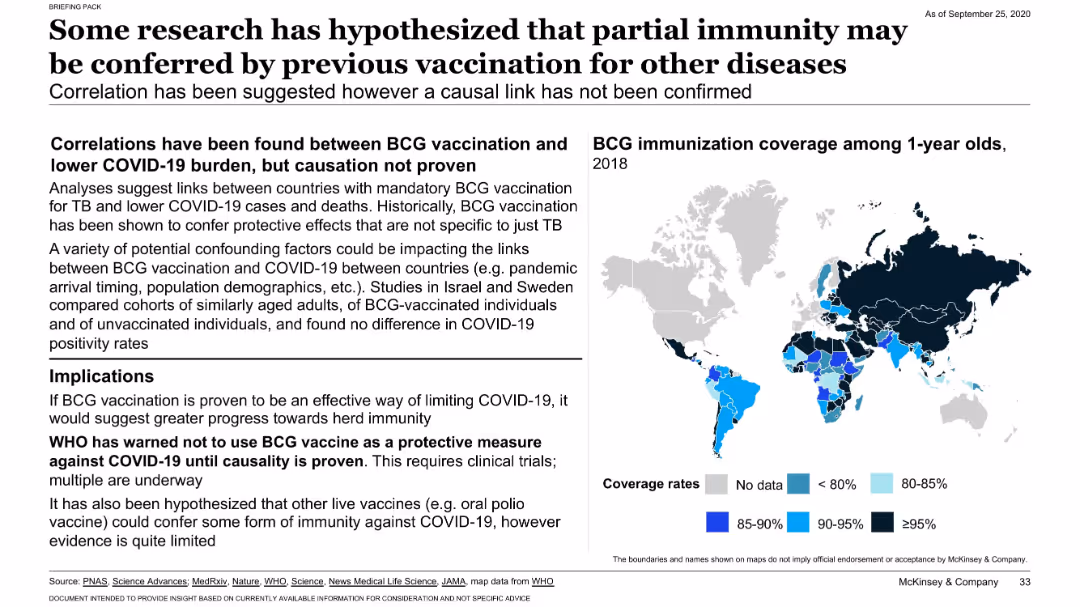
Text-heavy slide with a global map of BCG immunization rates among 1-year-olds; includes summary of research insights and implications.
Market Analysis and Trends
Healthcare & Pharmaceuticals
Suggests possible correlation between BCG vaccination and lower COVID-19 burden. While not proven, the hypothesis supports investigating existing vaccines’ protective effects. Map shows global BCG coverage to contextualize this theory.
BCG vaccine, COVID-19, immunity, correlation, vaccination, epidemiology
Mixed Chart
McKinsey
Saved
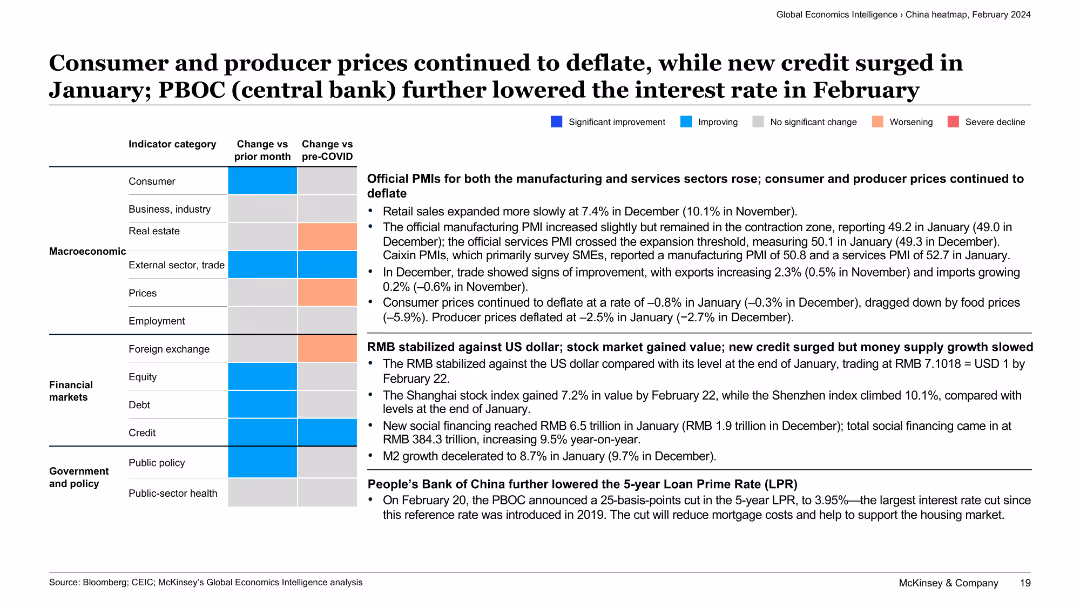
The slide presents a categorized summary of various economic indicators with text descriptions. Color-coded boxes indicate the direction and extent of changes for each category.
Market Analysis and Trends
Financial Services
This slide discusses the continued deflation of consumer and producer prices, the stabilization of RMB against the US dollar, and the People’s Bank of China’s interest rate cut, providing a comprehensive view of economic trends in China.
deflation, consumer prices, producer prices, RMB stabilization, interest rate cut
Table
McKinsey
Saved
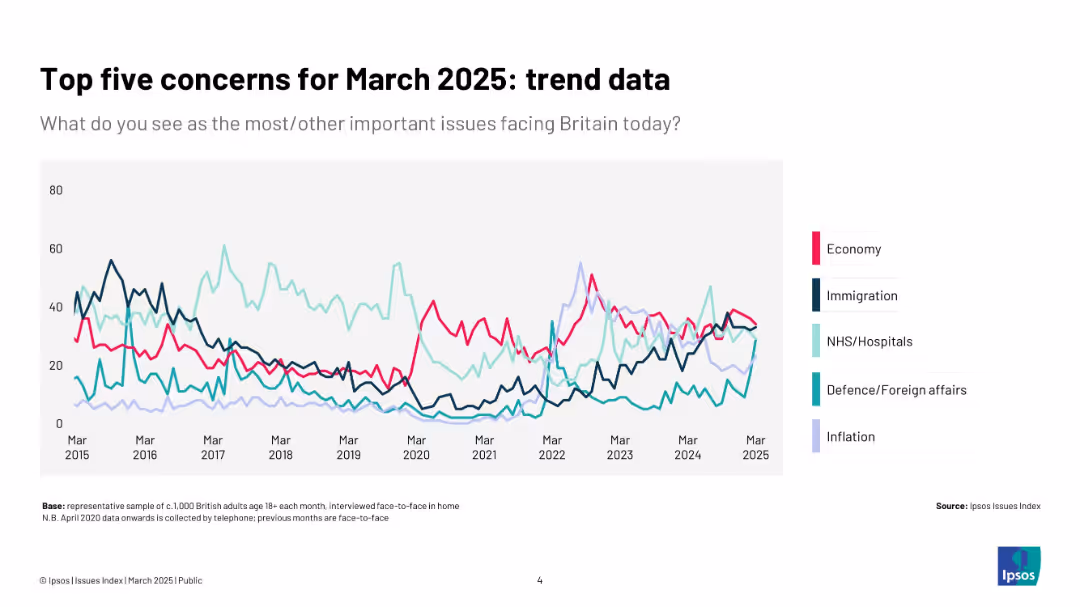
Line chart showing time-series data (2015–2025) for five top issues; each line color-coded by topic.
Market Analysis and Trends
Government & Public Sector
The slide tracks the changing importance of five key issues—economy, immigration, NHS, defence, and inflation—over the past decade. It visually emphasizes shifting public concern over time.
trends, top concerns, line chart, public opinion, decade, issues, Ipsos, UK
Single Chart
IPSOS
Saved
Previous
Next
If nothing, comes up, please save your slides first
Create a FREE account to continue browsing
Receive Instant Access to 1,000+ slides from companies like McKinsey, Google, and Goldman Sachs
First Name
Last Name
Email
Password
I agree to all
Terms & Privacy Policy
Thank you! Your submission has been received!
Oops! Something went wrong while submitting the form.
Have an account?
Sign in
Column Chart
Heatmap
Chevron
Org Chart
Infographic
Callouts
Timeline
List
Graphic
Picture
Process Flow
Diagram
Paragraph
Map
Table
Framework
Subtitle
Takeaway Box
Icon
Other Chart
Radar Chart
Waterfall Chart
Mekko Chart
Pie Chart
Scatter Plot
Line Chart
Bar chart
Bullet points