My Account
My Slides
Search by Category
Templates
View All Templates
Download Template Slides
Leave Feedback
Login
Logout
Get Started
Browse all Slides
Browse all Slides
Create a FREE Account
Instant access to 1,000+ real slides from top companies like McKinsey, BCG, Goldman Sachs, Google and many more!
First Name
Last Name
Email
Password
I agree to all
Terms & Privacy Policy
Thank you! Your submission has been received!
Oops! Something went wrong while submitting the form.
Have an account?
Sign in
Saved Slides
The slide presents a 6-step process infographic with SDG icons, detailed steps descriptions, and a side column of CSR results over the years in a table format. There are images of emulsifiers and a dessert on the right, symbolizing product output.
Client Case Studies
Environmental Services & Sustainability
This slide outlines Palsgaard's approach to Sustainable Development Goals (SDGs), focusing on energy, water, and CO2 emissions management, highlighted through a process chart and yearly CSR results demonstrating progress and targets for sustainable practices.
sustainability, CSR, CO2 emissions, energy, water
Vertical Flow
McKinsey
Saved
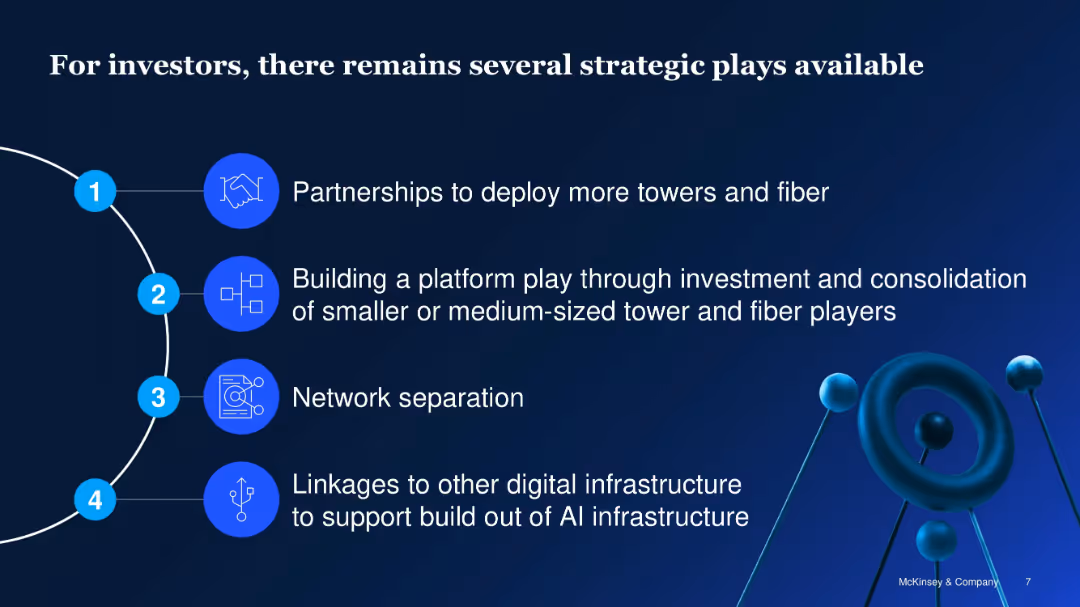
Vertical list with icons and numbered segments; clean blue design
Investment Analysis
Telecommunications
Identifies four strategic opportunities for telecom infrastructure investors: partnerships, platform plays, network separation, and integration with AI infrastructure to enhance scalability and ROI.
telecom investment, infrastructure, strategic plays, fiber, AI, partnerships, platform consolidation
Vertical Flow
McKinsey
Saved
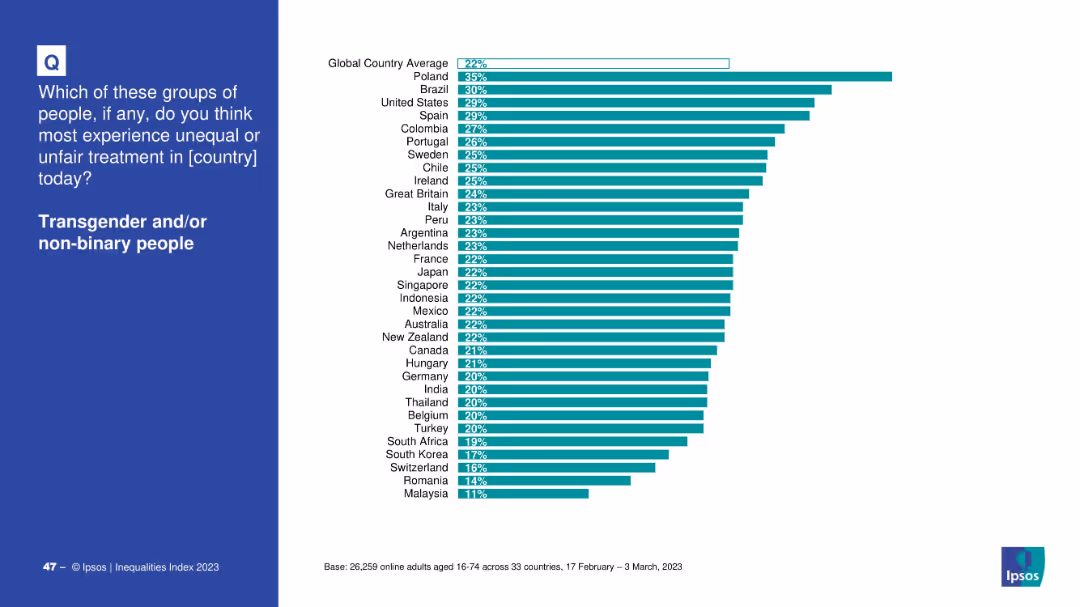
Bar chart showing global country comparison, teal bars on white background, blue text panel on left
Market Analysis and Trends
Government & Public Sector
This slide presents the perceived unfair treatment of transgender and/or non-binary individuals across 33 countries. Poland, Brazil, and the US top the chart. A global average of 22% indicates notable concern for this group.
transgender, non-binary, inequality, global perception, survey, discrimination, Ipsos, bar chart, 2023
Mixed Chart
IPSOS
Saved
The slide features multiple bar charts comparing revenue impacts over two periods. Charts are color-coded and accompanied by insights and economic sector data.
Market Analysis and Trends
Professional Services
The slide analyzes revenue generated by business apps, highlighting variations across different sectors and revenue ranges, useful for assessing market impact and strategic planning.
revenue, apps, business impact, B2B, B2C, market analysis
Mixed Chart
Deloitte
Saved
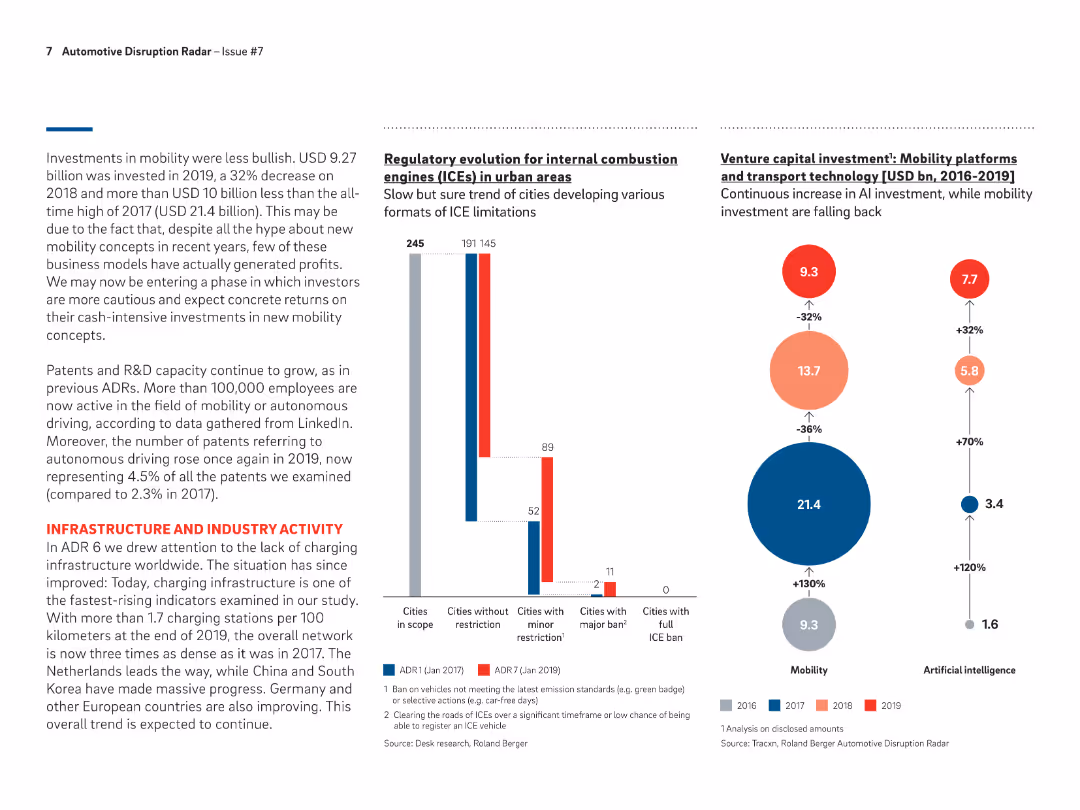
Bar chart showing the number of cities with various levels of ICE restrictions from ADR1 to ADR7, highlighting the increase in cities with minor and major restrictions.
Regulatory and Compliance
Transportation & Logistics
Discusses the regulatory changes impacting ICEs in urban areas, with a growing number of cities implementing restrictions to promote the adoption of cleaner vehicle technologies.
ICE restrictions, urban areas, regulatory changes, ADR
Multiple Chart
Roland Berger
Saved
The slide is text-heavy with a large title and several subsections, including key initiatives and actions, alongside country examples. It outlines the role of universities in generating ICT talent and ensuring they possess the necessary skills. There's central text with green color highlights featuring key points. The layout is informative and arranged in lists and text blocks with distinct headers.
Strategic Planning
Education & Training
The slide outlines key initiatives and actions for universities to address the ICT talent gap. It suggests increasing investment in education, enhancing accessibility to ICT majors, and ensuring diversity. The slide also provides international examples of how these initiatives are implemented, framing the role of universities as crucial in producing job market-ready graduates.
Universities, ICT Talent, Strategic Planning, Key Initiatives, Investment, Accessibility, Diversity, Education Policy, Skill Development, Global Examples
Header Vertical
Kearney
Saved
Column chart shows liquidity coverage ratio changes from 3Q22 to 4Q22. Bullets highlight key actions taken to rebuild liquidity.
Risk Assessment and Management
Financial Services
Describes actions taken to improve the liquidity coverage ratio to 144%, supported by capital raises and deleveraging, improving financial stability.
liquidity coverage, financial stability, capital raises, deleveraging, risk management
Mixed Chart
Credit Suisse
Saved
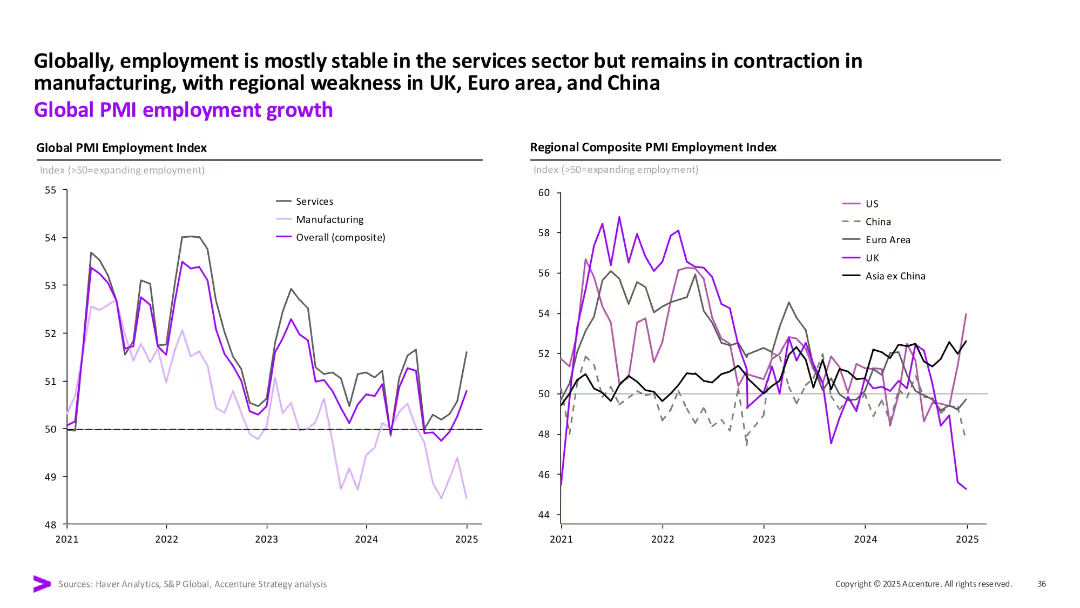
Two line charts showing global and regional PMI employment trends from 2021 to 2025, broken out by services, manufacturing, and composite.
Operational Efficiency
Professional Services
Global PMI data reveals stable employment in services but contraction in manufacturing. Regionally, UK, Euro Area, and China show persistent employment weakness, affecting overall PMI indexes.
PMI, Employment Index, Services vs Manufacturing, Global Labor Trends, Regional PMI
Multiple Chart
Accenture
Saved
The slide features a detailed case study on HEFA (Hydroprocessed Esters and Fatty Acids) as a viable solution for bio jet fuels in the US, covering the process description, key metrics, feedstock characteristics, and environmental performance.
Client Case Studies
Transportation & Logistics
This slide examines HEFA as a technically viable solution for producing bio jet fuels in the US, detailing the conversion process, key metrics, feedstock characteristics, and environmental impacts associated with HEFA production.
HEFA, bio jet fuel, US, case study, process description, key metrics, feedstock characteristics, environmental performance
Mixed Chart
Kearney
Saved
Features column charts comparing graduates in technology-related fields versus business administration across Brazil, the US, Germany, Estonia, and India. Each country's flag is displayed above the respective columns.
Human Resources and Talent Management
Education & Training
Focuses on the proportion of tech to non-tech graduates in various countries, highlighting Brazil's large disparity. Useful for discussions on educational reforms or workforce development strategies.
education, Brazil, tech talent, graduates, comparison
Single Chart
McKinsey
Saved
This slide features a combination of a line chart showing a 12-month share price trend and a data table with corporate information. The layout is clear with a concise display of financial data.
Financial Performance
Financial Services
The slide provides a snapshot of the company's financial status as of December 2018, including stock price, market capitalization, and share distribution. It serves as a financial overview for stakeholders.
financials, mining, share price, market capitalization, shareholders, company snapshot
Mixed Chart
Morgan Stanley
Saved
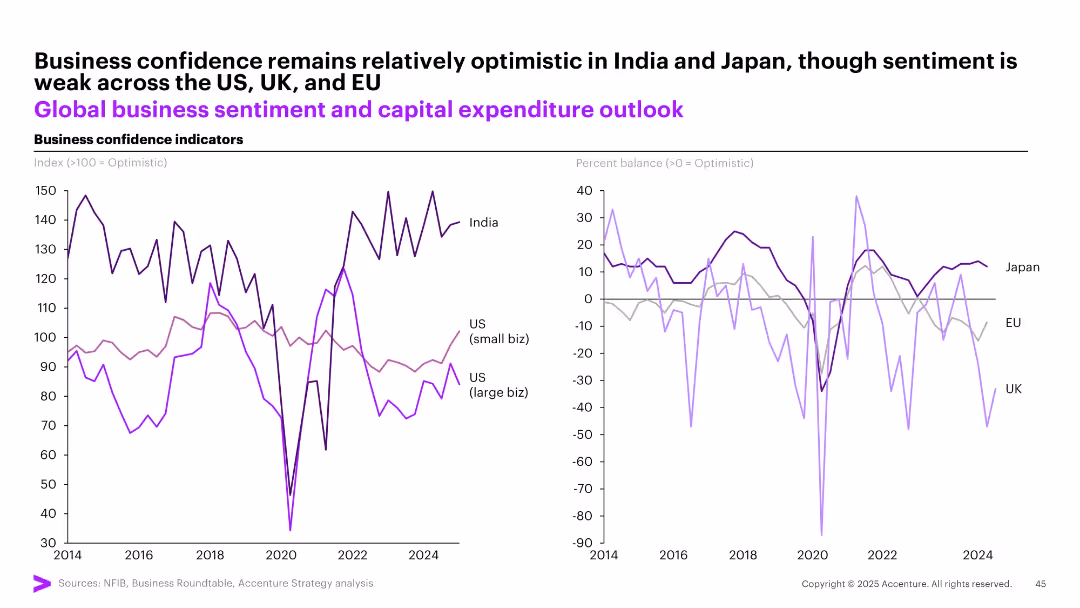
Dual-panel line chart showing business confidence (India, US small/large biz, EU, UK, Japan); left = index >100, right = percent balance
Strategic Planning
Professional Services
This slide illustrates global business sentiment trends, showing that India and Japan maintain optimistic outlooks, while the US, UK, and EU face weaker sentiment. It highlights disparity between small and large businesses in the US, with both showing different levels of capital expenditure optimism.
business sentiment, capital outlook, India, US, Japan, confidence, global economy
Multiple Chart
Accenture
Saved
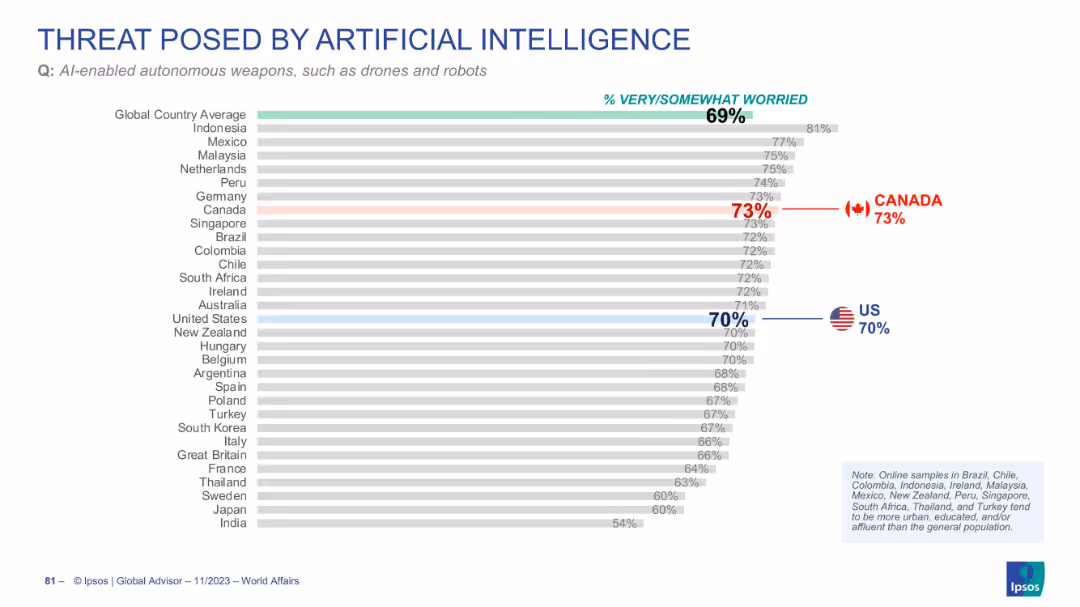
Horizontal bar chart ranking countries by concern over AI-enabled autonomous weapons
Risk Assessment and Management
Artificial Intelligence
This slide shows the percentage of people who are concerned about AI-powered weapons. Canada (73%) and the US (70%) are slightly above the global average (69%) in their concern.
AI weapons, drones, public concern, global comparison, military AI, Ipsos
Single Chart
IPSOS
Saved
Contains matrix-style charts showing the usage of Purchasing Chessboard® levers among leaders and typical companies.
Market Analysis and Trends
Professional Services
Compares the systematic use of Purchasing Chessboard® levers between leading companies and typical firms, highlighting differences.
Purchasing Chessboard, levers, market analysis, trends, procurement, leaders, companies, comparison, matrix charts
Multiple Chart
Kearney
Saved
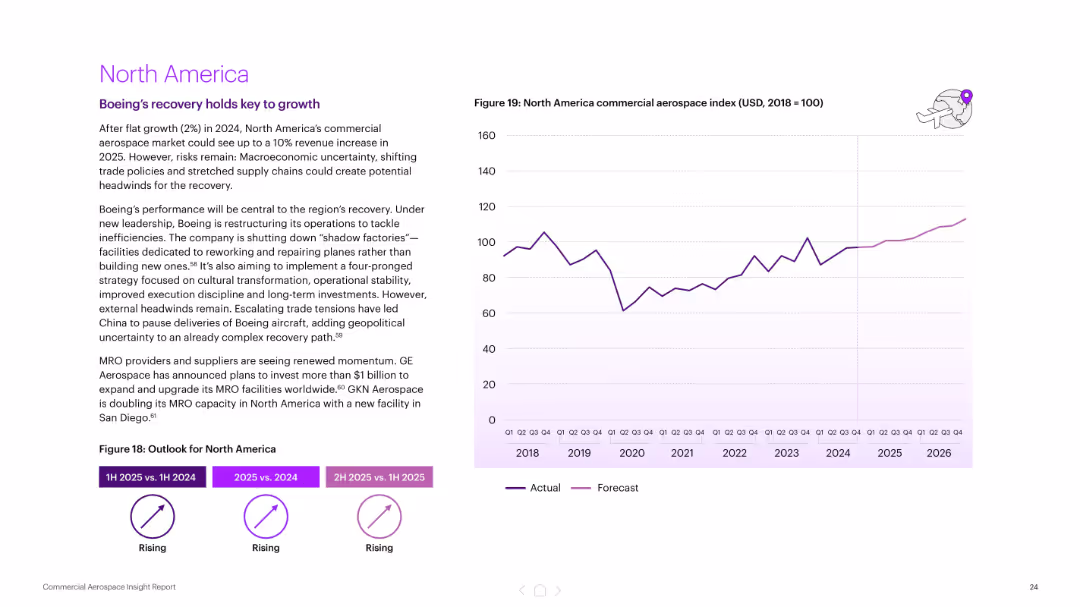
Left text with outlook and summary; right features a line chart (actual and forecast) of commercial aerospace index (2018–2026). Purple highlights.
Market Analysis and Trends
Industrial & Manufacturing
Describes North America’s modest recovery in aerospace, driven by Boeing's restructuring and renewed MRO investment. Notes risks from macroeconomics and trade. Forecasted 10% revenue growth for 2025.
North America, aerospace index, Boeing, recovery, forecast, MRO investment, commercial aviation, trade risks
Mixed Chart
Accenture
Saved
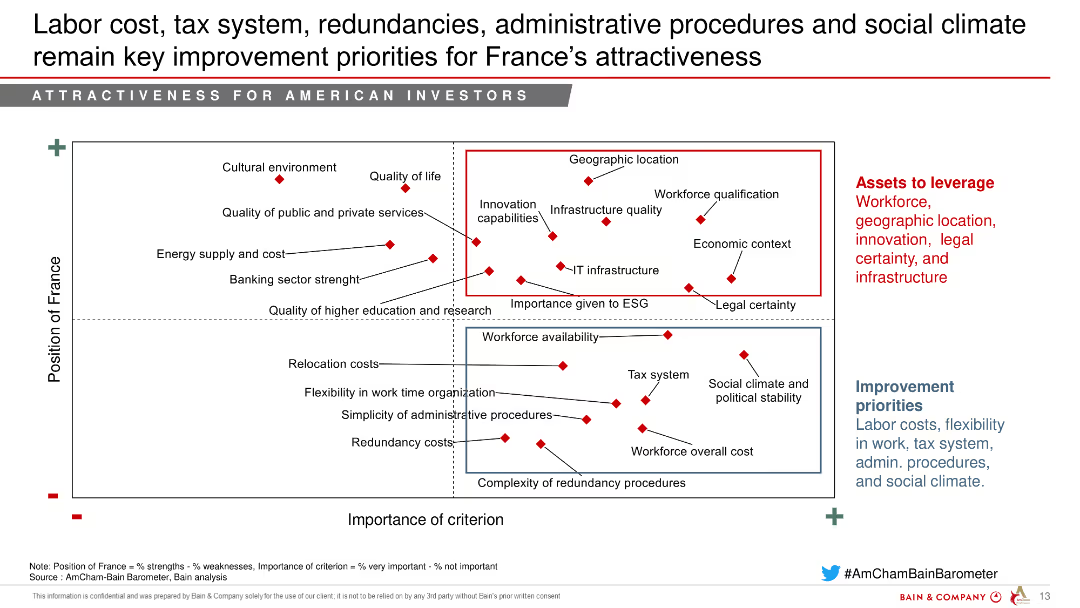
The slide features a chart mapping France's position on various criteria such as labor cost and tax system, with areas for improvement highlighted.
Regulatory and Compliance
Government & Public Sector
This slide outlines the key areas for improvement in France to enhance its attractiveness, focusing on labor cost and administrative procedures.
Improvement priorities, Labor cost, Tax system, Administrative procedures, Government
Mixed Chart
Bain
Saved
Features two line graphs showing year-over-year industrial production growth in the U.S. and EU. The slide uses red and blue lines against a light green background for clarity.
Operational Efficiency
Industrial & Manufacturing
Discusses recent trends in manufacturing and industrial production in the U.S. and EU, highlighting changes in growth rates. This slide is beneficial for understanding sectoral health and economic conditions.
Manufacturing, Industrial Production, US, EU, Growth Rates
Single Chart
Deutsche Bank
Saved
The slide displays pie charts reflecting the funding mix in 2015, 2019, and the medium-term. A breakdown sidebar shows the strategic deposit growth areas: consumer, private bank, institutional, and central channels.
Investment Analysis
Financial Services
Examines the evolution of Goldman Sachs' funding mix, detailing the strategic increase in deposits and the consequent improvement in funding costs through clear visual representations. The focus is on diversification and the role of strategic business channels in this growth.
funding mix, strategic growth, deposits, finance, diversification
Multiple Chart
Goldman Sachs
Saved
Bar chart of liquidity coverage ratio trends and a donut chart of liquidity pool composition, emphasizing high-quality liquid assets and securities.
Financial Performance
Financial Services
Presentation of liquidity coverage ratio and the composition of UBS's liquidity pool, highlighting high-quality liquid assets.
Liquidity, coverage, assets, securities, cash
Multiple Chart
UBS
Saved
Slide shows a detailed framework of banking segments like Deposits, Lending, and Investment Management, correlating with AI's estimated impact on these areas.
Financial Performance
Financial Services
Provides a comprehensive view of how generative AI is expected to influence various banking operations from front to back office, serving as a guide for strategic implementation in financial services.
banking, AI use cases, strategic implementation, front office, back office
Diagram
Accenture
Saved
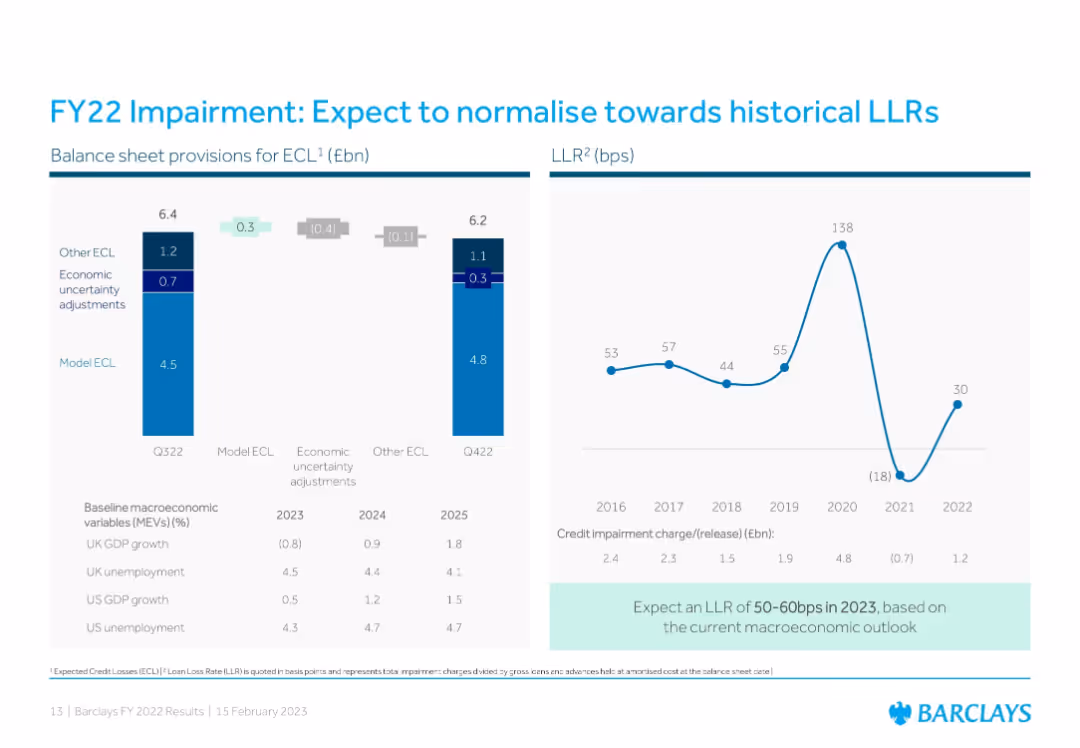
Dual-panel layout: Left uses stacked bar charts for provisions and adjustments; right displays a line graph of historical loan loss rates (LLR) from 2016 to 2022 with expected 2023 range highlighted.
Risk Assessment and Management
Financial Services
Describes expected credit loss (ECL) provisions and historical LLR trends, indicating a normalization toward historical rates. The slide provides macroeconomic assumptions and Barclays’ projections for 2023 based on a cautious economic outlook.
impairment, credit losses, LLR, macroeconomic outlook, FY22, FY23 forecast, provisions, economic assumptions
Multiple Chart
Barclays
Saved
Line graph showing the yearly variance of NCDOT's cash balance from forecasts, marking a shift in FY19 with a detailed analysis of trends over time.
Regulatory and Compliance
Government & Public Sector
Analyzes the shift in cash balance variance for NCDOT in FY19, highlighting issues in fiscal management. Useful for government finance and policy analysis.
fiscal management, variance, government, NCDOT, trends
Single Chart
McKinsey
Saved
Flowchart showing the evolution of analytics maturity from data modeling to machine learning, natural language processing, and AI. Includes annotations on data input and human intervention.
Technology and Digital Transformation
Technology & Software
Explains the stages of analytics maturity, from structured data modeling to advanced AI, and their impact on companies' operations and value creation.
analytics maturity, AI, data modeling, machine learning, NLP
Linear Flow
Kearney
Saved
Diagram and text outlining IT functional vacancy rates over time. Specific IT vacancies are highlighted in an organizational chart.
Human Resources and Talent Management
Technology & Software
Analysis of IT functional vacancy rates within NH DHHS, showing increased vacancies impacting strategic decision-making and planning, especially during COVID-19.
IT Vacancies, DHHS, Staffing, Organizational Chart, COVID-19
Header Horizontal
Alvarez & Marsal
Saved
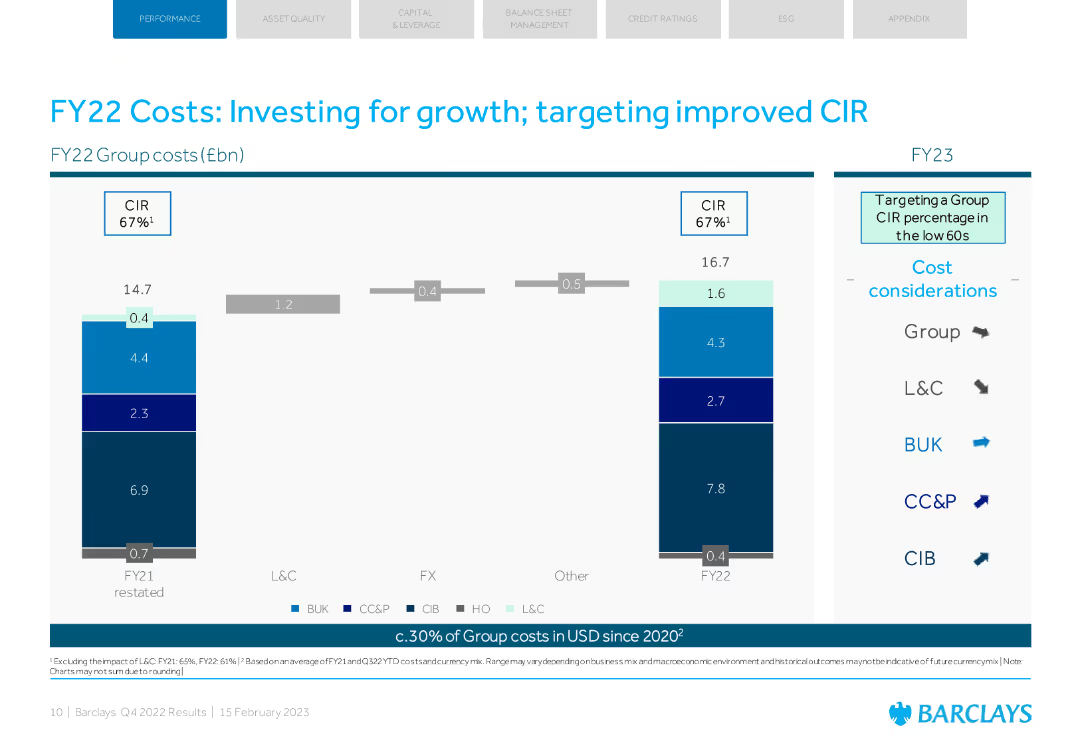
The slide features a bar chart comparing group costs and a detailed cost breakdown by categories. The layout is organized with blue tones.
Operational Efficiency
Financial Services
The slide details Barclays' FY22 group costs, focusing on investments for growth and targeting a lower cost-to-income ratio (CIR).
costs, investment, growth, CIR, Barclays
Single Chart
Barclays
Saved
Previous
Next
If nothing, comes up, please save your slides first
Create a FREE account to continue browsing
Receive Instant Access to 1,000+ slides from companies like McKinsey, Google, and Goldman Sachs
First Name
Last Name
Email
Password
I agree to all
Terms & Privacy Policy
Thank you! Your submission has been received!
Oops! Something went wrong while submitting the form.
Have an account?
Sign in
Column Chart
Heatmap
Chevron
Org Chart
Infographic
Callouts
Timeline
List
Graphic
Picture
Process Flow
Diagram
Paragraph
Map
Table
Framework
Subtitle
Takeaway Box
Icon
Other Chart
Radar Chart
Waterfall Chart
Mekko Chart
Pie Chart
Scatter Plot
Line Chart
Bar chart
Bullet points