My Account
My Slides
Search by Category
Templates
View All Templates
Download Template Slides
Leave Feedback
Login
Logout
Get Started
Browse all Slides
Browse all Slides
Create a FREE Account
Instant access to 1,000+ real slides from top companies like McKinsey, BCG, Goldman Sachs, Google and many more!
First Name
Last Name
Email
Password
I agree to all
Terms & Privacy Policy
Thank you! Your submission has been received!
Oops! Something went wrong while submitting the form.
Have an account?
Sign in
Saved Slides
The slide contains a mix of text and column charts. The left side has a textual overview while the right side includes two column charts with horizontal bars.
Risk Assessment and Management
Financial Services
The slide discusses the top emerging risks identified by CROs, including climate change and AI, and how these risks are viewed by risk organizations and boards.
Emerging risks, CRO, climate change, AI, risk management
Multiple Chart
EY
Saved
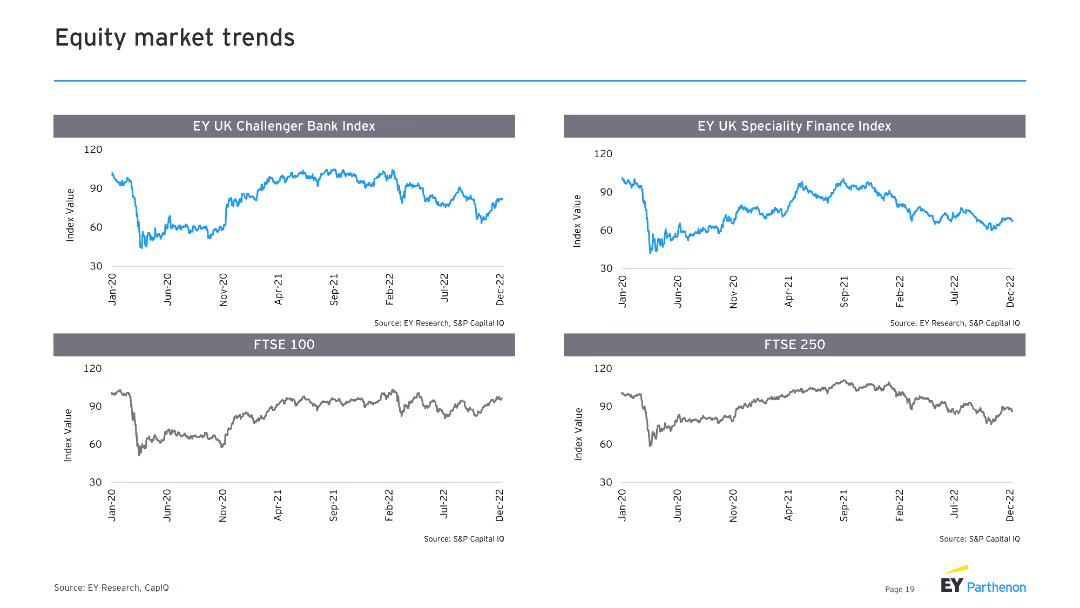
The slide includes four line charts, showing trends in the EY UK Challenger Bank Index, EY UK Specialty Finance Index, FTSE 100, and FTSE 250 over recent years.
Market Analysis and Trends
Financial Services
It provides insights into equity market trends, focusing on specific financial indices, which is useful for investment analysis and market forecasting.
equity market, trends, indices, FTSE, finance
Multiple Chart
EY
Saved
This slide features a series of line charts and a column chart showing the changes in U.S. GDP, inflation, unemployment rate, and 10-year U.S. Treasury rate from Jan 2023 to Dec 2023.
Market Analysis and Trends
Financial Services
The slide illustrates the economic performance of the U.S. over 2023, highlighting the outperforming GDP, halved inflation, lower unemployment rates, and higher U.S. 10-year Treasury rates. The visual data supports the narrative that the U.S. economic performance has been better than forecasted at the beginning of the year. The slide can be used for analyzing economic trends and performance over the year 2023.
GDP, inflation, unemployment, Treasury rates, forecast
Multiple Chart
JP Morgan
Saved
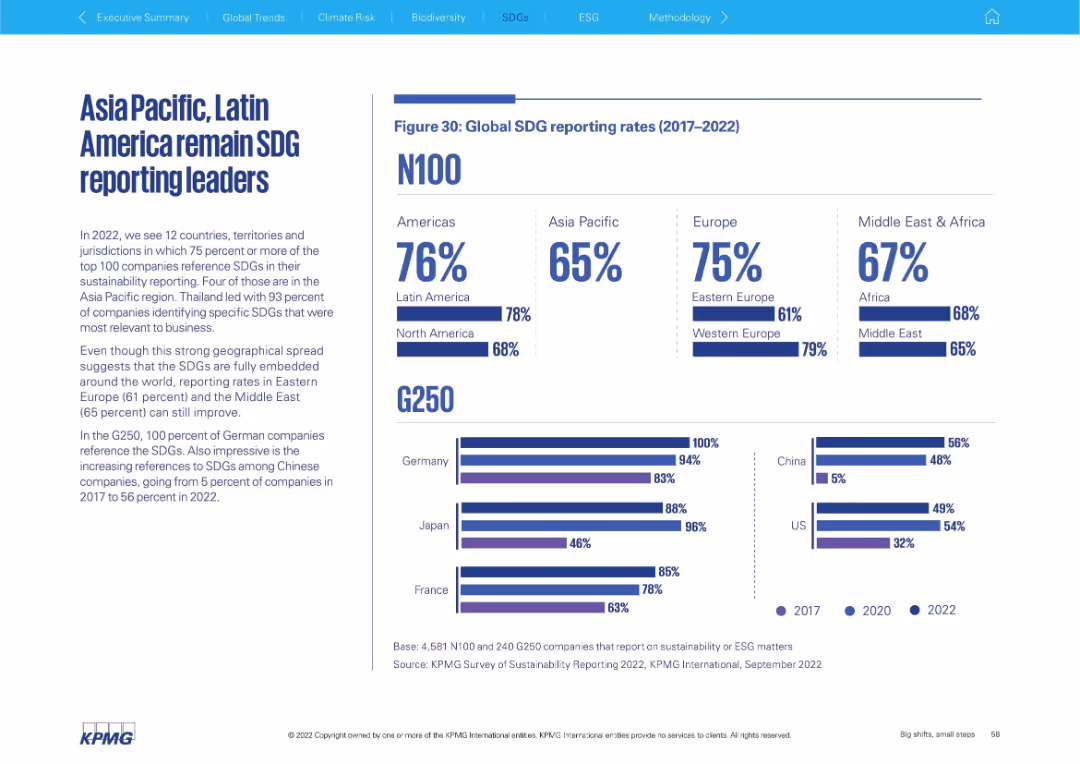
Two-column layout with text on the left and a data-rich infographic on the right, including bar graphs and percentage stats comparing global SDG reporting by region and country.
Strategic Planning
Professional Services
This slide presents SDG reporting rates globally (2017–2022), highlighting regional leaders and laggards. It compares N100 and G250 companies by region and includes national-level insights, notably Germany’s 100% G250 reporting rate and China’s rapid growth.
SDG, sustainability, G250, N100, regional comparison, ESG, Latin America, Asia Pacific, Europe, corporate reporting
Multiple Chart
KPMG
Saved
Contains a two-column layout with a column chart for dividends per year on the left and a block of text with figures on share buybacks on the right.
Financial Performance
Financial Services
Displays dividend payments from 2020 to 2023 and details on share buyback in 2023, emphasizing shareholder value creation through dividends and share buybacks.
dividends, shareholder value, buyback, financials, growth
Mixed Chart
IPSOS
Saved
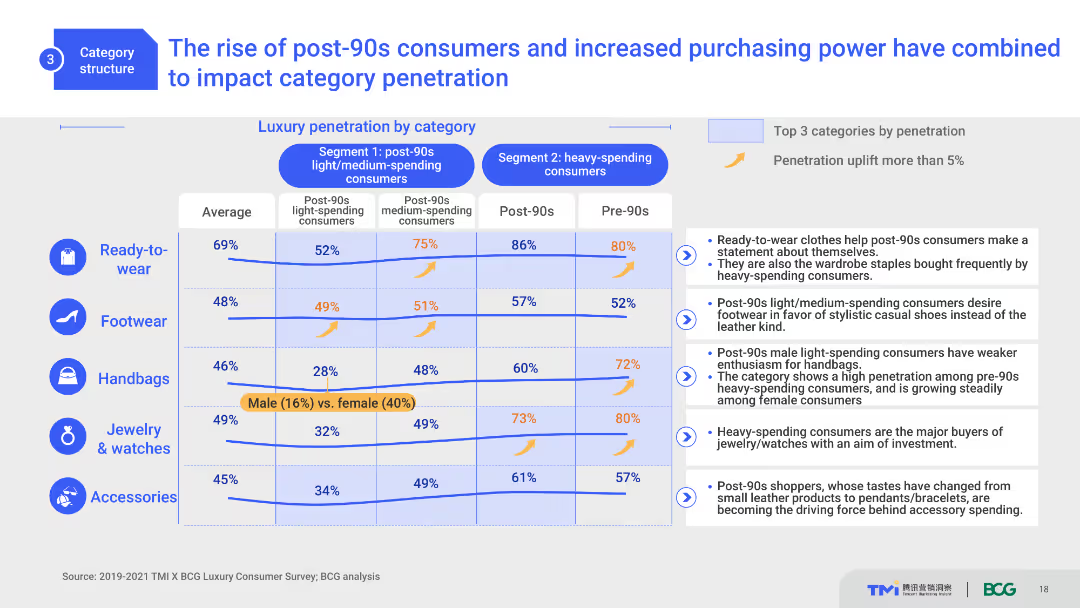
This slide includes a comparative layout with column charts and a table. It shows luxury category penetration by different consumer segments, highlighting the impact of post-90s consumers. The design is moderately complex with clear distinctions between segments and categories.
Market Analysis and Trends
Consumer Goods
This slide analyzes the influence of post-90s consumers on luxury market penetration across different categories. It compares segment-specific data, highlighting purchasing trends and the significant impact of younger consumers.
post-90s consumers, luxury market, category penetration, trends, consumer segments
Mixed Chart
BCG
Saved
Displays a column chart tracking the cost/income ratio over several years with detailed annotations about significant reductions and achievements in cost management.
Operational Efficiency
Financial Services
Details the bank's successful strategies in reducing operational costs and improving efficiency, aligning with financial stability and strategic investments, providing insights into fiscal management and efficiency.
cost reduction, operational efficiency, financial stability, strategic investments, CIR
Mixed Chart
Deutsche Bank
Saved
Shows a stacked area chart of daily new COVID-19 cases by region and highlights key epidemic progression metrics.
Regulatory and Compliance
Healthcare & Pharmaceuticals
Analyzes regional COVID-19 case trends and the progress in vaccine rollout, emphasizing the significant drop in cases due to vaccination efforts.
COVID-19, case trends, vaccine rollout, regional data, public health, epidemic progression
Mixed Chart
BCG
Saved
This slide presents a stacked column chart detailing government expenditure by subdivision over several years. It includes categories such as personnel and capital assets.
Regulatory and Compliance
Government & Public Sector
Analyzes trends in government spending across various categories over time, highlighting changes in expenditure.
Government spending, trends, expenditure, fiscal year, budget
Single Chart
PwC/Strategy&
Saved
Donut chart paired with a bar chart. The donut chart shows 34% have an HR tech strategy, while the bar chart details the strategy prevalence by sector like banking and engineering.
Human Resources and Talent Management
Professional Services
Evaluates the presence of formal HR technology strategies within various sectors, highlighting a significant strategy adoption in banking and engineering.
HR strategy, sectors, technology, donut chart, bar chart
Multiple Chart
PwC/Strategy&
Saved
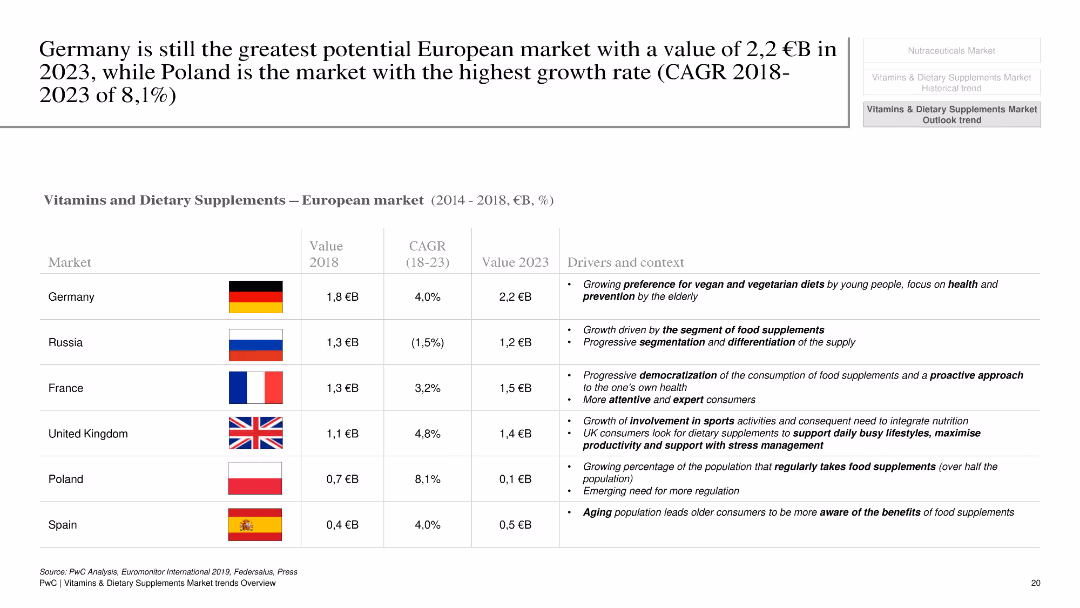
This slide compares the vitamins and dietary supplements markets across several European countries, using a table format. It includes columns for market value, CAGR, and key drivers for each country. Flags of the respective countries are also displayed.
Market Analysis and Trends
Healthcare & Pharmaceuticals
The slide compares market potential for vitamins and dietary supplements across Germany, Russia, France, the UK, Poland, and Spain. It provides a detailed analysis of market size, growth rates, and key factors driving market trends in each country, emphasizing Germany's potential and Poland's high growth rate.
market potential, Germany, Europe, vitamins, dietary supplements, growth rate
Table
PwC/Strategy&
Saved
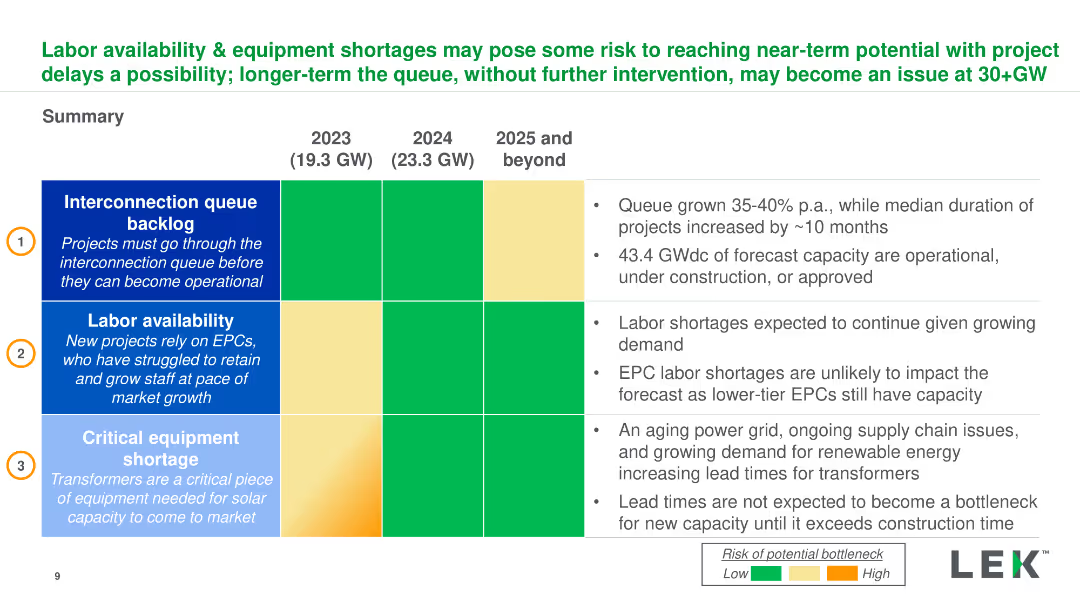
Summary table and bullet points detailing interconnection queues, labor availability, and equipment shortages for 2023-2025. Dense with key insights.
Risk Assessment and Management
Energy & Utilities
Overview of risks to solar project timelines due to labor shortages, interconnection queues, and equipment delays, and their potential impact on capacity.
Labor, Equipment, Solar Projects, Interconnection, Risk Management
Table
LEK
Saved
The slide features a title, two sections with column charts, and additional small text boxes with statistics. The first chart shows the growth in consumers with hybrid fitness routines from 2020 to 2022. The second part has comparison stats on health outcomes between hybrid fitness consumers and general respondents.
Market Analysis and Trends
Healthcare & Pharmaceuticals
This slide discusses the increasing adoption of hybrid fitness models, comparing data from 2020 and 2022. It provides evidence of effectiveness by showing higher positive health outcomes among hybrid fitness users versus all respondents. The slide could be used to discuss market trends in health and fitness and consumer behavior changes post-pandemic.
Hybrid fitness, health outcomes, consumer trends, market analysis, data comparison
Single Chart
McKinsey
Saved
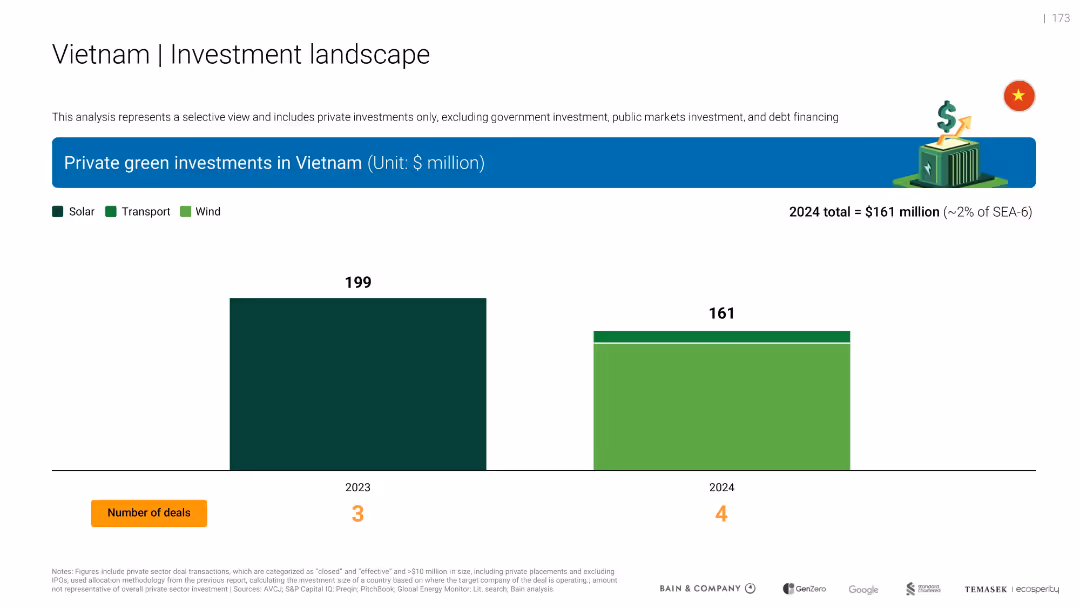
Bar chart comparing private green investments in Vietnam for 2023 and 2024, categorized by Solar, Transport, and Wind. Includes number of deals and icons.
Investment Analysis
Environmental Services & Sustainability
This slide visualizes private green investments in Vietnam, showing a decrease from $199M in 2023 to $161M in 2024. It segments investments into solar, transport, and wind, and notes 4 deals in 2024 versus 3 in 2023.
Vietnam, green investments, solar, transport, wind, 2024, deals, chart
Single Chart
Bain
Saved
The slide shows a bar chart with VC investment percentages relative to GDP in different regions and a descriptive text block.
Investment Analysis
Financial Services
Highlighting the investment needed to grow the SEA internet economy to $200 billion, the slide compares VC investment as a percentage of GDP among various regions.
SEA, internet economy, investment, VC, GDP
Single Chart
Bain
Saved
Circular diagram showing the product lifecycle stages (Pre-Launch, At Launch, In Market) and associated services Ipsos offers, with text descriptions of each stage.
Strategic Planning
Professional Services
Outlines the different stages of a product lifecycle and the various services Ipsos provides to support clients at each stage. Emphasizes strategic planning and service integration.
Product Lifecycle, Strategic Planning, Services, Ipsos
Diagram
IPSOS
Saved
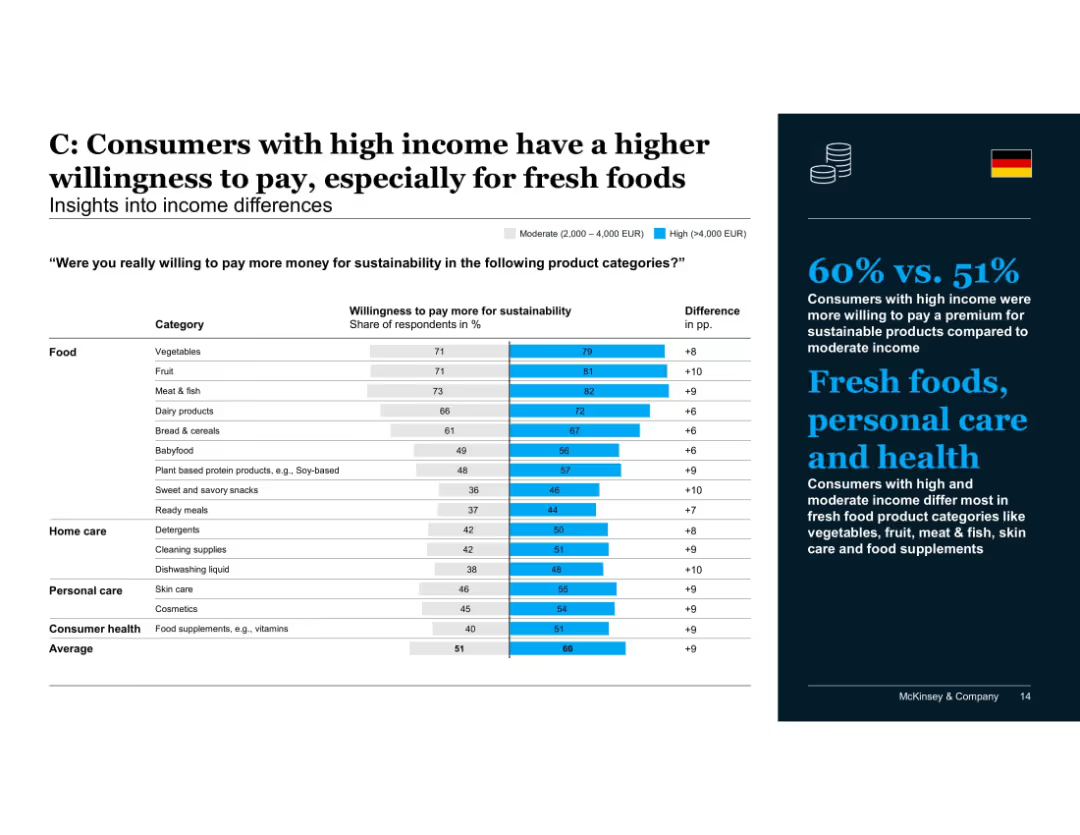
Bar chart comparing moderate vs. high income groups on willingness to pay more by product category
Customer and Market Segmentation
Consumer Goods
High-income consumers are more willing to pay a premium for sustainability, particularly for fresh foods such as meat, fruit, and vegetables. Differences are also noted in health and personal care categories, reflecting values alignment.
income differences, sustainability, willingness to pay, fresh food, high income, health products, personal care, McKinsey, Germany
Mixed Chart
McKinsey
Saved
Includes a table comparing CCB returns and overhead ratios with industry peers, and column charts showing overhead ratio comparisons within JP Morgan Chase's largest business segments.
Competitive Landscape
Financial Services
This slide compares JP Morgan Chase & Co.'s efficiency and return metrics against industry peers and within its own largest business segments, suitable for presentations on competitive analysis and financial benchmarking.
efficiency, returns, competitive analysis, financial benchmarking, JP Morgan Chase, business segments, industry peers
Multiple Chart
JP Morgan
Saved
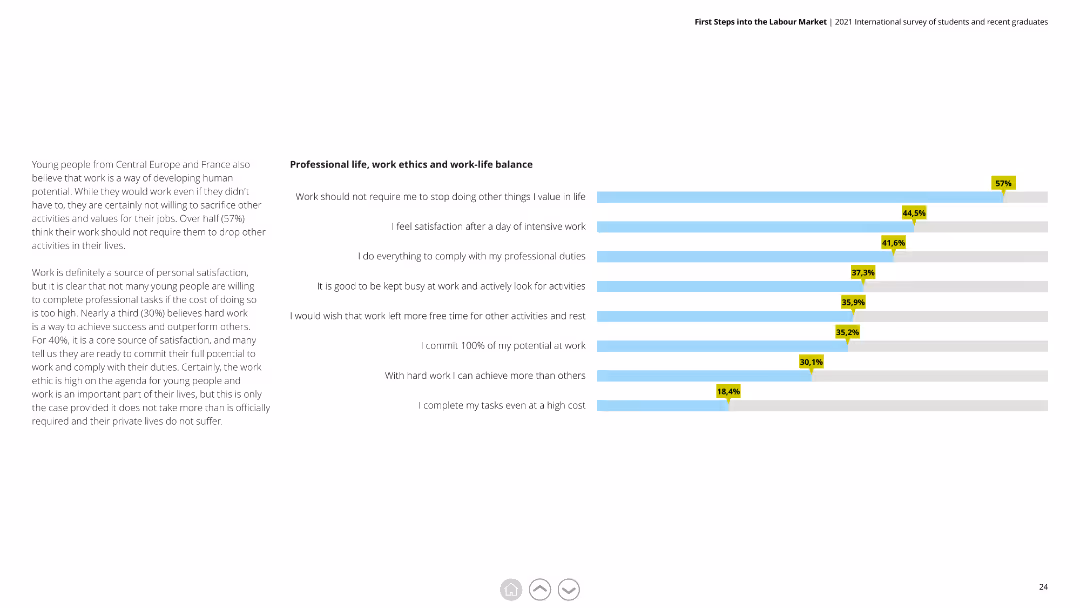
Horizontal bar chart showing various statements about work-life balance with corresponding percentages, accompanied by a detailed text explanation on the left.
Human Resources and Talent Management
Education & Training
This slide explores young people's perspectives on work-life balance, including the importance of balancing work with personal life and the levels of satisfaction.
work-life balance, satisfaction, professional duties, young people, work ethic
Mixed Chart
Deloitte
Saved
Split into two sections: Traditional AI/ML on the left with text and an icon, Generative AI on the right with text and an icon.
Operational Efficiency
Technology & Software
The slide contrasts traditional AI/ML roles with generative AI, highlighting changes in roles from decision-making to content creation.
traditional AI, generative AI, decision making, content creation, role changes
Boxed
BCG
Saved
The slide presents a two-column text format with a small section in the lower right corner depicting a U.S. map with colored dots indicating branch locations. The colors correspond to a legend identifying various cities. The layout is well-organized and easy to follow.
Financial Performance
Financial Services
Highlights the expansion of community centers and the role of Community Managers. It discusses trust-building with clients and providing financial education, with a focus on minority communities. The map shows branch locations across the U.S.
Community Banking, Financial Education, Branch Expansion, Trust-Building, Minority Communities, U.S. Map, Community Managers
Boxed
JP Morgan
Saved
Uses a vertical flow diagram to depict the integration and enhancements in client solutions, with emphasis on digital transformation and payment solutions.
Technology and Digital Transformation
Financial Services
Describes JPMorgan’s initiatives to adapt and expand its client solutions, focusing on digital platforms like InstaMed and payment optimization, aimed at enhancing client engagement and satisfaction.
Client Solutions, Digital Transformation, Payments, Innovation, Engagement, Satisfaction
Header Horizontal
JP Morgan
Saved
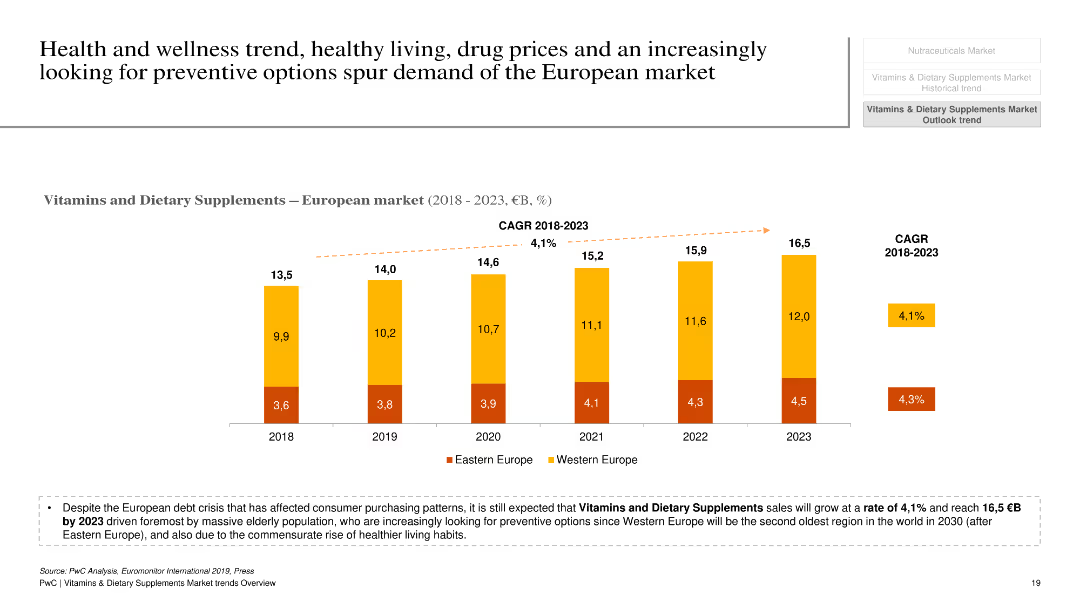
The slide features a column chart illustrating the growth of the European market for vitamins and dietary supplements from 2018 to 2023, segmented by Eastern and Western Europe. A text box below the chart highlights key drivers and market trends.
Market Analysis and Trends
Healthcare & Pharmaceuticals
The slide outlines the expected growth of the European vitamins and dietary supplements market, driven by health and wellness trends, preventive health measures, and demographic factors. It includes a comparative analysis of market segments and provides an overview of growth rates and key influencing factors.
European market, vitamins, dietary supplements, growth drivers, preventive health
Mixed Chart
PwC/Strategy&
Saved
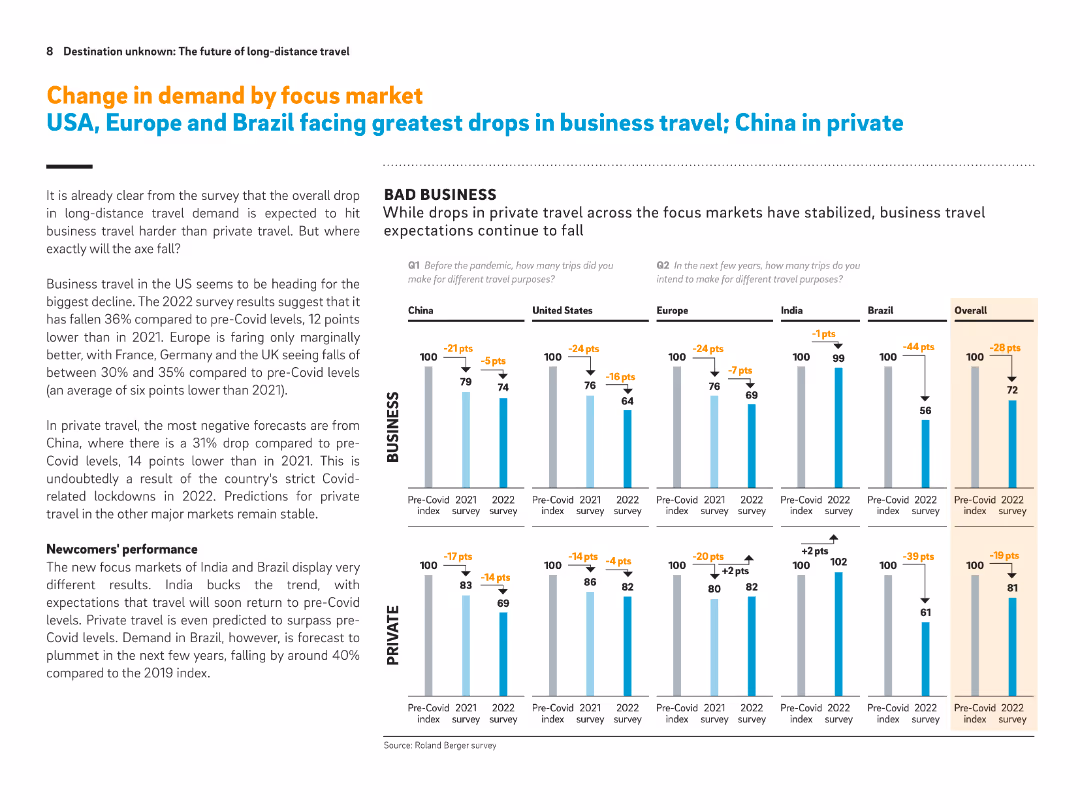
Multiple comparative bar charts for six regions (China, US, Europe, etc.). Focused on business vs. private travel drops.
Market Analysis and Trends
Transportation & Logistics
Business travel demand is falling across all markets, with the US and Brazil showing the steepest declines. Private travel is somewhat more stable, though China shows the largest drop in this category. India and Europe show resilience or improvement.
Business travel, private travel, regional differences, post-Covid demand, long-distance travel, China, Brazil, US, India
Multiple Chart
Roland Berger
Saved
The slide features a two-column layout with bullet points. On the left, text is accompanied by a header "Take payments from virtually anywhere – Merchant Services". On the right, four smaller headers "Optimize contactless payments", "Reimagine the checkout experience", "Drive loyalty through your app", and "Meet your customers where they are" each followed by bullet points with benefits for customers and providers. The slide's background is white with a slight texture.
Market Analysis and Trends
Financial Services
This slide presents various strategies for enhancing merchant services, such as optimizing contactless payments, reimagining the checkout experience, and driving app loyalty. It is used to propose business solutions for improving customer interactions and operational efficiency.
merchant services, contactless payments, checkout experience, customer loyalty, business solutions
Header Horizontal
JP Morgan
Saved
Previous
Next
If nothing, comes up, please save your slides first
Create a FREE account to continue browsing
Receive Instant Access to 1,000+ slides from companies like McKinsey, Google, and Goldman Sachs
First Name
Last Name
Email
Password
I agree to all
Terms & Privacy Policy
Thank you! Your submission has been received!
Oops! Something went wrong while submitting the form.
Have an account?
Sign in
Column Chart
Heatmap
Chevron
Org Chart
Infographic
Callouts
Timeline
List
Graphic
Picture
Process Flow
Diagram
Paragraph
Map
Table
Framework
Subtitle
Takeaway Box
Icon
Other Chart
Radar Chart
Waterfall Chart
Mekko Chart
Pie Chart
Scatter Plot
Line Chart
Bar chart
Bullet points