My Account
My Slides
Search by Category
Templates
View All Templates
Download Template Slides
Leave Feedback
Login
Logout
Get Started
Browse all Slides
Browse all Slides
Create a FREE Account
Instant access to 1,000+ real slides from top companies like McKinsey, BCG, Goldman Sachs, Google and many more!
First Name
Last Name
Email
Password
I agree to all
Terms & Privacy Policy
Thank you! Your submission has been received!
Oops! Something went wrong while submitting the form.
Have an account?
Sign in
Saved Slides
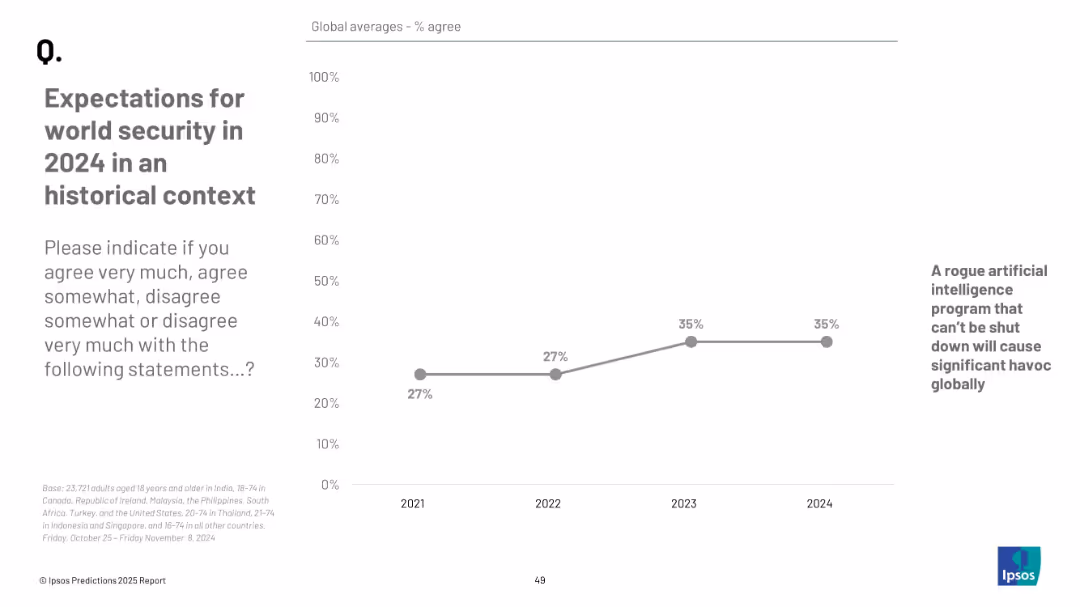
Line chart from 2021 to 2024; x-axis years, y-axis % agree; one question tracked over time; plain design
Risk Assessment and Management
Government & Public Sector
This slide tracks agreement over time (2021–2024) on the likelihood of a rogue AI causing global havoc. Agreement rose from 27% in 2021 to 35% by 2023–2024.
historical trend, AI risk, security perception, public opinion, Ipsos data, technology threat, chart
Mixed Chart
IPSOS
Saved
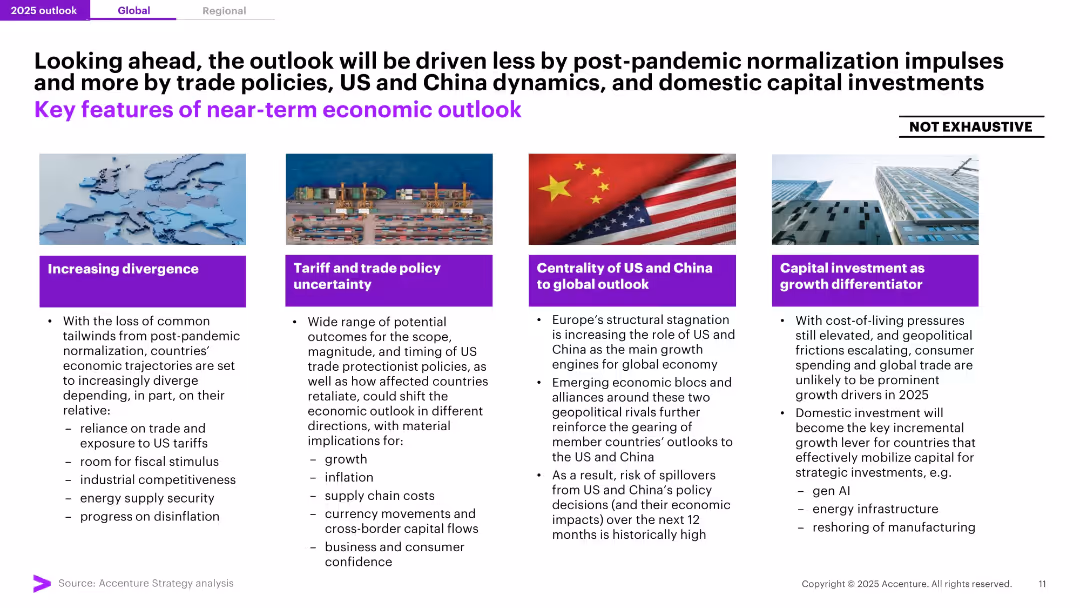
Four-panel layout with bold iconography and brief bulleted points below themed headers in purple. High-contrast layout with minimal clutter.
Strategic Planning
Professional Services
The slide summarizes the key drivers of the 2025 economic outlook: divergence in national growth paths, tariff uncertainty, US-China dynamics, and the growing importance of domestic capital investments. Highlights risk and opportunity areas shaping near-term global economic conditions.
Economic Outlook, Trade, US-China, Investment, Divergence, Tariffs, 2025, Drivers, Strategy, Growth Differentiators
Pillar
Accenture
Saved
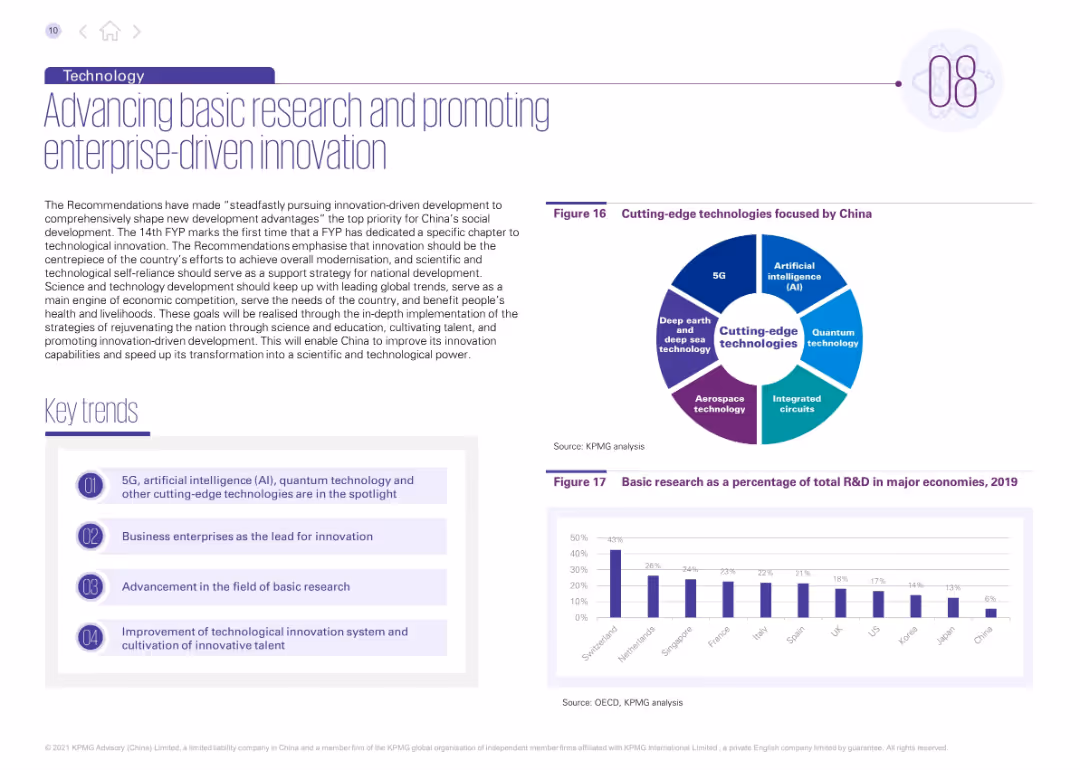
Left side includes narrative and four key trends; right side features a pie chart on cutting-edge tech areas and a bar chart comparing R&D spending.
Strategic Planning
Technology & Software
This slide discusses China’s innovation strategy under the 14th FYP, promoting enterprise-led R&D and focus on core technologies like AI, quantum computing, and semiconductors. It includes comparative R&D investment data and a pie chart outlining China’s innovation priorities.
R&D, innovation, AI, quantum tech, basic research, technology strategy, China innovation, enterprise-driven, semiconductors, 5G
Mixed Chart
KPMG
Saved
The slide is a comparative design with charts and visual elements. It features a timeline with circular nodes representing different business goals and strategies, icons symbolizing actions, and two large numerical statistics with accompanying text labels.
Strategic Planning
Financial Services
Discusses the growth opportunities and strategies for client acquisition and relationship management in the C&I franchise of JPMorgan Chase & Co. Utilizes numerical data and a process flow timeline to present expansion plans and customer relationship deepening methods.
C&I franchise, growth, acquisition, clients, relationships, strategy, JPMorgan Chase
Linear Flow
JP Morgan
Saved
Utilizes a split design with data on the left, a column chart in the center and an image of a user interface on the right. There's a notable use of blue tones and digital motifs.
Operational Efficiency
Technology & Software
Outlines the firm's digital portal features, its revenue impact, and the upcoming developer tools designed to enhance user experience and connectivity.
Digital portal, revenue growth, developer tools, user interface, API, technology, financial services, user experience
Mixed Chart
JP Morgan
Saved
The slide has column charts and text elements. It shows the utilization of corporate lending and credit lines, including incremental risk-weighted assets (RWA).
Financial Performance
Financial Services
This slide provides information on corporate lending and credit line utilization, detailing incremental RWA if fully drawn, useful for assessing corporate credit exposure and utilization rates.
Corporate, Lending, Credit, Utilization, RWA
Multiple Chart
UBS
Saved
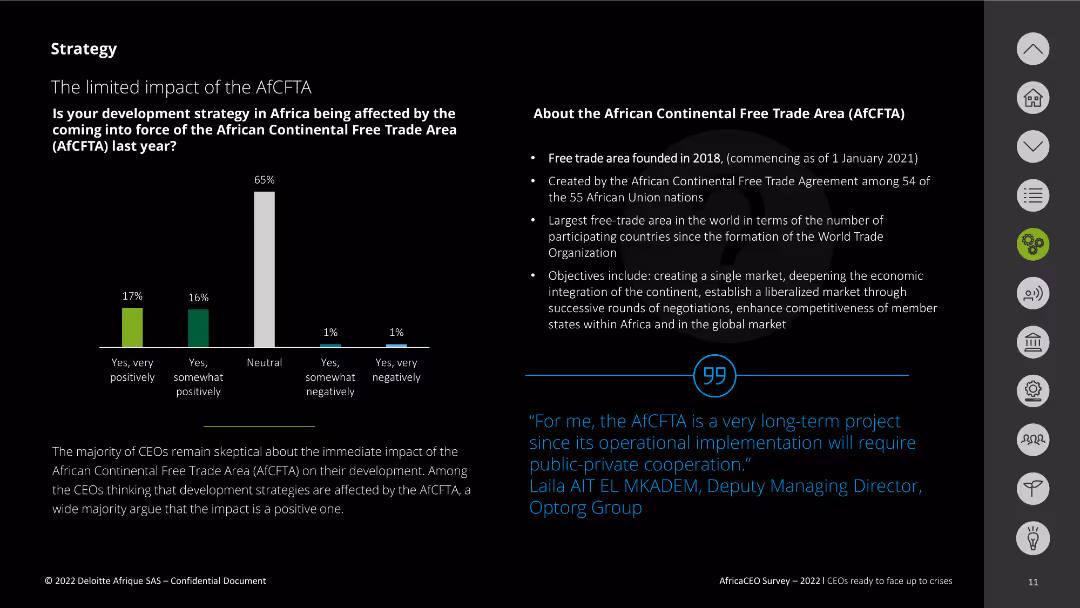
The slide features a column chart displaying survey responses about the impact of the AfCFTA. It also includes a text box explaining the AfCFTA, its founding, and objectives. A quote from a CEO is included at the bottom right.
Regulatory and Compliance
Government & Public Sector
This slide presents the survey results on the impact of the African Continental Free Trade Area (AfCFTA) on development strategies. It highlights skepticism among CEOs about its immediate impact and outlines the AfCFTA's key objectives and background.
AfCFTA, impact, survey, objectives, development strategy
Mixed Chart
Deloitte
Saved
The slide presents a column chart comparing the levelized cost of mobility for different train types, including hydrogen, electric, and diesel trains.
Financial Performance
Transportation & Logistics
The slide compares the cost-effectiveness of hydrogen trains with chlorine and electrolysis sources, electric trains, and diesel trains based on levelized cost per passenger.
hydrogen trains, electrification, diesel, cost comparison, mobility
Mixed Chart
Kearney
Saved
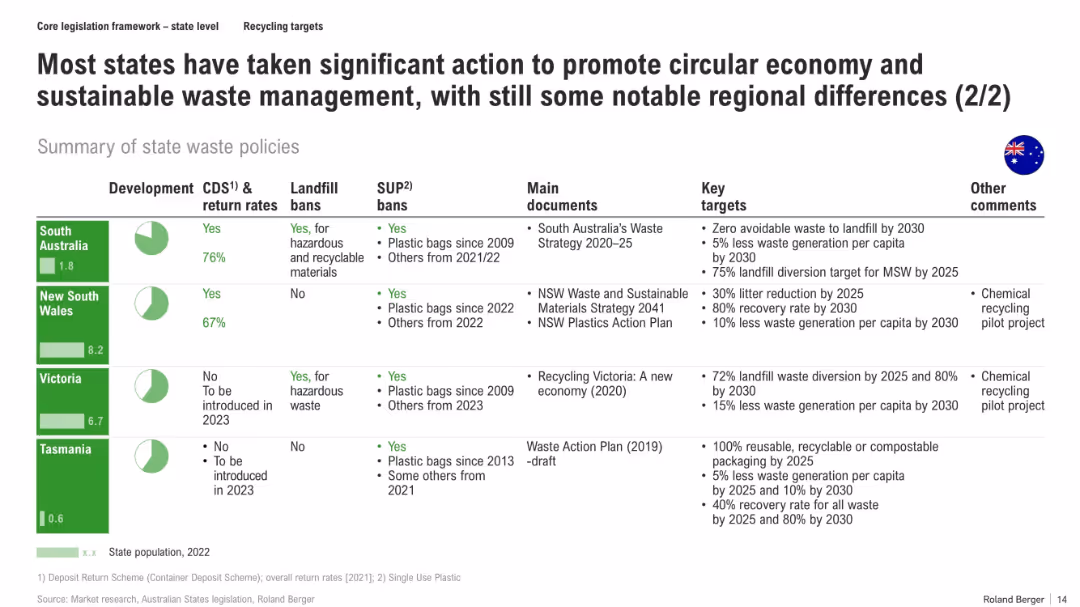
Tabular layout summarizing policies across four states with icons, colored headers, and key targets and comments for each
Regulatory and Compliance
Environmental Services & Sustainability
The slide summarizes waste management developments for South Australia, NSW, Victoria, and Tasmania, including CDS implementation, bans, strategic documents, and ambitious waste diversion/reduction targets. It highlights regional variations and the progressive steps each state has taken.
recycling targets, landfill bans, plastic bag bans, state policies, CDS, circular economy, Australia
Mixed Chart
Roland Berger
Saved
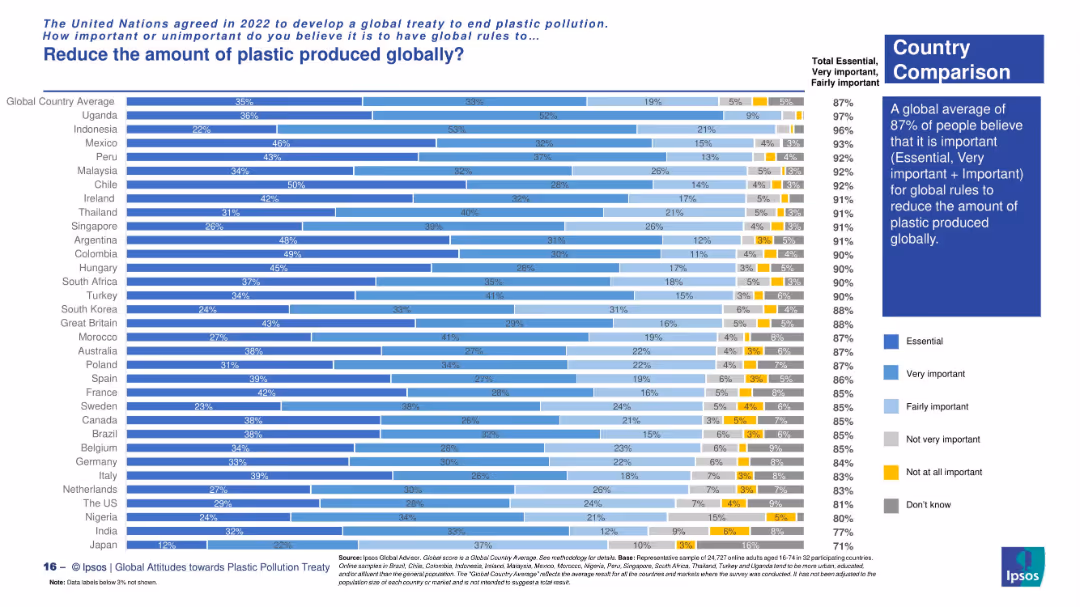
Vertical bar chart showing country-level opinions with five shades indicating importance levels. A summary box on the right highlights global sentiment.
Market Analysis and Trends
Environmental Services & Sustainability
This slide presents public opinion across countries on the importance of reducing global plastic production. The vast majority (87% globally) consider it essential or important. Country-level comparisons show highest support in Uganda, Indonesia, and Mexico.
plastic reduction, global rules, environmental awareness, country comparison, Ipsos survey, public opinion, global treaty
Mixed Chart
IPSOS
Saved
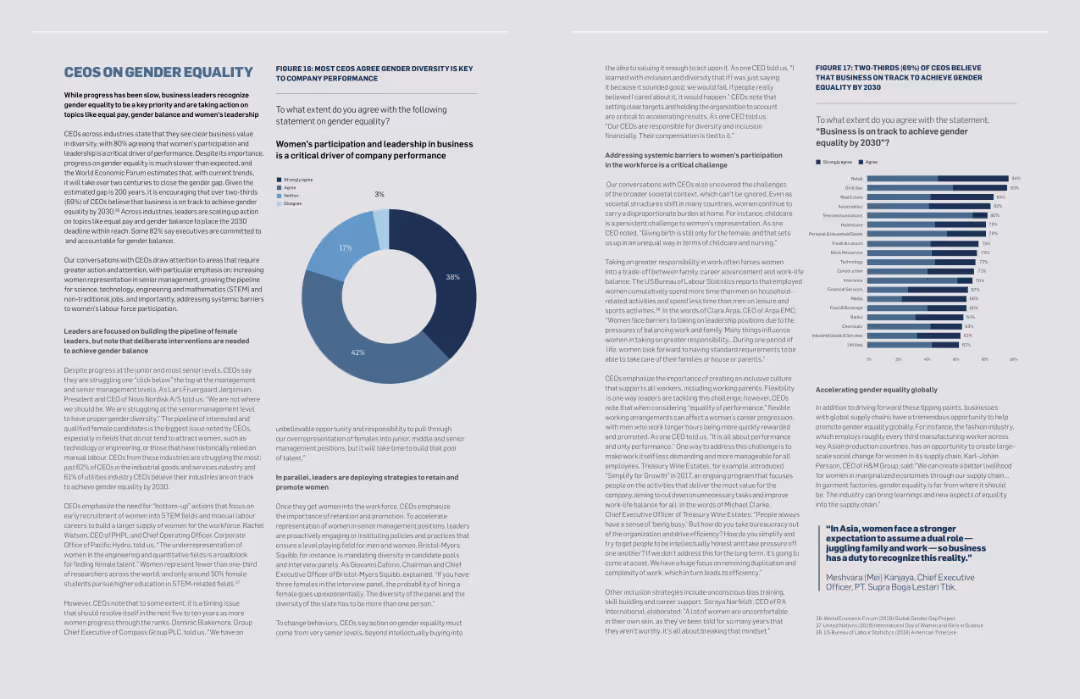
The slide contains text, a pie chart, and a column chart. The pie chart shows percentages of agreement on gender diversity's impact on business, while the column chart shows progress towards gender equality by 2030.
Market Analysis and Trends
Professional Services
The slide discusses the importance of gender equality in business, showing CEO opinions on its critical role in company performance and progress towards achieving gender equality by 2030.
Gender equality, CEOs, business performance, diversity, progress, gender balance, women's leadership, professional services, market trends, survey
Multiple Chart
Accenture
Saved
The slide depicts a circular diagram with four quadrants, each containing an icon and text. The purple central circle anchors the design, while arrows point outward to the individual pathways described.
Strategic Planning
Technology & Software
Outlines four strategic pathways that High Tech companies can pursue to expand industry boundaries, such as mergers & acquisitions, strategic alliances, demand sensors, and leveraging the installed base for expansion into adjacent areas.
High Tech, mergers & acquisitions, strategic alliances, demand sensors, adjacent areas, industry ecosystems, leapfrog growth, market-relevant joint offerings, bespoke solutions, installed base
Diagram
Accenture
Saved
This slide features an image of people collaborating over a tablet on the right, with the rest of the slide divided into text sections. The layout is clean, with white text on a red background for the headings and black text for the body. The image is captioned, contributing to the overall narrative.
Regulatory and Compliance
Government & Public Sector
Discusses the collaborative investments in R&D for the Tempest program and its implications for technological development and defense, suitable for presentations on government-industry partnerships and investment strategies.
Collaboration, R&D, Defense Technology, Investment, Government-Industry Partnerships
Vertical Flow
PwC/Strategy&
Saved
The slide includes an area chart showing the top 10 CCUS patents filed by OECD country producers from 1996-2018, with each country represented by a distinct color. Annotations provide context and highlight significant trends.
Financial Performance
Energy & Utilities
This slide details the number of patents filed for CCUS technologies by various OECD countries, showing the United States leading in patent filings. It highlights the competitive landscape in CCUS R&D and the leading contributors over time.
CCUS patents, United States, OECD, R&D, innovation
Single Chart
Kearney
Saved
The slide uses stacked column charts to compare the losses of perishable versus non-perishable foods in Nigeria, highlighting the disproportionately high losses of perishable foods.
Strategic Planning
Agriculture & Food Production
This slide analyzes food loss in Nigeria, emphasizing the greater vulnerability of perishable goods due to inadequate cold storage facilities. It suggests potential areas for infrastructural improvements to reduce these losses significantly.
Food Loss, Perishable Goods, Nigeria, Storage, Analysis
Multiple Chart
BCG
Saved
Diagram illustrating how complex AI/ML models can be made interpretable through certain techniques.
Technology and Digital Transformation
Technology & Software
Explains techniques for making AI/ML models interpretable, aiding in understanding and trust of AI systems.
AI/ML, interpretability, models, techniques
Diagram
PwC/Strategy&
Saved
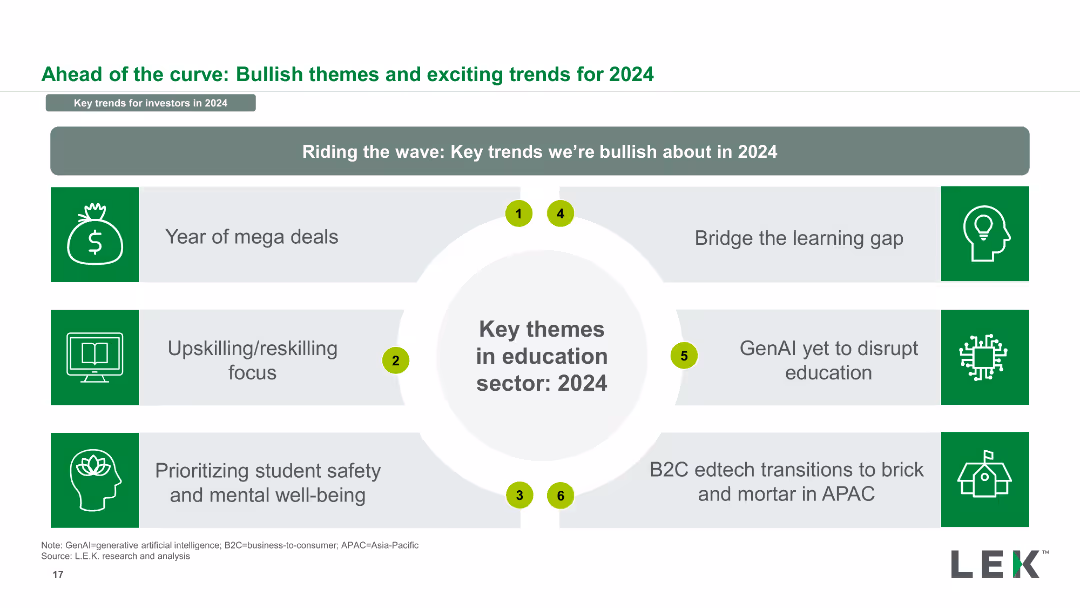
The slide features a central circle with "Key themes in education sector: 2024" surrounded by six rectangular blocks highlighting trends, with icons in each block.
Strategic Planning
Education & Training
This slide highlights key bullish trends in the education sector for 2024, including mega deals, upskilling focus, student safety, learning gap bridging, GenAI, and B2C edtech.
trends, education, 2024, key themes, bullish, mega deals, upskilling, GenAI, B2C edtech
Diagram
LEK
Saved
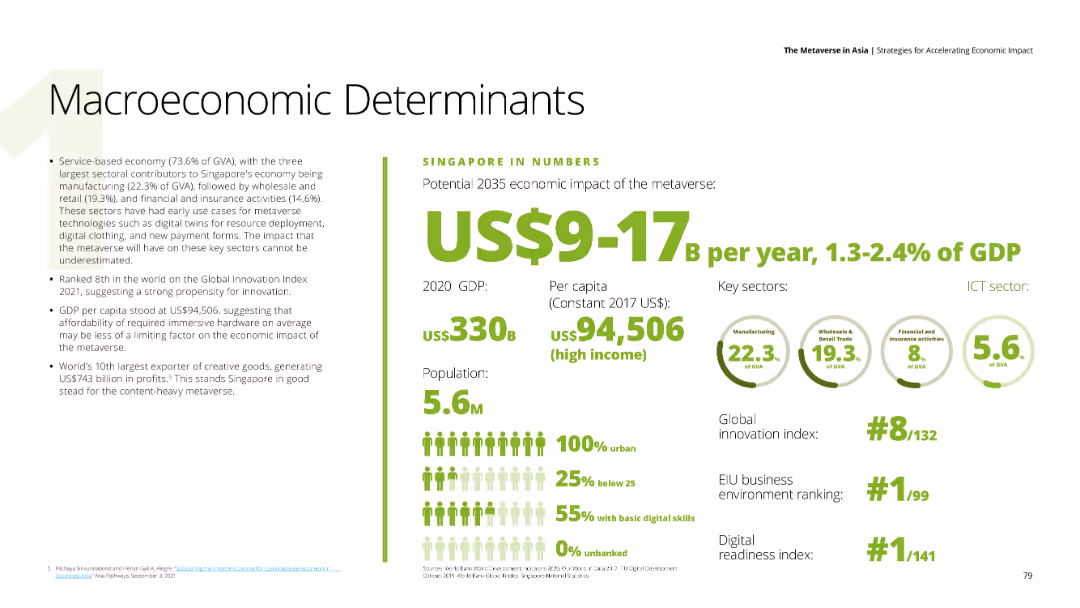
Detailed text on Singapore's economic impact of the metaverse, with numerical data on GDP, per capita income, and key sectors like manufacturing, wholesale trade, and financial activities. Background is white with green and black text.
Market Analysis and Trends
Financial Services
Evaluates Singapore's strong economic position and potential metaverse impact, mentioning GDP, innovation index ranking, and key sectors contributing to the economy.
Singapore, metaverse, economic impact, GDP, innovation index
Mixed Chart
Deloitte
Saved
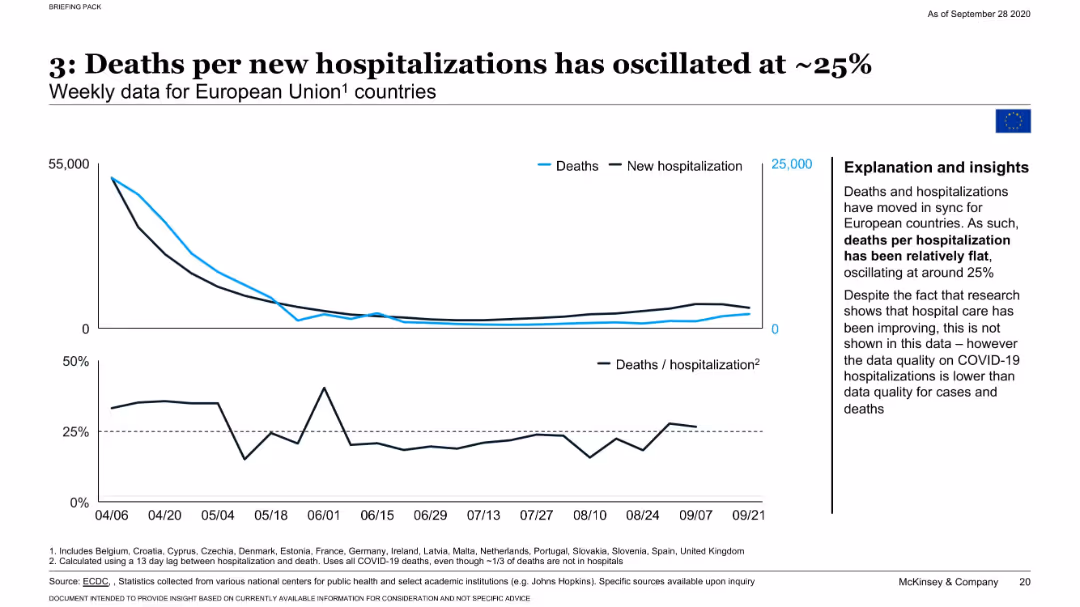
Line chart with two axes: one for death counts, another for hospitalizations; additional chart shows death/hospitalization ratio.
Performance Metrics and KPIs
Healthcare & Pharmaceuticals
Tracks weekly deaths and hospitalizations across EU countries, highlighting that death per hospitalization has remained stable around 25%. Notes limitations in hospitalization data quality and implications for evaluating treatment outcomes.
hospitalization, mortality, EU, COVID-19, health systems, McKinsey
Mixed Chart
McKinsey
Saved
Features bar charts displaying preferred locations for socialization, along with a notable quote from a survey respondent.
Market Analysis and Trends
Retail & E-commerce
Reveals consumer preferences for socializing in the upcoming months, with a strong inclination towards home settings and virtual connections.
Socializing trends, Consumer preferences, Virtual connection, Home setting, Market research, Bar charts, Survey insights, Telecommunications
Single Chart
Accenture
Saved
A comprehensive slide with pie charts and data points that break down credit distribution by segments, FICO scores, and regional exposure. The use of blue and black color segments in the charts aligns with Citigroup's branding.
Risk Assessment and Management
Financial Services
The slide presents an overview of Citigroup's consumer and corporate credit distribution, showcasing the company's credit risk management strategies and the diversity of its credit portfolio. It is designed to communicate credit risk profiles to stakeholders and illustrate the company's financial resilience.
Citigroup, Credit Overview, Consumer Credit, Corporate Lending, FICO Score, Regional Exposure, Credit Management, Risk Analysis
Multiple Chart
Citigroup
Saved
The slide uses a combination of text and circular data visualizations to show the percentage of viewers engaging with content across OTT, LTV, and Movie Studios. It uses a green and white color scheme with icons and a clear layout.
Market Analysis and Trends
Media & Entertainment
This slide compares the digital engagement rates across OTT, LTV, and Movie Studios. It highlights the high levels of engagement, with specific percentages for each vertical, indicating significant digital influence even for LTV content.
digital engagement, OTT, LTV, Movie Studios, viewer engagement, consumer survey, digital influence
Mixed Chart
BCG
Saved
The slide has a column chart showing the share of renewables in global power generation from 1995 to 2050, with different scenarios highlighted on the right.
Market Analysis and Trends
Energy & Utilities
The slide projects the growth of renewable energy in power generation, emphasizing the increase in wind and solar power.
renewables, power supply, energy, wind, solar, 2035
Mixed Chart
McKinsey
Saved
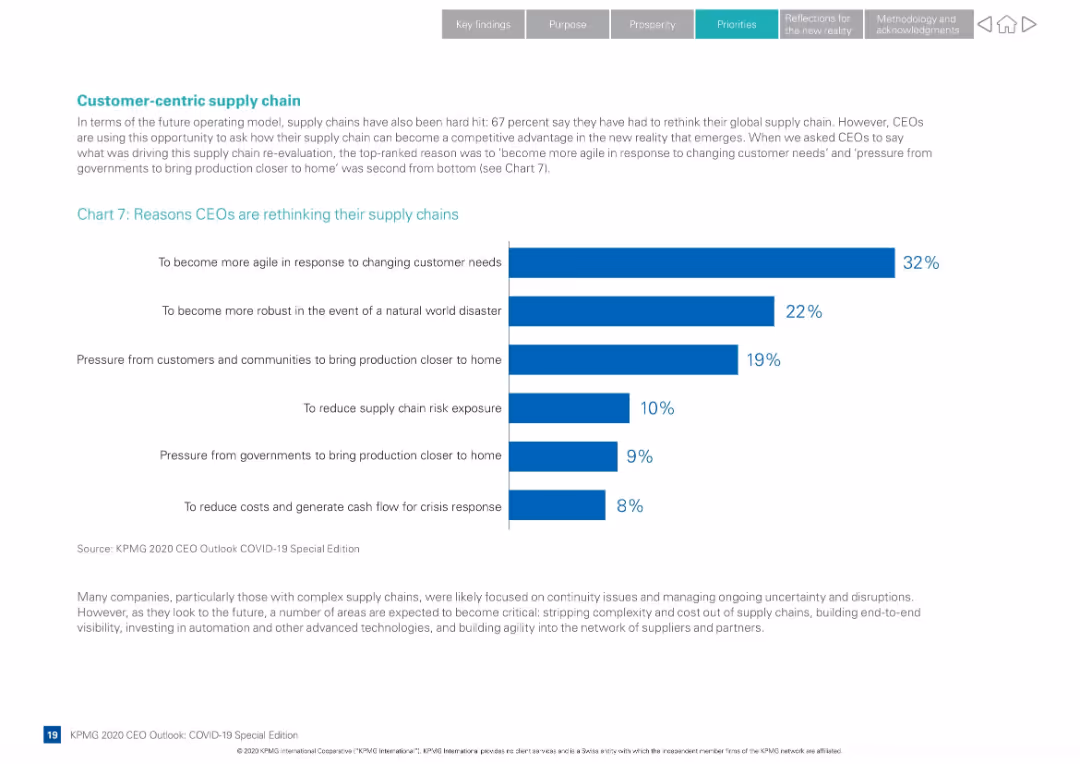
Clean, white-background layout with horizontal bar chart and supporting paragraph text
Operational Efficiency
Transportation & Logistics
Presents reasons CEOs are rethinking supply chains post-COVID. Emphasis on agility, robustness, and proximity to customers. Cites motivations like natural disasters, risk exposure, and government pressure.
supply chain, agility, COVID-19, CEO priorities, logistics, operational strategy, bar chart, customer needs
Mixed Chart
KPMG
Saved
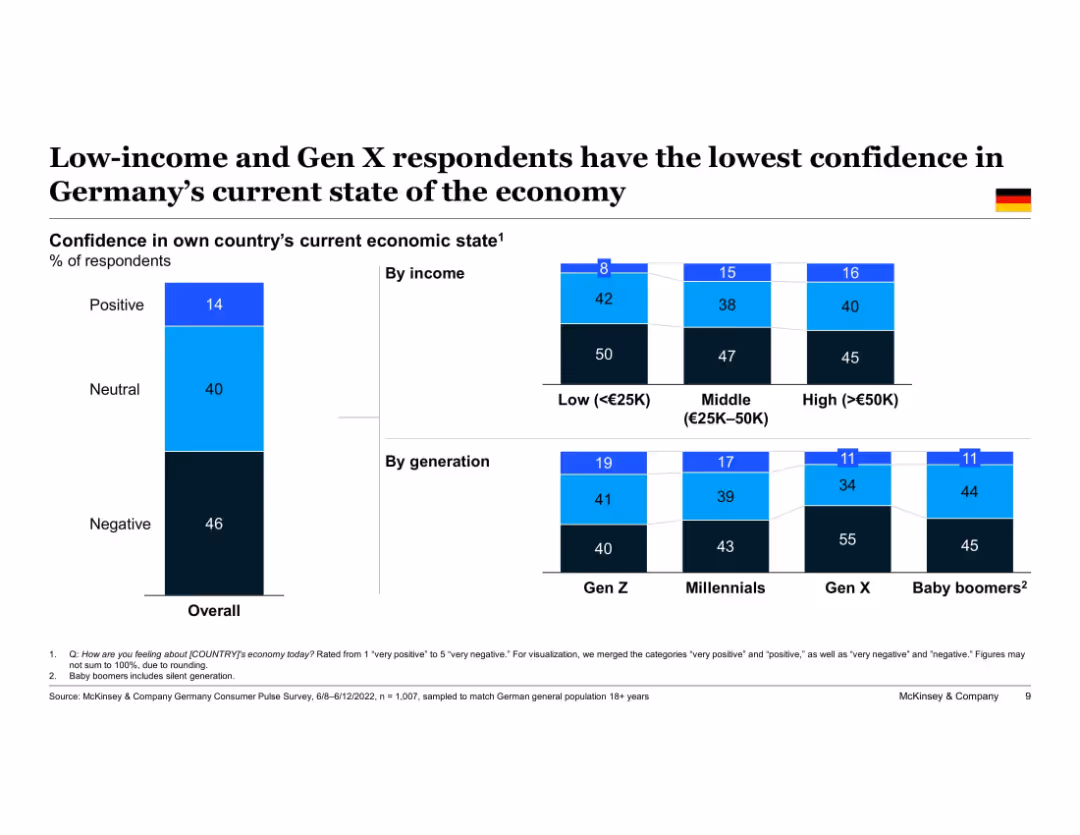
Split vertical bar charts showing confidence by income and generation. Simple color scheme and German flag indicator.
Customer and Market Segmentation
Consumer Goods
This slide shows that German consumers from lower income brackets and Gen X have the least confidence in the economy. Data emphasizes varying levels of positivity and negativity by demographic.
economic confidence, income disparity, generational differences, Germany, consumer outlook, survey data
Single Chart
McKinsey
Saved
Previous
Next
If nothing, comes up, please save your slides first
Create a FREE account to continue browsing
Receive Instant Access to 1,000+ slides from companies like McKinsey, Google, and Goldman Sachs
First Name
Last Name
Email
Password
I agree to all
Terms & Privacy Policy
Thank you! Your submission has been received!
Oops! Something went wrong while submitting the form.
Have an account?
Sign in
Column Chart
Heatmap
Chevron
Org Chart
Infographic
Callouts
Timeline
List
Graphic
Picture
Process Flow
Diagram
Paragraph
Map
Table
Framework
Subtitle
Takeaway Box
Icon
Other Chart
Radar Chart
Waterfall Chart
Mekko Chart
Pie Chart
Scatter Plot
Line Chart
Bar chart
Bullet points