My Account
My Slides
Search by Category
Templates
View All Templates
Download Template Slides
Leave Feedback
Login
Logout
Get Started
Browse all Slides
Browse all Slides
Create a FREE Account
Instant access to 1,000+ real slides from top companies like McKinsey, BCG, Goldman Sachs, Google and many more!
First Name
Last Name
Email
Password
I agree to all
Terms & Privacy Policy
Thank you! Your submission has been received!
Oops! Something went wrong while submitting the form.
Have an account?
Sign in
Saved Slides
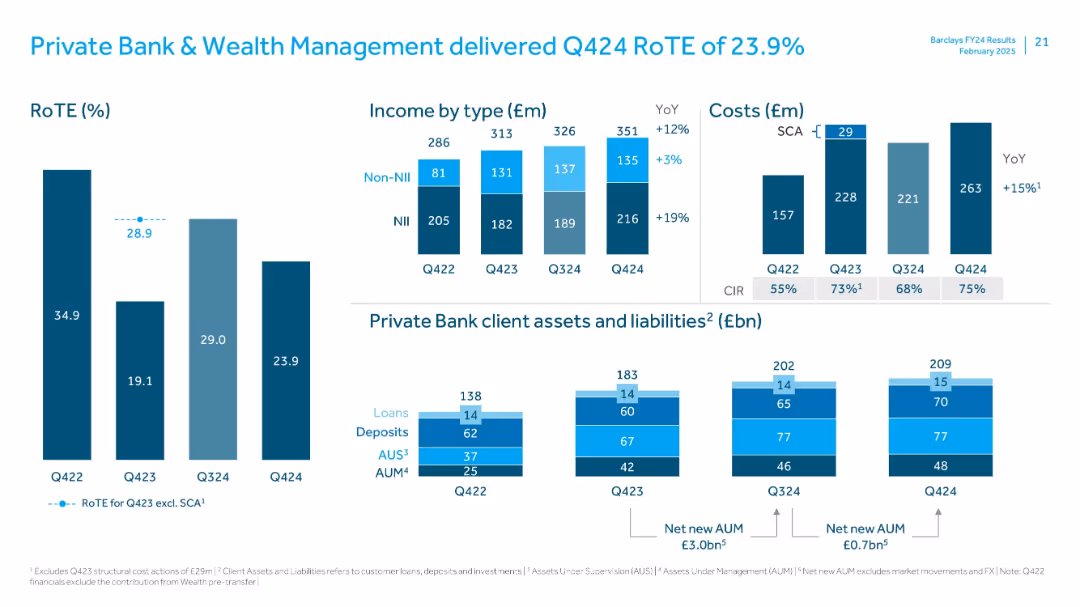
Bar charts for RoTE and income; bottom section covers client assets and liabilities using stacked bars
Financial Performance
Financial Services
Reviews Private Bank & Wealth Management’s Q424 RoTE performance. Income rose YoY, driven by NII growth. Assets under management and supervision increased, highlighting strong net new inflows. CIR and cost movements also explained.
Private Bank, Wealth Management, RoTE, AUM, AUS, NII, CIR, client assets, liabilities
Multiple Chart
Barclays
Saved
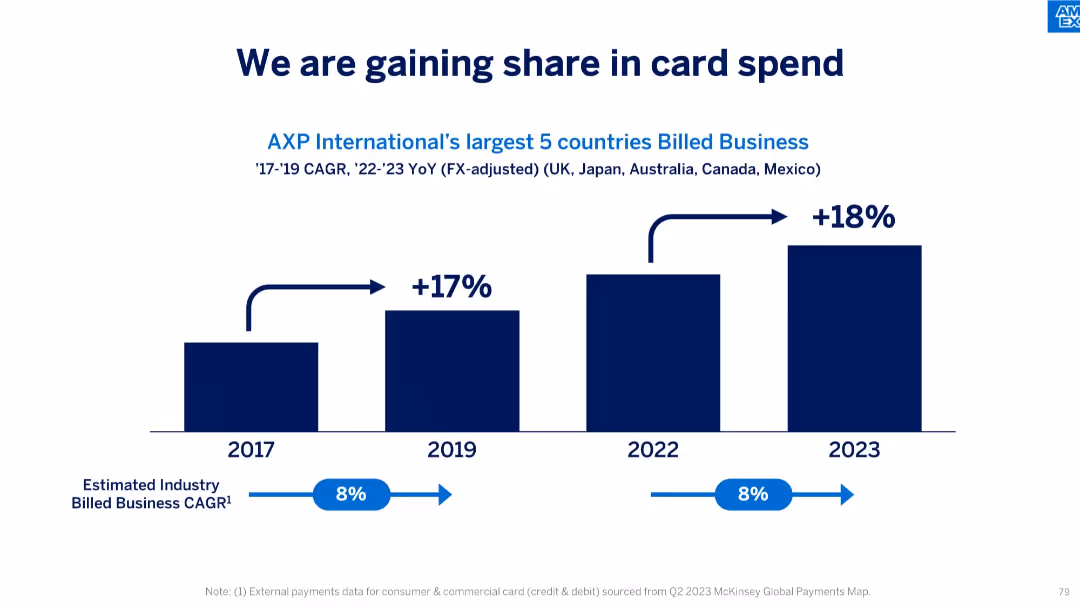
Similar format to previous, stacked bar chart showing card spend growth, 2017–2023.
Performance Metrics and KPIs
Financial Services
Demonstrates AXP's increased share in billed card business across its top 5 international countries, significantly outperforming the estimated industry CAGR of 8%, especially in 2023 with 18% growth.
card spend, share gain, billed business, international markets, CAGR, KPIs, performance tracking, industry benchmark
Single Chart
McKinsey
Saved
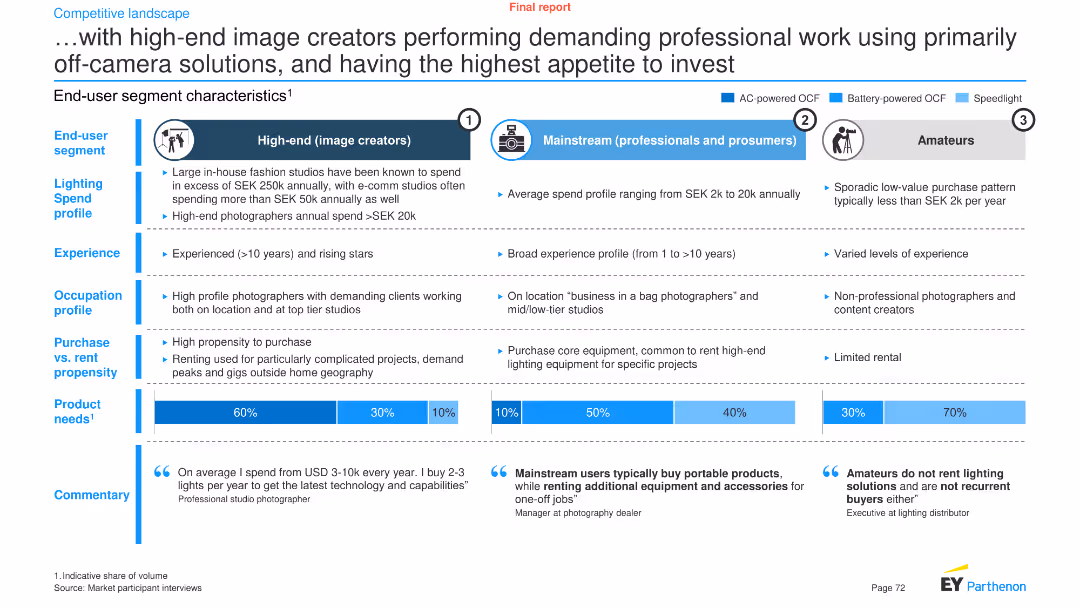
This slide has a comparative layout featuring three vertical sections. Each section describes a different end-user segment with icons, text, and bar graphs.
Market Analysis and Trends
Professional Services
It analyzes the characteristics, spending profiles, and product needs of high-end image creators, mainstream professionals, and amateurs.
High-end, image creators, lighting spend, segments, product needs, investment, professional work, end-user, market analysis, trends
Multiple Chart
EY
Saved
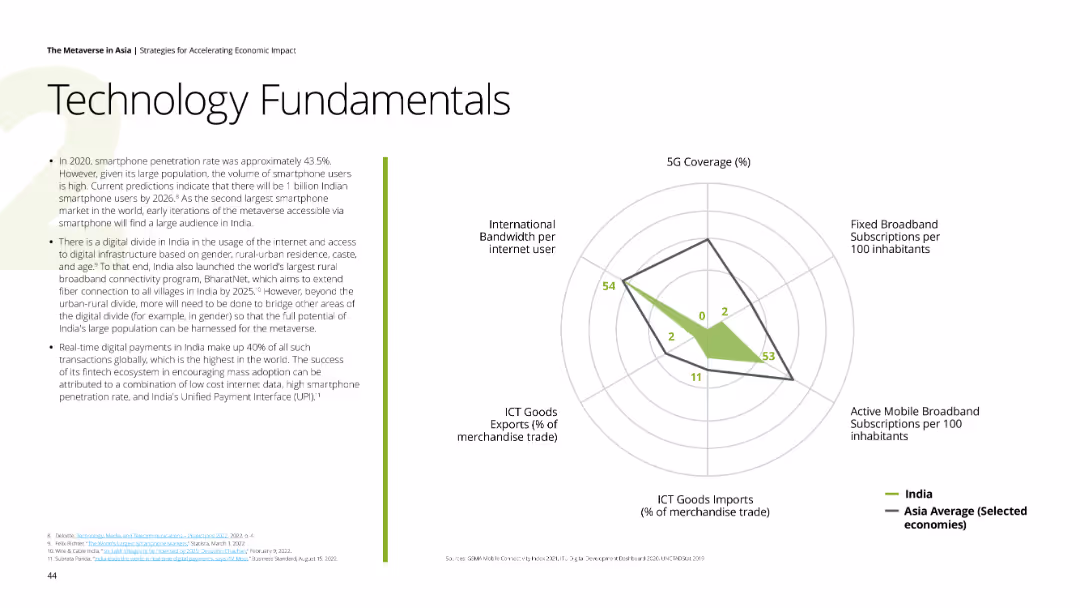
Text and a radar chart showing various technology metrics like 5G coverage and broadband subscriptions for India.
Technology and Digital Transformation
Technology & Software
The slide details the technological fundamentals necessary for the metaverse, focusing on India’s tech readiness.
technology, fundamentals, 5G, broadband, India
Mixed Chart
Deloitte
Saved
Slide includes column chart comparing population figures from 2020 to 2050 by continent, alongside lists of countries with notable population sizes in 2050.
Market Analysis and Trends
Government & Public Sector
Analyzes population changes on a continental level, projecting significant increases in Africa and Asia. Discusses demographic shifts that will influence global economic, social, and political trends over the next three decades.
population, Africa, Asia, growth, demographics
Mixed Chart
Roland Berger
Saved
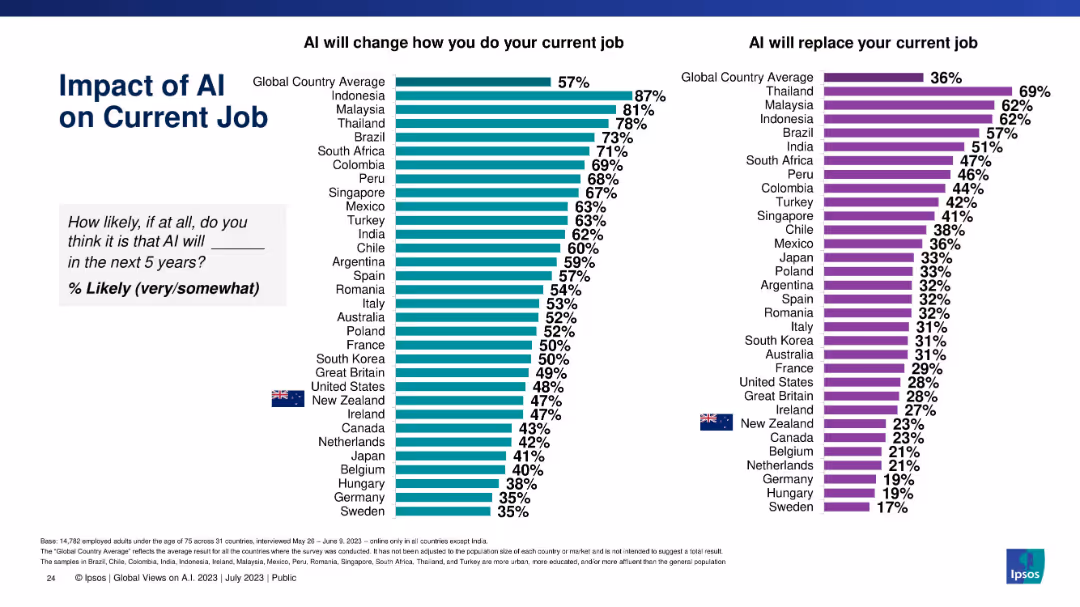
Horizontal bar charts comparing 30+ countries' likelihood perception on AI changing or replacing jobs, with country flags and percentage values.
Market Analysis and Trends
Artificial Intelligence
This slide presents global comparisons of opinions on whether AI will change or replace jobs in the next five years. It ranks countries based on perceived likelihood, highlighting global disparities.
AI, global comparison, job change, job replacement, perception, countries, survey data, Ipsos, horizontal bars
Multiple Chart
IPSOS
Saved
Features a line chart on the left comparing WTI crude oil price and US rig count, and a line chart on the right showing crude oil production by country.
Market Analysis and Trends
Energy & Utilities
This slide provides insights into the oil market, comparing WTI crude oil prices with US rig counts and analyzing oil production trends across different countries.
oil prices, WTI crude, rig count, production, countries
Multiple Chart
JP Morgan
Saved
Presents a bar chart categorizing various government operational expenditures such as personnel, subsidies, and interest payments, with monetary values in NS '000.
Regulatory and Compliance
Government & Public Sector
Details operational expenditure categories within the government, essential for financial management and planning, focusing on personnel and interest payments as major expenses.
operational, expenditure, government, financial planning, analysis, personnel, subsidies, interest payments, table, management
Single Chart
PwC/Strategy&
Saved
A textual slide with headers and bullet points. It divides the ecommerce market into two segments, with company logos to represent examples.
Product and Service Analysis
Retail & E-commerce
Discusses the segmentation of the SEA ecommerce market into first-hand and second-hand goods, including the business models and monetization strategies of each, along with market size data and notable companies in the region.
eCommerce, SEA, market segments, first-hand goods, second-hand goods
Header Vertical
Bain
Saved
Features column charts displaying hypothetical shifts in net interest income due to changes in the yield curve.
Risk Assessment and Management
Financial Services
This analytical slide explores the sensitivity of net interest income to changes in interest rates, presenting data projections up to 2026. It's designed for financial risk managers and analysts to assess the potential impact of interest rate fluctuations on the bank's earnings, aiding in strategic financial planning and risk mitigation efforts.
Interest Rates, Financial Risk, Projections, Banking, Sensitivity Analysis
Multiple Chart
Deutsche Bank
Saved
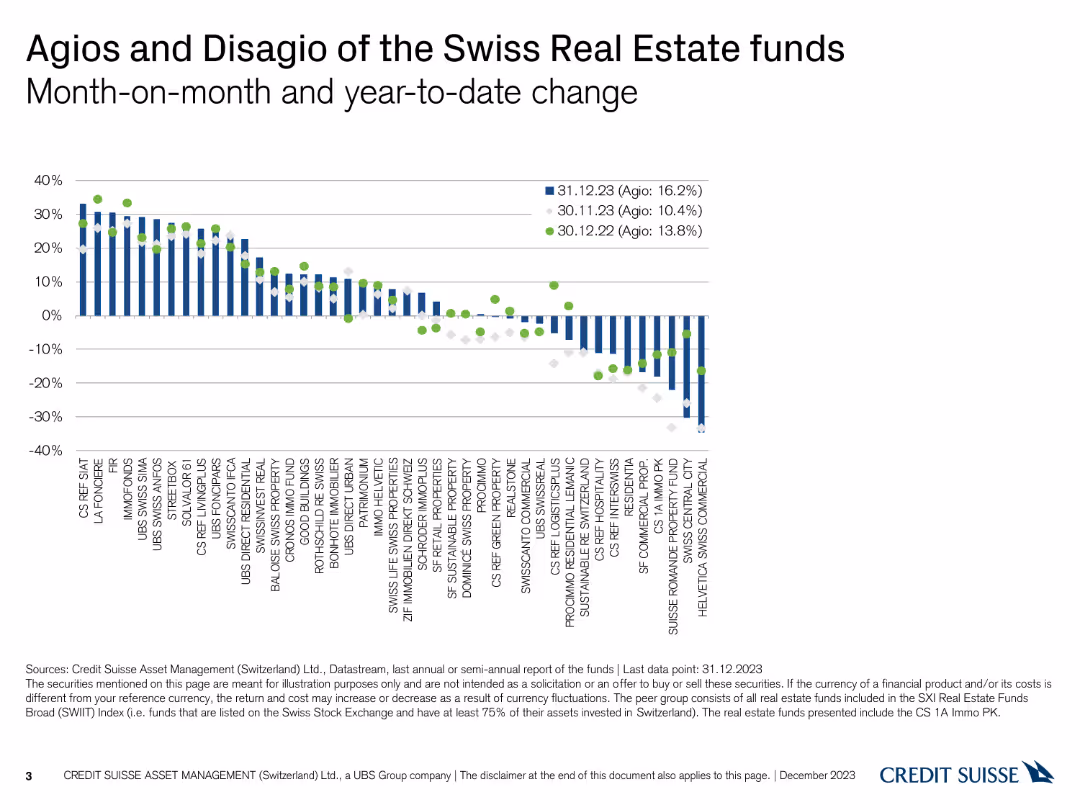
A column chart depicting month-on-month and year-to-date changes in Agio and Disagio percentages for Swiss real estate funds with three data points.
Financial Performance
Financial Services
This slide shows the month-on-month and year-to-date changes in the Agio and Disagio of various Swiss real estate funds, comparing data from three different dates.
Agio, Disagio, Month-on-Month, Year-to-Date, Funds
Single Chart
Credit Suisse
Saved
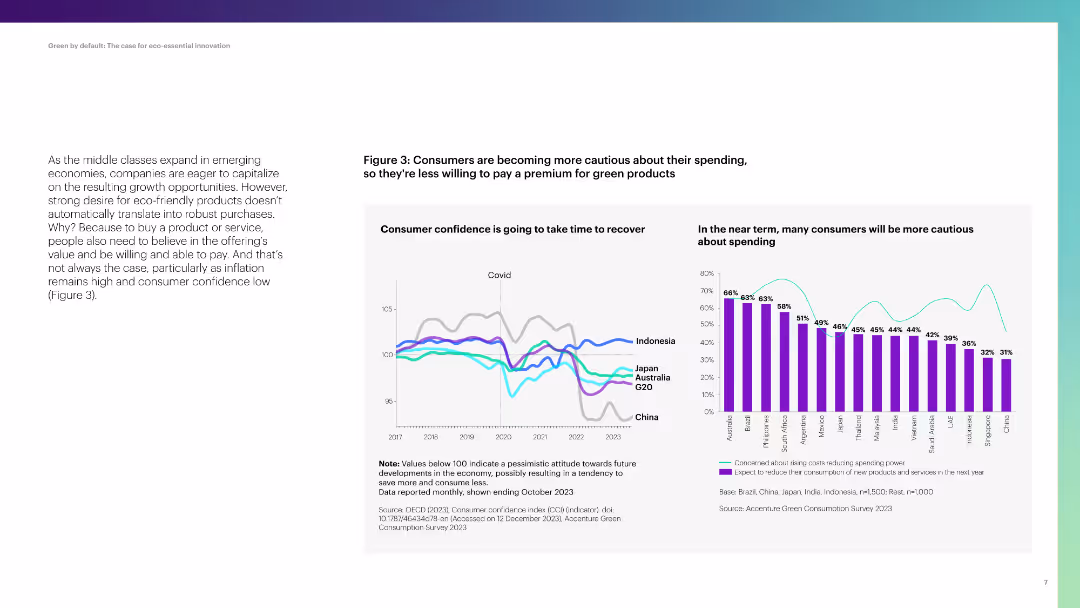
Two charts: a line chart showing consumer confidence over time and a column chart showing spending caution in various countries.
Market Analysis and Trends
Consumer Goods
The slide discusses consumer caution in spending, with data on confidence levels and reduced spending intentions across several countries.
consumer confidence, spending, caution, Brazil, China, Japan, Indonesia, Australia
Multiple Chart
Accenture
Saved
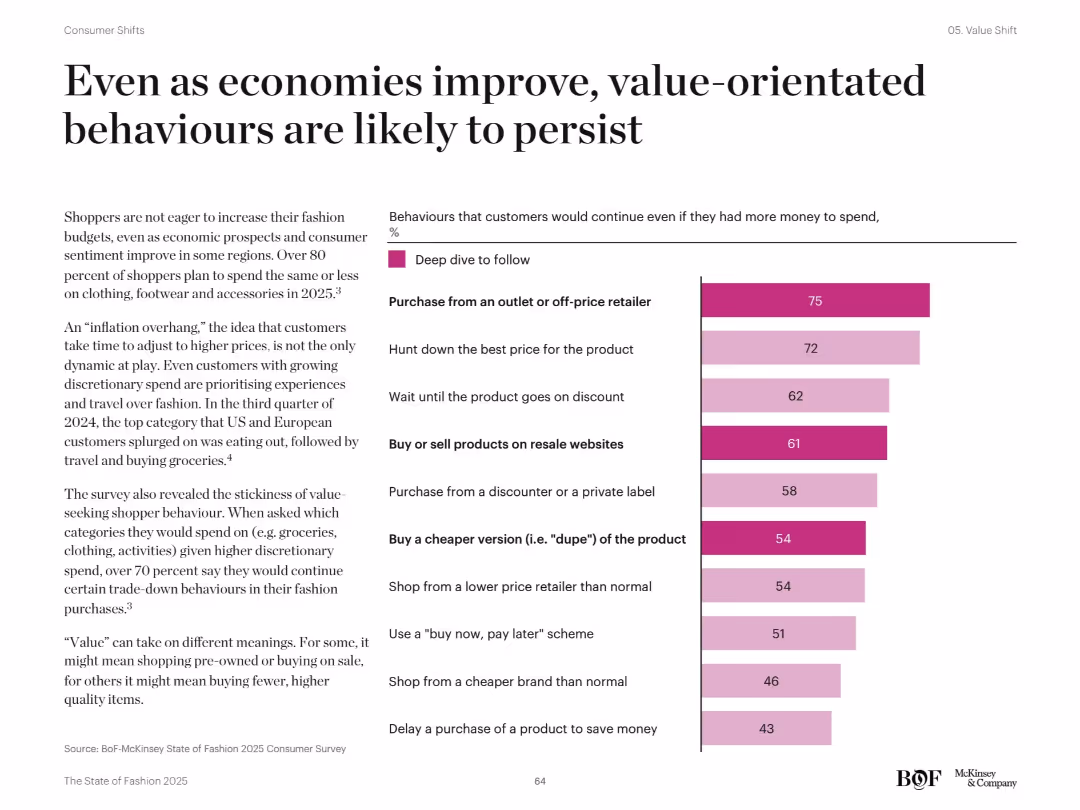
Right bar chart listing top 10 consumer trade-down behaviors with % deep dive follow. Left text discusses post-inflation and value-persistence behaviors. Dark pink bars indicate strong consumer intent.
Pricing Strategies
Retail & E-commerce
Despite improved economic outlook, shoppers are expected to maintain cost-conscious behaviors. Lists key actions such as buying from off-price retailers, waiting for discounts, and choosing cheaper versions. Highlights over 80% plan to spend the same or less on fashion in 2025.
value behavior, discount shopping, price sensitivity, trade-down, economic resilience
Mixed Chart
McKinsey
Saved
The slide features a column chart comparing growth/decline in oil demand from 2019 to 2035 by underlying driver, including economic development and fuel efficiencies.
Market Analysis and Trends
Industrial & Manufacturing
The slide analyzes the impact of COVID-19 on oil demand in comparison to other factors like economic development and fuel efficiencies.
COVID-19, oil demand, behavioral shifts, economic development, fuel efficiency
Boxed
McKinsey
Saved
Slide features a title on top, two-column charts comparing Chase's delinquency rate to industry, and Chase's servicing cost per unit from FY14 to FY18. Red highlights draw attention to specific data points. Small text and footnotes are at the bottom.
Financial Performance
Financial Services
The slide presents financial data from 2014 to 2018, comparing Chase's mortgage delinquency rates and servicing costs against the industry average, emphasizing the company's risk management and cost efficiency.
delinquency rate, servicing cost, financial data, risk management, efficiency
Multiple Chart
JP Morgan
Saved
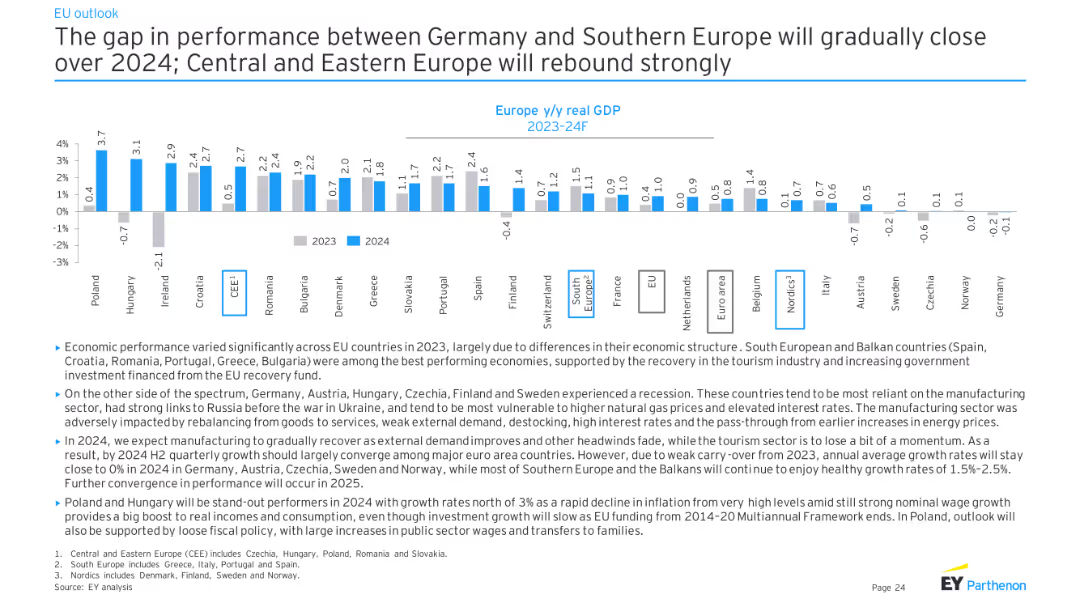
The slide features a column chart depicting Europe y/y real GDP (2023-24F) for various countries. The data is presented in a comparative format, showing projected GDP growth rates across Europe with textual explanations at the bottom.
Market Analysis and Trends
Financial Services
This slide discusses the expected convergence in economic performance between Germany and Southern Europe in 2024, while Central and Eastern Europe are projected to rebound strongly. It provides a comparative analysis of GDP growth rates across different European regions.
GDP growth, Europe, economic convergence, forecast
Mixed Chart
EY
Saved
The slide is split into two main sections, left featuring a list of elements in a global operating model, right showing the benefits with logos of partnerships. Blue and red are predominant colors.
Strategic Planning
Financial Services
Describes the dual structure of a business model delivering globally and managing locally, alongside benefits of global leverage, highlighting partnerships and value propositions.
Business Model, Global, Local, Partnerships, Leverage, Scale, Marketing, Client Service, Citigold
Header Horizontal
Citigroup
Saved
Displays line graphs comparing real GDP growth forecasts from multiple sources for the Philippines, projecting economic recovery trends.
Market Analysis and Trends
Financial Services
Evaluates future economic trends in the Philippines based on forecasts from various institutions, detailing expected GDP growth rates.
economic forecasts, Philippines, GDP growth, recovery trends, line graphs, future trends, financial forecasting
Mixed Chart
Deloitte
Saved
Column chart showing the percentage of companies filing AI patents in Europe, North America, and APAC.
Market Analysis and Trends
Technology & Software
The slide highlights the lag in AI patent filings by European companies compared to North American and APAC counterparts.
AI, patents, Europe, North America, APAC, market trends, innovation, technology
Mixed Chart
Accenture
Saved
Title slide with a large background image, presentation title, and date, set for an introductory slide.
Industry Overview
Professional Services
Introduces a series on global restart dynamics, indicating it's the start of a discussion on COVID-19's impact.
Global Restart, COVID-19, Pandemic, Key Dynamics, Perspectives Series
Title
BCG
Saved
Features a multi-part diagram describing various aspects of successful loyalty programs, like simplicity and functionality.
Strategic Planning
Retail & E-commerce
Explains the components of effective loyalty programs, including gamification and personalization, to enhance customer engagement.
loyalty, gamification, personalization, engagement, diagram
Diagram
BCG
Saved
Three circular images illustrating fast-paced innovation cycles, active management, and cross-functional approach to innovation.
Organizational Structure and Change
Professional Services
This slide outlines the three key dimensions of organizational and company culture that active AI players excel in: innovation cycles, management, and cross-functional approach.
innovation, management, cross-functional, organizational culture, active players, company, three dimensions, circular images, text, images
Pillar
BCG
Saved
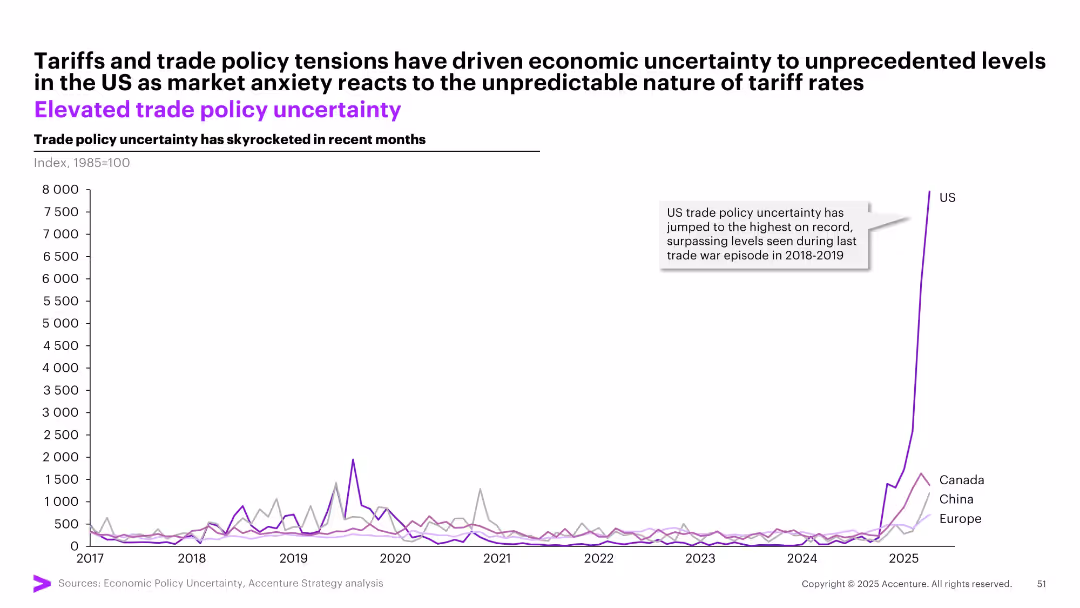
Single line chart showing trade policy uncertainty index from 2017 to 2025 for US, Canada, China, and Europe; sharp spike in US
Risk Assessment and Management
Government & Public Sector
This slide tracks trade policy uncertainty, with the US showing a historic spike in 2025—exceeding even 2018–19 trade war levels. The rise highlights market anxiety and unpredictability around tariff actions, signaling significant risk to investment and trade decisions.
trade policy, uncertainty, US, tariffs, risk, global markets, economic anxiety
Single Chart
Accenture
Saved
Includes a line graph showing 'Growth in world oil supply and demand', and extensive text explaining the current status and challenges of the oil and gas sector post-market collapse.
Industry Overview
Energy & Utilities
Analyzes the recovery trends in the oil and gas industry, noting new projects and changes in market dynamics, alongside challenges like decline in new discoveries and geopolitical issues.
Oil and Gas, Recovery, Challenges, Market Trends
Mixed Chart
PwC/Strategy&
Saved
The slide features multiple bullet lists and bar charts arranged in a column layout.
Operational Efficiency
Financial Services
This slide details various financial advisory services like credit review, business review, and restructuring plans, outlining the scope and benefits of each to optimize business financial processes and strategies.
financial services, restructuring, credit review, advisory, strategy
Table
Alvarez & Marsal
Saved
Previous
Next
If nothing, comes up, please save your slides first
Create a FREE account to continue browsing
Receive Instant Access to 1,000+ slides from companies like McKinsey, Google, and Goldman Sachs
First Name
Last Name
Email
Password
I agree to all
Terms & Privacy Policy
Thank you! Your submission has been received!
Oops! Something went wrong while submitting the form.
Have an account?
Sign in
Column Chart
Heatmap
Chevron
Org Chart
Infographic
Callouts
Timeline
List
Graphic
Picture
Process Flow
Diagram
Paragraph
Map
Table
Framework
Subtitle
Takeaway Box
Icon
Other Chart
Radar Chart
Waterfall Chart
Mekko Chart
Pie Chart
Scatter Plot
Line Chart
Bar chart
Bullet points