My Account
My Slides
Search by Category
Templates
View All Templates
Download Template Slides
Leave Feedback
Login
Logout
Get Started
Browse all Slides
Browse all Slides
Create a FREE Account
Instant access to 1,000+ real slides from top companies like McKinsey, BCG, Goldman Sachs, Google and many more!
First Name
Last Name
Email
Password
I agree to all
Terms & Privacy Policy
Thank you! Your submission has been received!
Oops! Something went wrong while submitting the form.
Have an account?
Sign in
Saved Slides
Two column charts showing ESG ratings and risk, with a blue color theme. Accompanied by a list of awards on the right side, contrasting against a white background.
Regulatory and Compliance
Financial Services
Showcases the company’s ESG ratings and recognitions to convey commitment to sustainable and ethical operations, likely used in reports or presentations to highlight achievements and market position in terms of responsibility.
ESG, sustainability, awards, ethical operations, market position
Multiple Chart
Goldman Sachs
Saved
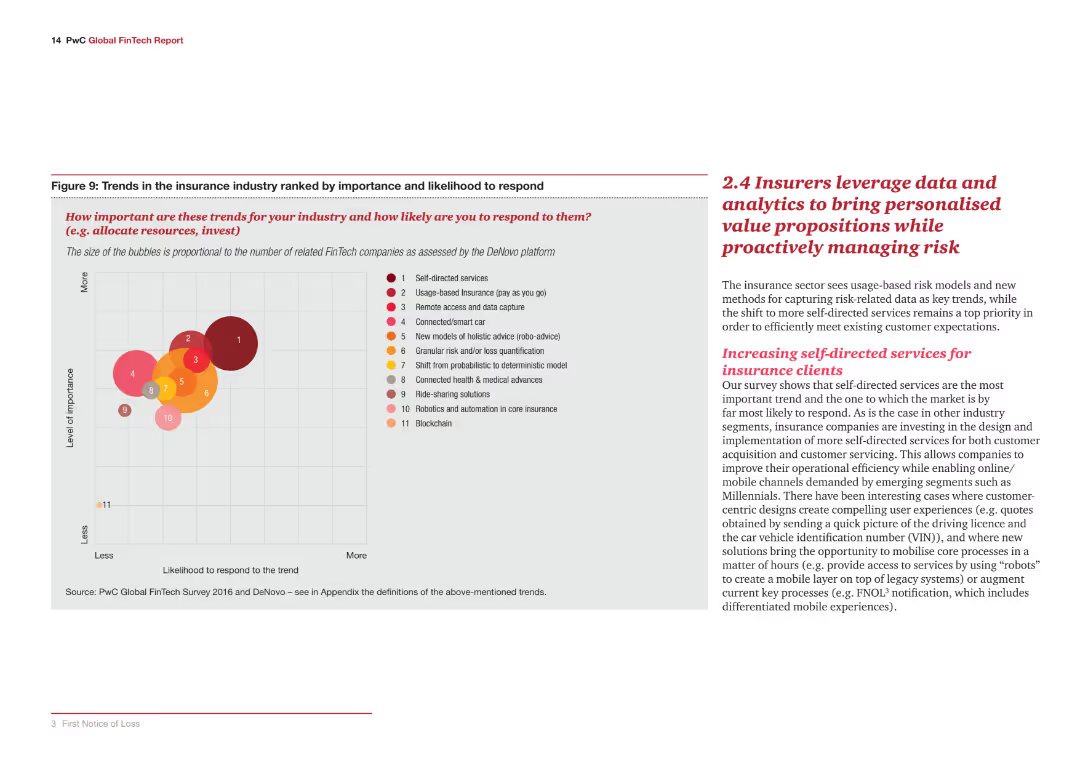
The slide has a column chart and text. The chart depicts familiarity with blockchain technology among respondents.
Technology and Digital Transformation
Financial Services
The slide explores blockchain technology, its potential impact, and the level of familiarity among industry participants.
Blockchain, technology, trends, familiarity, financial services
Mixed Chart
PwC/Strategy&
Saved
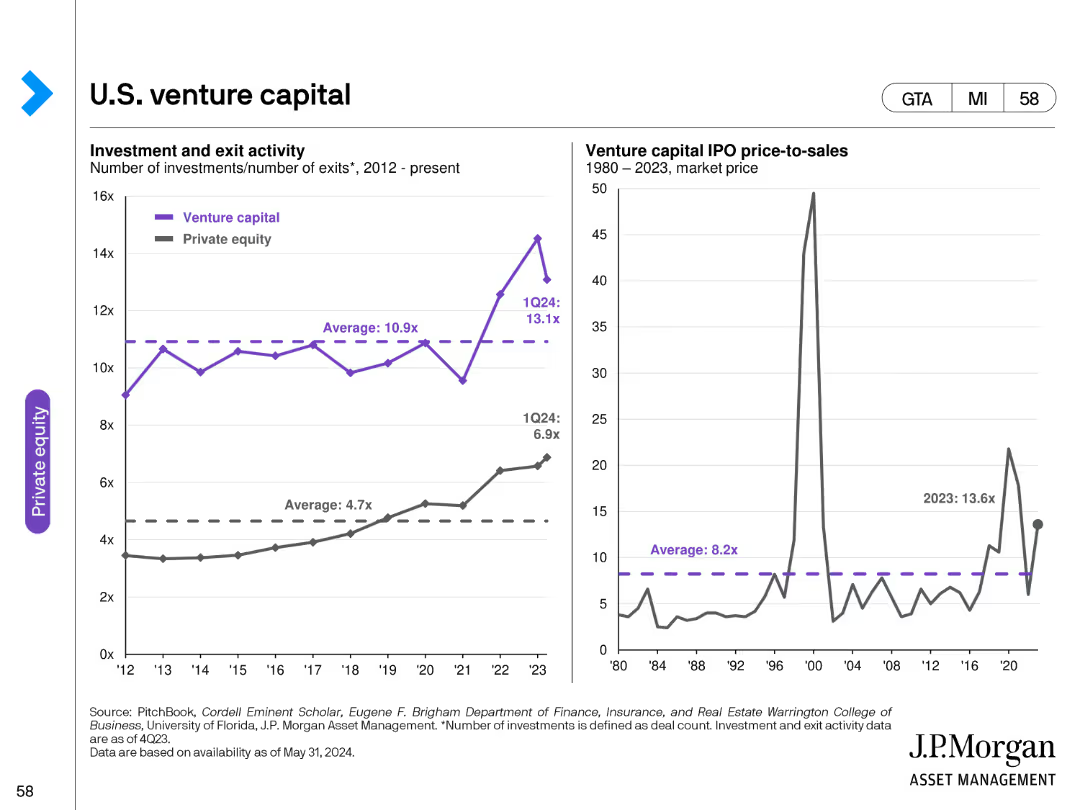
The slide features two line charts: one showing venture capital investment and exit activity, and the other depicting IPO price-to-sales ratios over time.
Investment Analysis
Financial Services
It provides a detailed analysis of U.S. venture capital activities, highlighting investment and exit trends as well as IPO price-to-sales ratios.
venture capital, U.S., investments, exits, IPO, price-to-sales, trends, financial, data analysis
Multiple Chart
JP Morgan
Saved
The slide features a left panel with text about autonomy at work and a right panel with a horizontal bar chart depicting regional differences in providing autonomy to employees.
Human Resources and Talent Management
Professional Services
The slide discusses the importance of workplace autonomy, highlighting survey data on regional disparities in how much freedom employees are given to control their work and make decisions.
Workplace autonomy, employee freedom, regional disparities, survey data, control
Mixed Chart
PwC/Strategy&
Saved
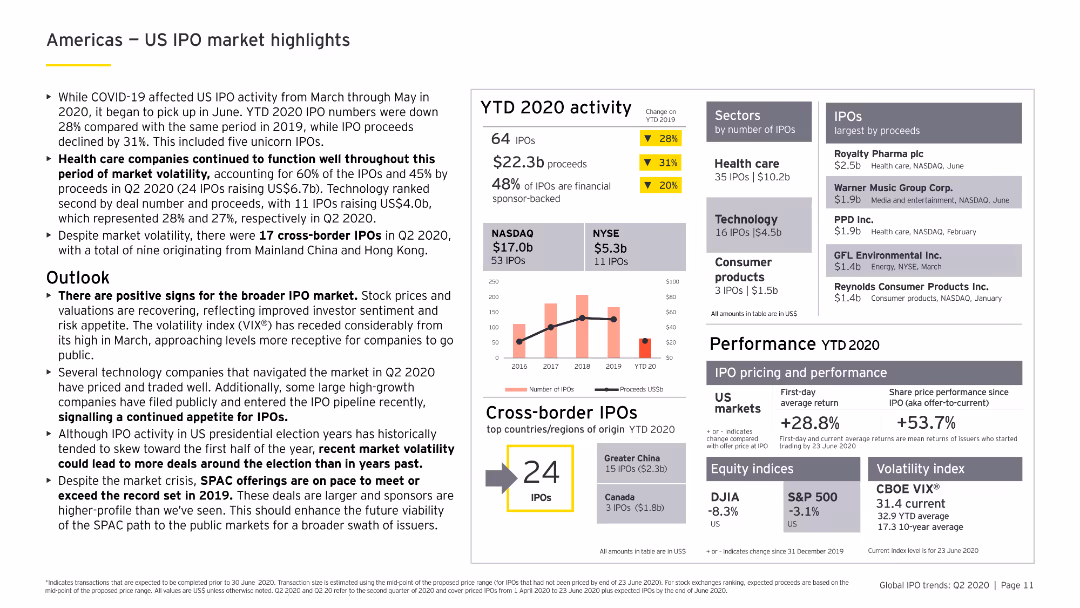
Includes column charts and bar charts showing YTD 2020 IPO activity in the US, sector analysis, and cross-border IPO data, with a focus on health care and technology.
Market Analysis and Trends
Financial Services
Reviews the US IPO market's performance in 2020, focusing on trends and insights from the health care and technology sectors, along with cross-border IPO activities.
US IPO, health care, technology, cross-border, YTD 2020
Mixed Chart
EY
Saved
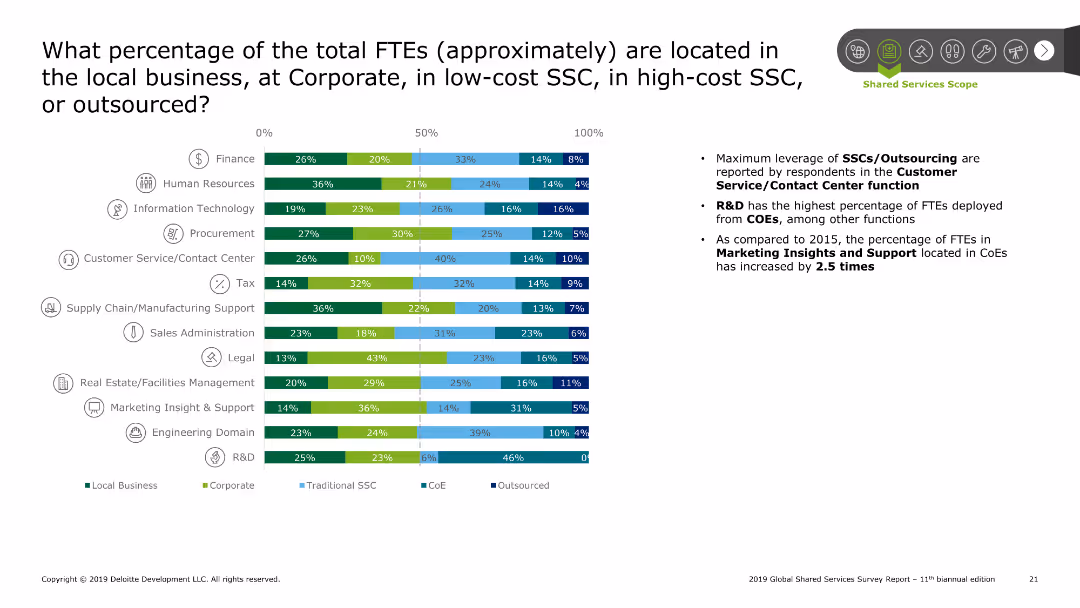
Bar chart showing the percentage of FTEs located across different settings (local, corporate, SSC, CoE, outsourced) for various functions. Summary points on the right discuss trends and findings.
Performance Metrics and KPIs
Professional Services
The slide analyzes the percentage of FTEs distributed across local business, corporate, SSCs, and outsourcing. The bar chart breaks down this data by function, highlighting significant leverage of SSCs/outsourcing in customer service and R&D. Summary points discuss the increase in FTEs located in CoEs compared to 2015.
SSC, FTE location, corporate, local, outsourcing
Mixed Chart
Deloitte
Saved
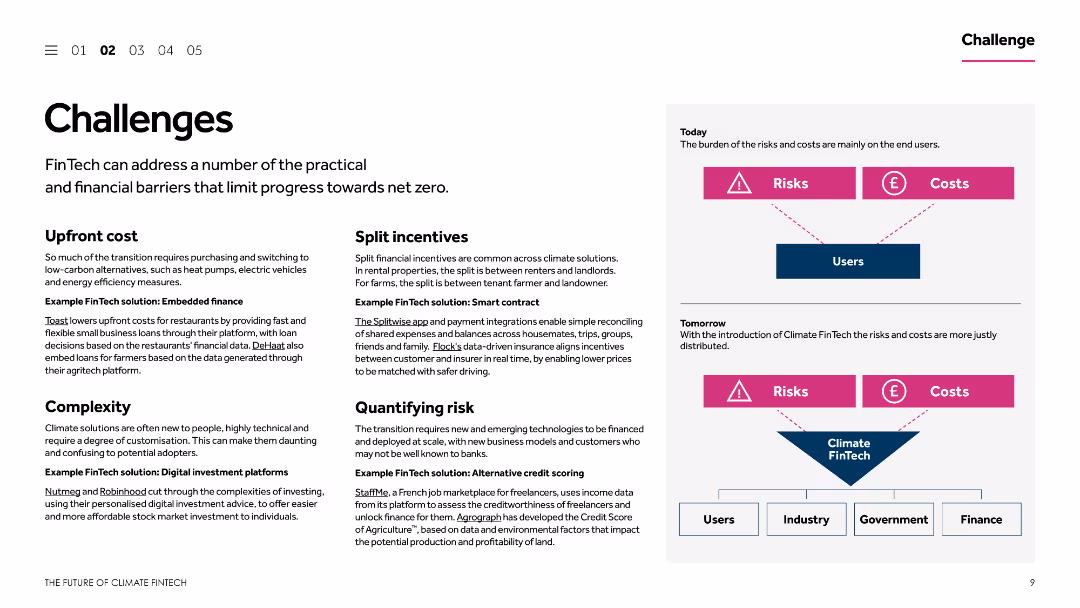
The slide is divided into multiple sections, each addressing different challenges and corresponding FinTech solutions. It includes textual descriptions and simple diagrams to explain concepts like upfront costs, split incentives, and quantifying risk.
Operational Efficiency
Financial Services
This slide outlines various challenges that limit progress towards net zero in the context of FinTech. It provides examples of FinTech solutions to address issues like upfront costs, split incentives, complexity, and risk quantification, aiming to enhance operational efficiency.
FinTech solutions, net zero, upfront costs, split incentives, risk quantification
Diagram
Barclays
Saved
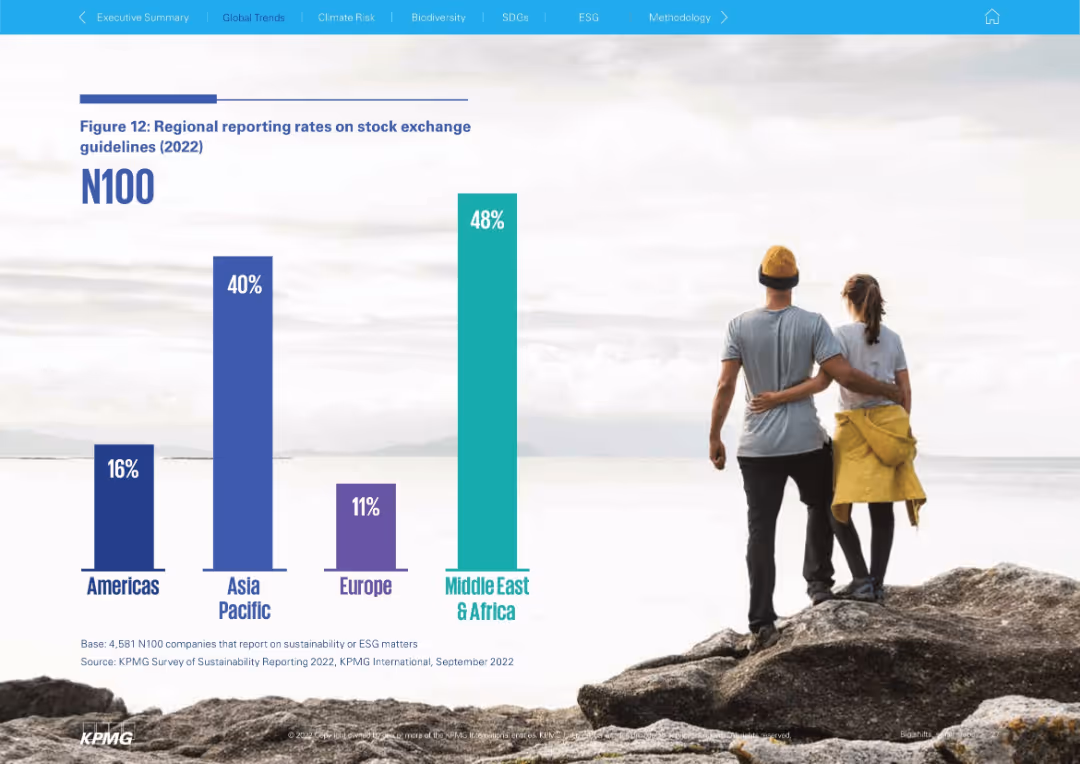
Full-screen vertical bar chart with minimal text and a photo of a couple on a rock background
Regulatory and Compliance
Professional Services
Provides a 2022 regional breakdown of N100 reporting rates based on stock exchange guidelines. Middle East & Africa leads at 48%, followed by Asia Pacific (40%), while Europe and the Americas lag behind.
ESG compliance, stock exchange, N100, Middle East, Asia Pacific, sustainability standards
Single Chart
KPMG
Saved
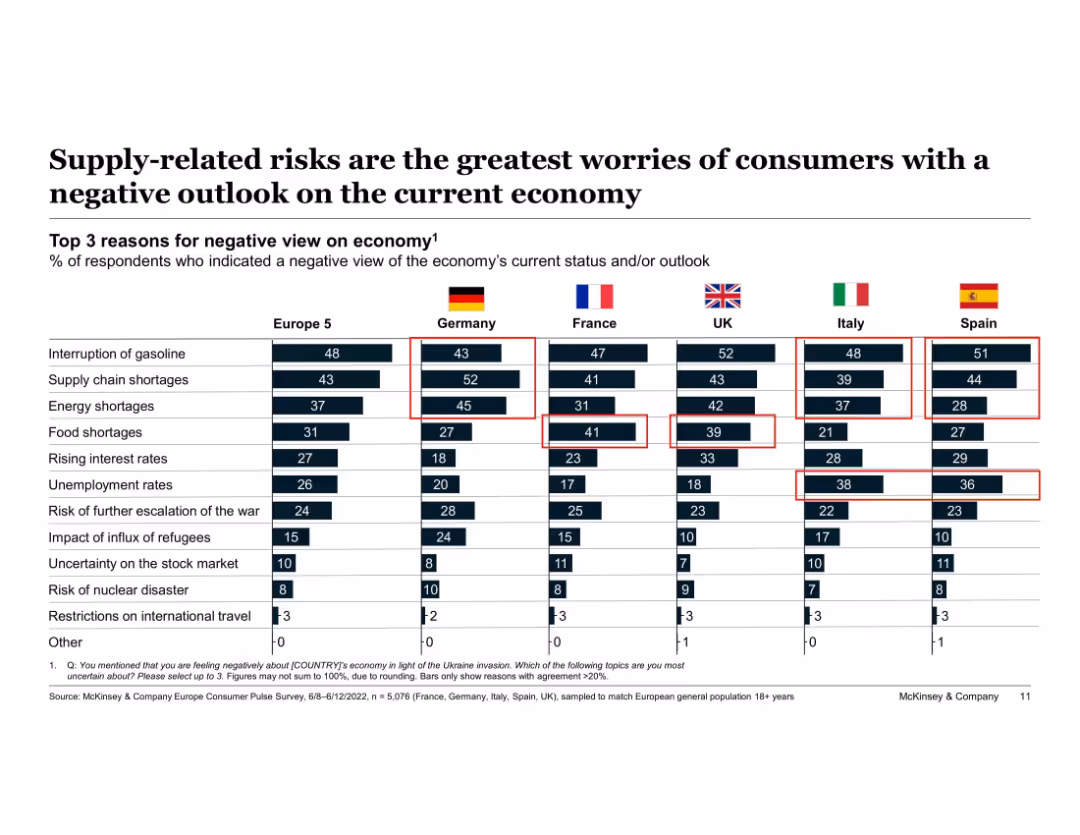
Matrix table of top reasons for economic pessimism across European countries. Red boxes highlight key concerns.
Risk Assessment and Management
Consumer Goods
The slide highlights key supply-side concerns driving negative economic outlooks among European consumers. Gasoline interruptions, supply chain issues, and food/energy shortages are prominent across countries, particularly in Germany, Spain, and the UK.
supply chain, food shortages, gasoline interruption, risk perception, economic pessimism, Europe, consumer anxiety
Single Chart
McKinsey
Saved
Displays maps of Africa from 2015-2019 with data points indicating female participation in the program.
Strategic Planning
Government & Public Sector
Tracks the change in country representation and female participation in the program over five years.
participation, trends, Africa, women, analysis
Graphic
Accenture
Saved
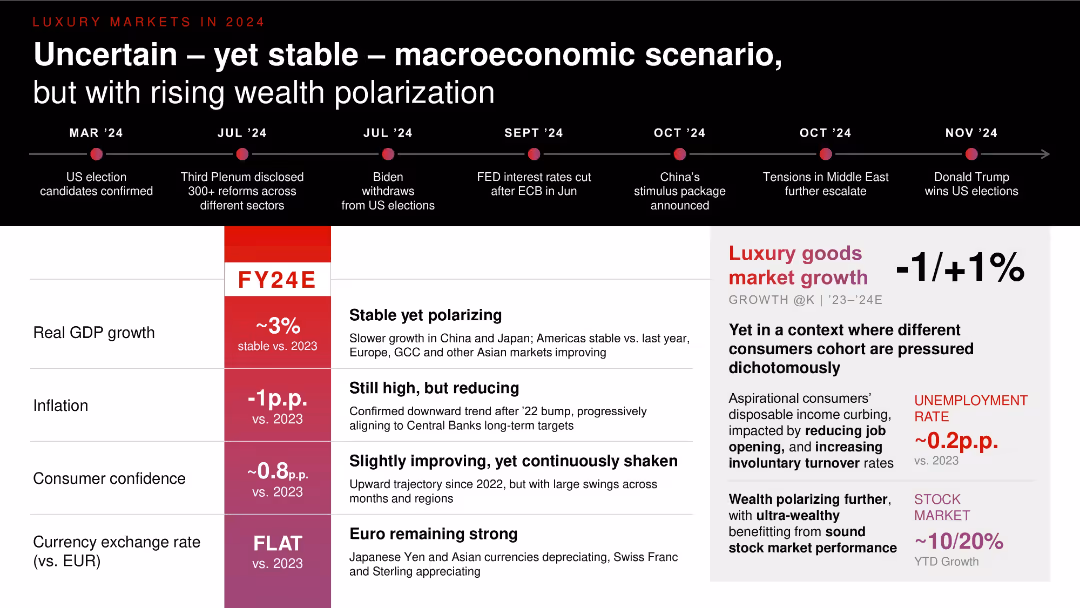
Timeline on top with economic projections for FY24E in red columns. Right panel outlines market growth forecasts; left table presents GDP, inflation, consumer confidence, and FX rates.
Strategic Planning
Consumer Goods
Presents a 2024 macroeconomic forecast relevant to luxury markets. Despite uncertainty (e.g., elections, interest rate changes), GDP remains stable. Inflation is declining, while wealth polarization intensifies. Luxury goods growth remains flat (-1% to +1%) amid varying consumer sentiment and employment trends.
GDP, inflation, macroeconomics, consumer confidence, luxury growth, 2024 forecast
Table
Bain
Saved
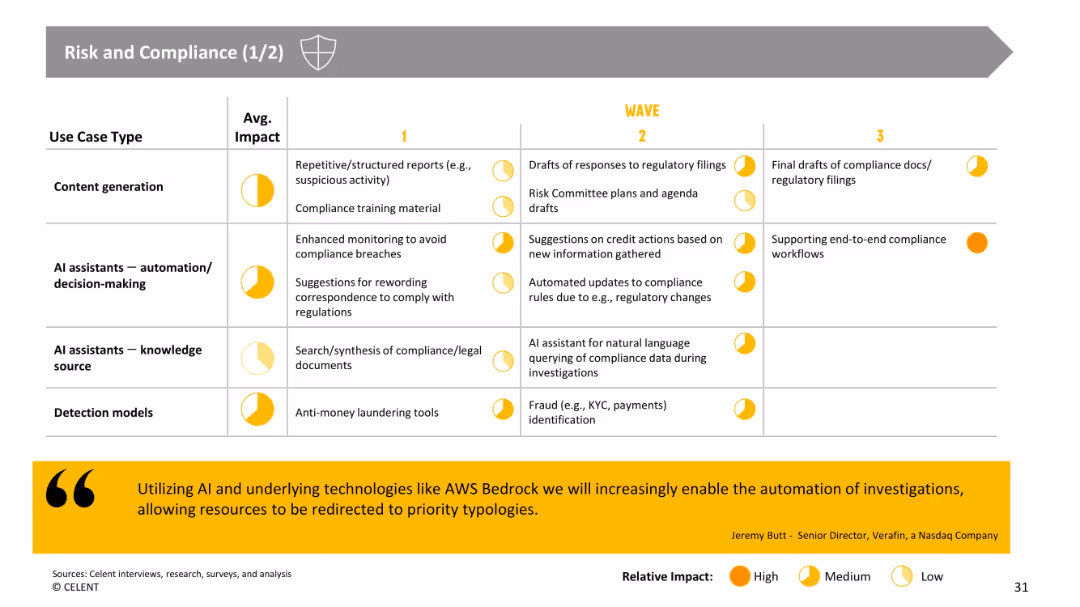
Table continues wave-based layout. Focuses on compliance and regulatory use cases, including content drafting, AI monitoring, and fraud detection. Yellow quote box at bottom highlights impact of AI automation.
Regulatory and Compliance
Financial Services
Describes AI-enabled improvements in compliance tasks—document preparation, breach detection, and regulatory response. Highlights future wave applications in full workflow automation. Reinforces the growing potential of GenAI in high-risk, rules-based domains.
compliance, regulation, automation, fraud detection, GenAI, document drafting, monitoring
Single Chart
Oliver Wyman
Saved
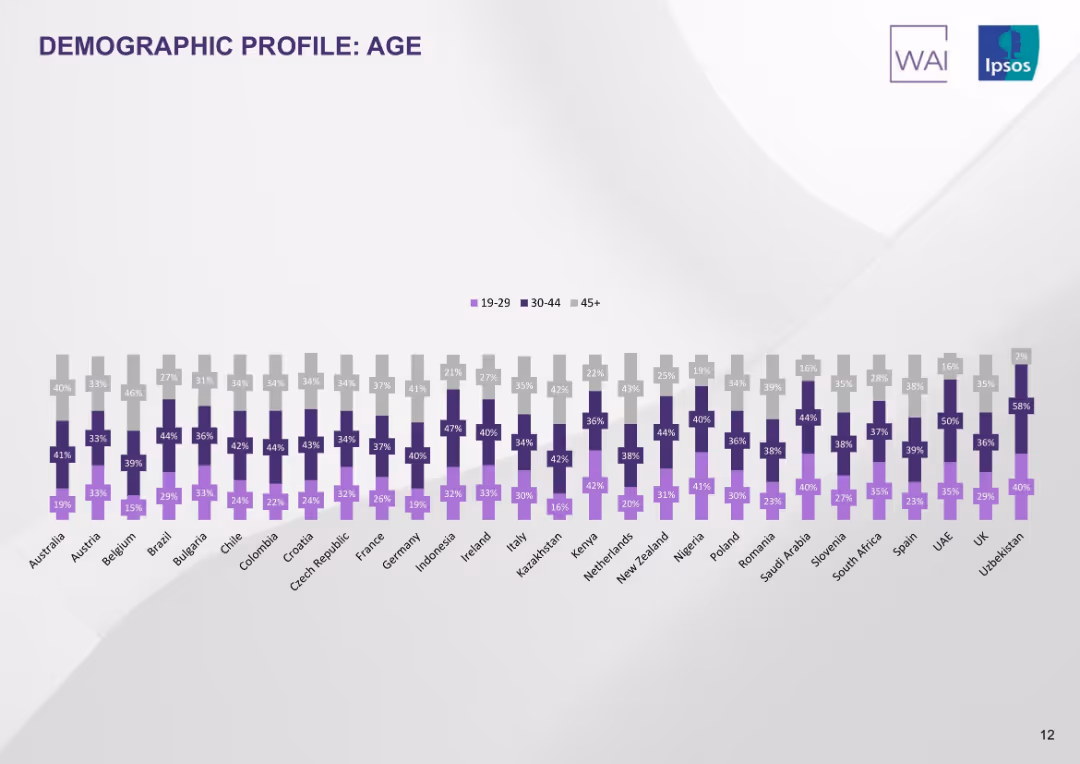
Triple bar chart per country showing proportions of age groups (19–29, 30–44, 45+). Uniform color scheme per age band.
Customer and Market Segmentation
Healthcare & Pharmaceuticals
This slide illustrates the age distribution of survey respondents across countries. Each country shows variation in age group proportions, revealing demographic representation in the study sample.
age profile, demographics, age distribution, respondent base, countries, tobacco users, Ipsos, segmentation
Single Chart
IPSOS
Saved
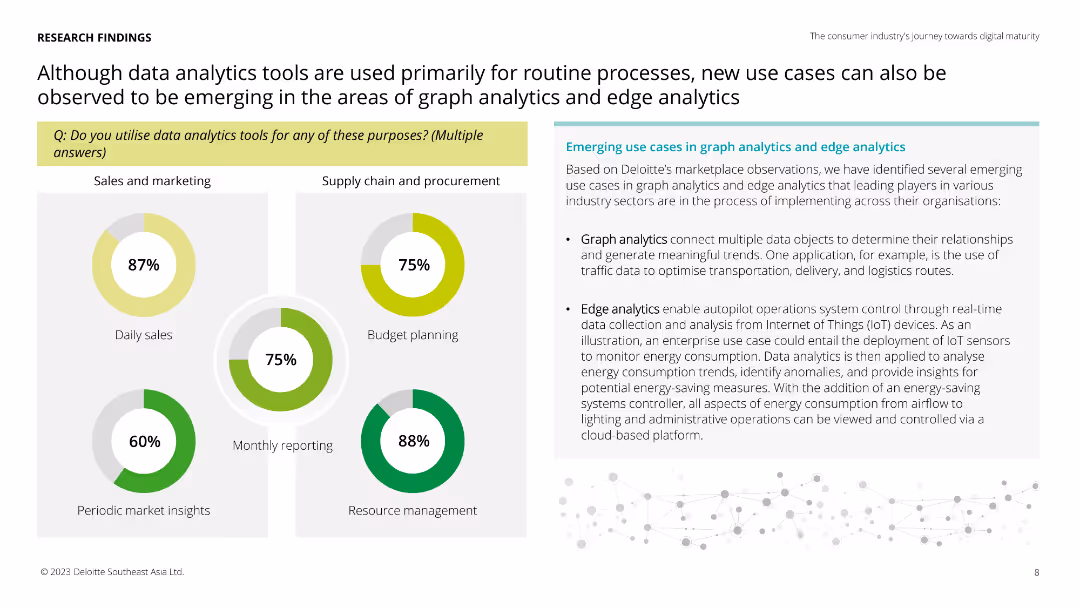
Circular charts showing the usage of data analytics tools for various purposes and descriptions of emerging use cases in graph analytics and edge analytics.
Technology and Digital Transformation
Technology & Software
The slide discusses new use cases in graph and edge analytics, highlighting their applications in sales, marketing, and supply chain management. Useful for identifying innovative uses of data analytics technologies.
graph analytics, edge analytics, use cases, applications
Multiple Chart
Deloitte
Saved
The slide features a column chart on the left side, text with icons in the middle, and a list of priorities on the right. The background shows shipping containers.
Market Analysis and Trends
Professional Services
It compares 3PE maturity across industries, expectations versus surprises in the 2022 study, and top priorities for 2022. It is used for highlighting industry trends.
Industry trends, procurement, priorities, maturity, expectations, surprises, collaboration, resilience
Multiple Chart
Kearney
Saved
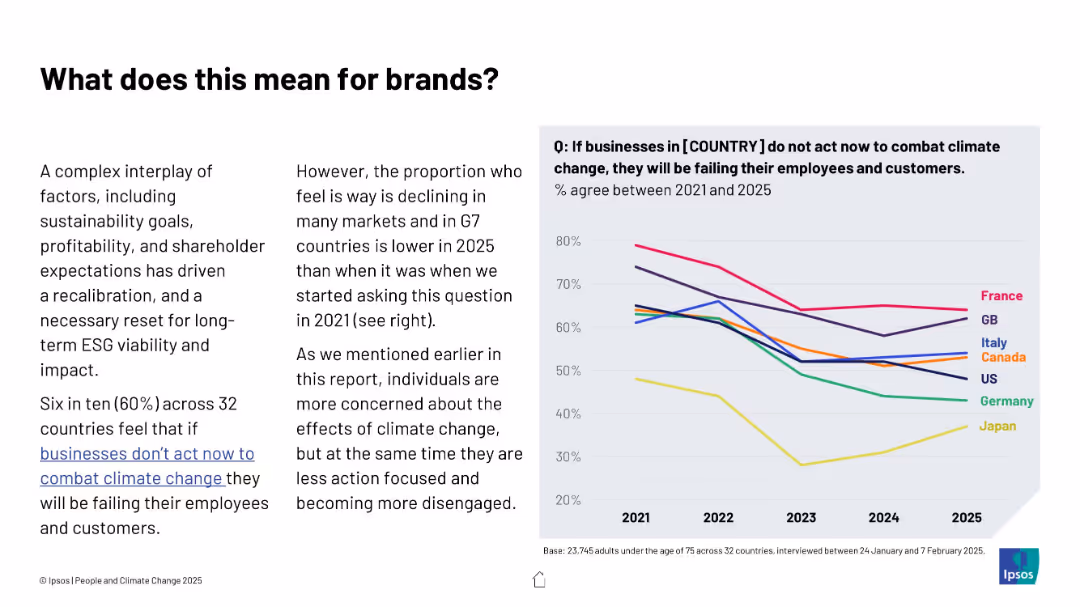
Text and line graph combination; left features contextual explanation, right shows trend lines for multiple countries from 2021 to 2025
Strategic Planning
Professional Services
The slide explores declining belief in corporate responsibility to combat climate change across G7 nations. A downward trend suggests companies may face lower public pressure, despite ongoing environmental challenges.
ESG, brands, climate responsibility, trends, business impact, public opinion, Ipsos, G7, consumer expectations
Mixed Chart
IPSOS
Saved
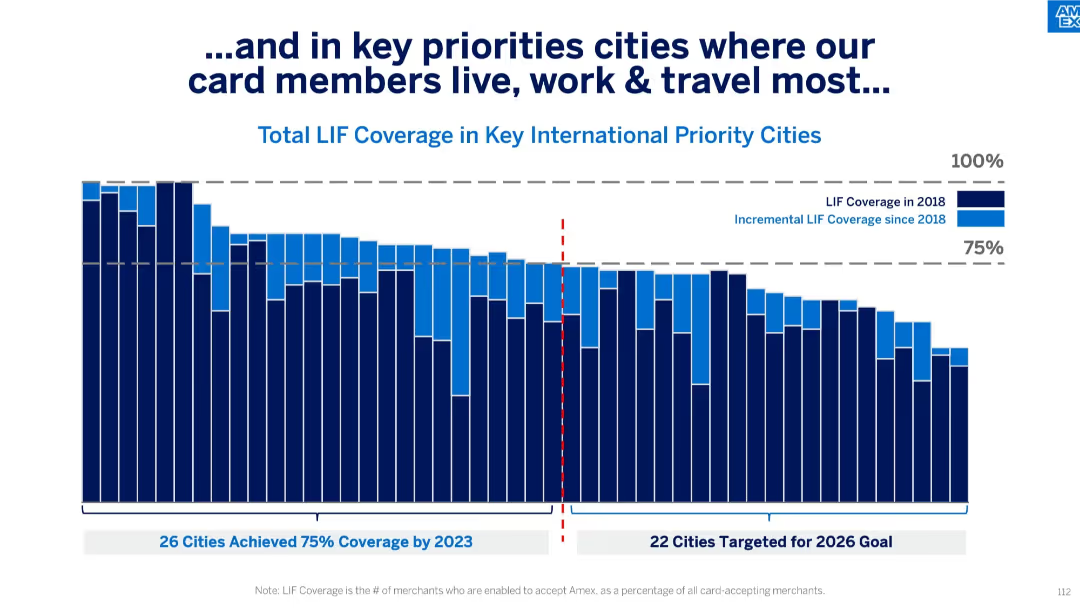
Vertical stacked bar chart split by year (2018 and incremental growth), segmented by 75% threshold and future target cities; uses bold blue tones and annotations.
Performance Metrics and KPIs
Financial Services
The slide illustrates LIF (Locations in Force) coverage across international cities where card members are most active. It differentiates between coverage levels as of 2018 and the progress made since then, showing how many cities have surpassed the 75% target and setting goals for 2026.
LIF coverage, cities, card members, merchant acceptance, 2023 goal, 2026 target, incremental growth, Amex, bar chart
Single Chart
McKinsey
Saved
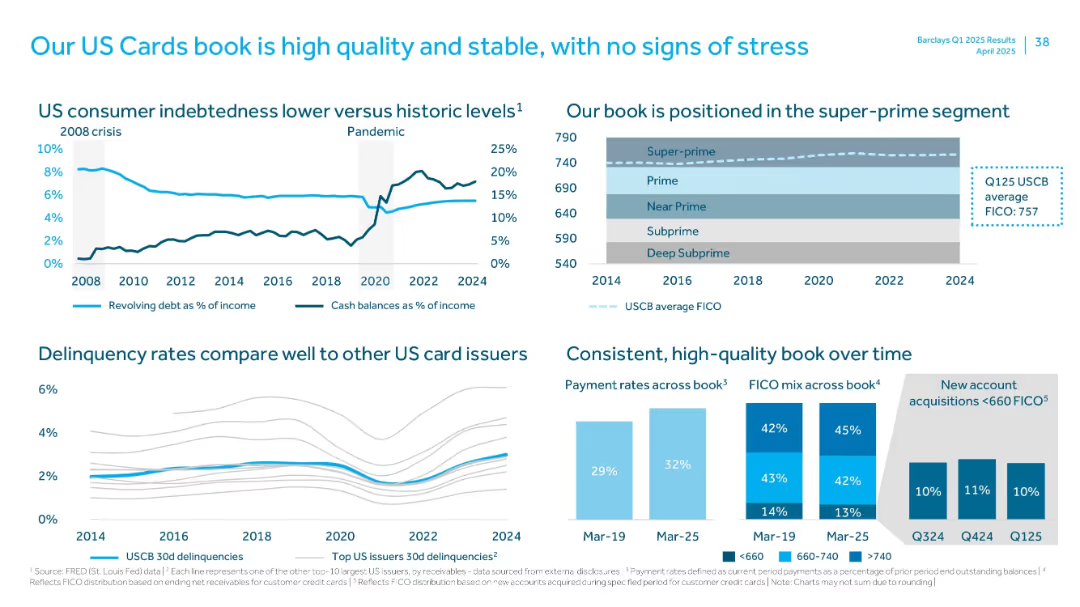
Multi-panel layout with line charts, bar graphs, and a FICO score distribution visual
Customer and Market Segmentation
Financial Services
Highlights the strength of the US cards portfolio, with high FICO score concentration, low delinquency rates, favorable payment rates, and a comparative view versus other issuers, indicating credit quality and stability.
FICO, delinquency, payment rate, super-prime, US cards
Multiple Chart
Barclays
Saved
The slide includes text explanations and a column chart showing areas where Gen Zs and Millennials feel they can influence their organization. The layout is balanced with text on the left and charts on the right.
Human Resources and Talent Management
Education & Training
The slide highlights the importance of values in career decisions for Gen Zs and Millennials, detailing areas where they feel empowered to influence organizational changes, including social issues, DEI, personal development, and sustainability efforts.
Career decisions, values, empowerment, Gen Z, Millennials, change
Mixed Chart
Deloitte
Saved
The slide contains four column charts comparing MSCI World and Net IRR across different investment types: Corporate Equity, Corporate Credit, Real Estate, and Open Architecture Private Assets. Each chart has two vertical bars with percentages, against a white and blue background.
Financial Performance
Financial Services
The slide presents a performance comparison of various investment types, highlighting their long-term track record and returns. This can be used for illustrating investment opportunities and analyzing alternative asset management strategies.
MSCI, IRR, Corporate Equity, Real Estate, Performance
Multiple Chart
Goldman Sachs
Saved
Comparative layout with two line graphs, contrasting property sales with GDP growth and manufacturing PMI with business confidence. Heavy on data and annotations.
Market Analysis and Trends
Industrial & Manufacturing
Presents China's economic outlook by examining property sector trends and manufacturing confidence, relevant for market analysis and investment decisions.
China Economy, Property Sales, GDP Growth, Manufacturing PMI, Market Analysis, Investment Decision
Multiple Chart
Citigroup
Saved
This slide presents a balance sheet summary with segmented bars representing different asset and liability categories, alongside key highlights in text for clarity.
Financial Performance
Financial Services
Provides a snapshot of the bank’s financial status as of September 30, 2023, detailing assets, liabilities, and key financial ratios, suitable for financial reporting and analysis.
balance sheet, financial, assets, liabilities, reporting, analysis, status, ratios, summary, categories
Multiple Chart
Deutsche Bank
Saved
The slide has multiple column charts displaying growth in customer banking and business banking, with annotations for specific years and percentage changes.
Performance Metrics and KPIs
Financial Services
Useful for illustrating growth trends in customer and business banking segments, demonstrating an increase in deposits and market share.
growth, banking, customer, business, deposits, market share, performance, analysis, retail, segmentation
Multiple Chart
JP Morgan
Saved
Displays bar charts showing how managers allocate their work time across various tasks.
Operational Efficiency
Professional Services
Analyzes time management among managers, highlighting inefficiencies and potential areas for improvement.
time management, task allocation, efficiency, work priorities, managerial duties
Multiple Chart
BCG
Saved
The slide includes detailed financial data presented as table and a list. Blue highlights draw attention to positive figures, and gray to negative ones. A side panel adds context with bullet points summarizing base fees, performance fees, and other financial insights.
Financial Performance
Financial Services
Summarizes the financial results of Macquarie Asset Management, including base and performance fees, and provides an analysis of net operating income and equity under management, pertinent for financial review and strategy planning.
asset management, financial results, base fees, performance fees, operating income, equity management
Table
Goldman Sachs
Saved
Previous
Next
If nothing, comes up, please save your slides first
Create a FREE account to continue browsing
Receive Instant Access to 1,000+ slides from companies like McKinsey, Google, and Goldman Sachs
First Name
Last Name
Email
Password
I agree to all
Terms & Privacy Policy
Thank you! Your submission has been received!
Oops! Something went wrong while submitting the form.
Have an account?
Sign in
Column Chart
Heatmap
Chevron
Org Chart
Infographic
Callouts
Timeline
List
Graphic
Picture
Process Flow
Diagram
Paragraph
Map
Table
Framework
Subtitle
Takeaway Box
Icon
Other Chart
Radar Chart
Waterfall Chart
Mekko Chart
Pie Chart
Scatter Plot
Line Chart
Bar chart
Bullet points