My Account
My Slides
Search by Category
Templates
View All Templates
Download Template Slides
Leave Feedback
Login
Logout
Get Started
Browse all Slides
Browse all Slides
Create a FREE Account
Instant access to 1,000+ real slides from top companies like McKinsey, BCG, Goldman Sachs, Google and many more!
First Name
Last Name
Email
Password
I agree to all
Terms & Privacy Policy
Thank you! Your submission has been received!
Oops! Something went wrong while submitting the form.
Have an account?
Sign in
Saved Slides
Contains bar graphs showing the levelized cost of energy for solar, onshore and offshore wind, and nuclear power with and without tax credits, illustrating significant cost reductions due to fiscal incentives.
Market Analysis and Trends
Energy & Utilities
Examines how full application of tax credits could reduce the costs associated with generating energy from various renewable sources, emphasizing the financial benefits of government incentives.
renewable energy, cost reduction, tax credits, solar, wind, nuclear
Single Chart
BCG
Saved
Consists of colored column charts representing currency distribution across different divisions, with clear labeling and segmented color coding.
Financial Performance
Financial Services
This slide provides an overview of the currency mix in Q4 2023 across different banking divisions, highlighting exposure to various currencies.
currency analysis, financial exposure, Q4 2023, divisional revenues, banking
Multiple Chart
Deutsche Bank
Saved
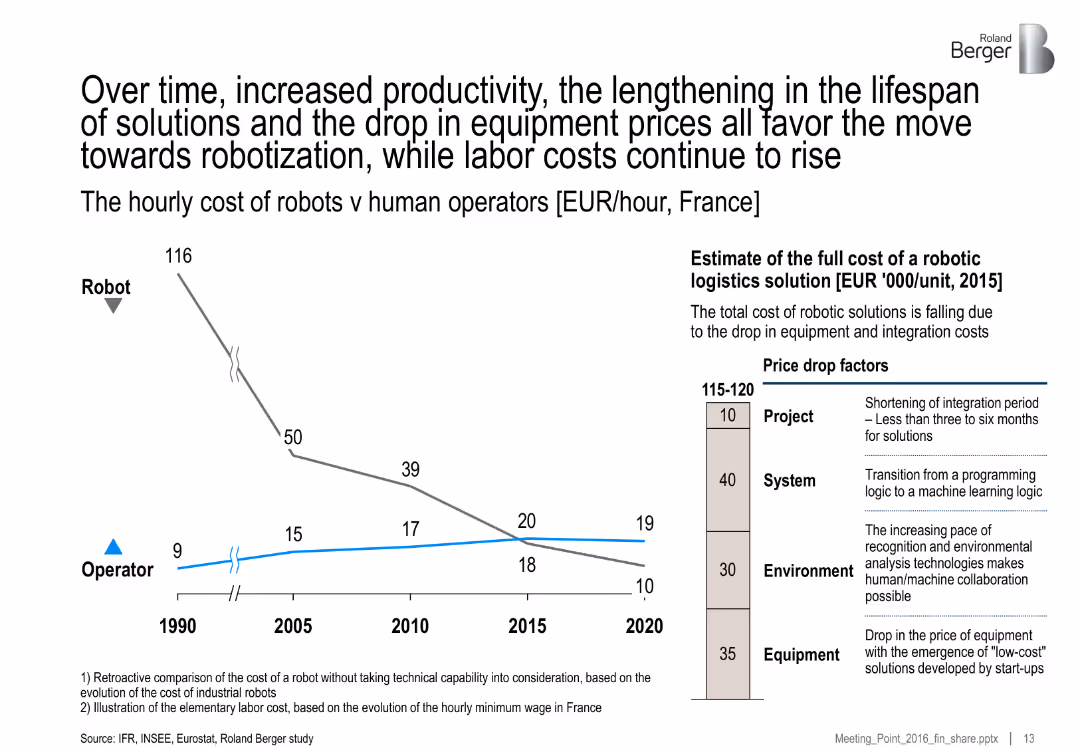
Dual-pane layout with left line graph comparing hourly costs over time and right-hand cost breakdown and contributing factors in a vertical bar. Clean, corporate design with icons and annotations.
Technology and Digital Transformation
Industrial & Manufacturing
The slide illustrates the declining hourly cost of robots compared to rising human labor costs in France from 1990 to 2020, making robotization increasingly economically favorable. It includes a breakdown of cost reduction factors in robotic logistics solutions, such as system improvements and equipment price drops.
robotization, labor cost, automation, logistics, France, industrial robots, system integration, machine learning, cost comparison
Multiple Chart
Roland Berger
Saved
The slide includes a pie chart and a list of areas of expertise in market and opinion research.
Strategic Planning
Professional Services
The slide highlights Ipsos' comprehensive offerings in market and opinion research across different sectors.
expertise, market research, opinion research, Ipsos, sectors, services
Single Chart
IPSOS
Saved
The visual complexity is moderate, presenting a bar chart and growth drivers in an informative and visually accessible manner. The layout is balanced between graphical data representation and explanatory text.
Technology and Digital Transformation
Industrial & Manufacturing
This slide illustrates the projected market growth of the global process automation industry and its concentration in key sectors. It highlights the structural growth drivers, providing a strategic outlook on the market for the audience.
Market growth, Process automation, Sector analysis, Growth drivers
Multiple Chart
LEK
Saved
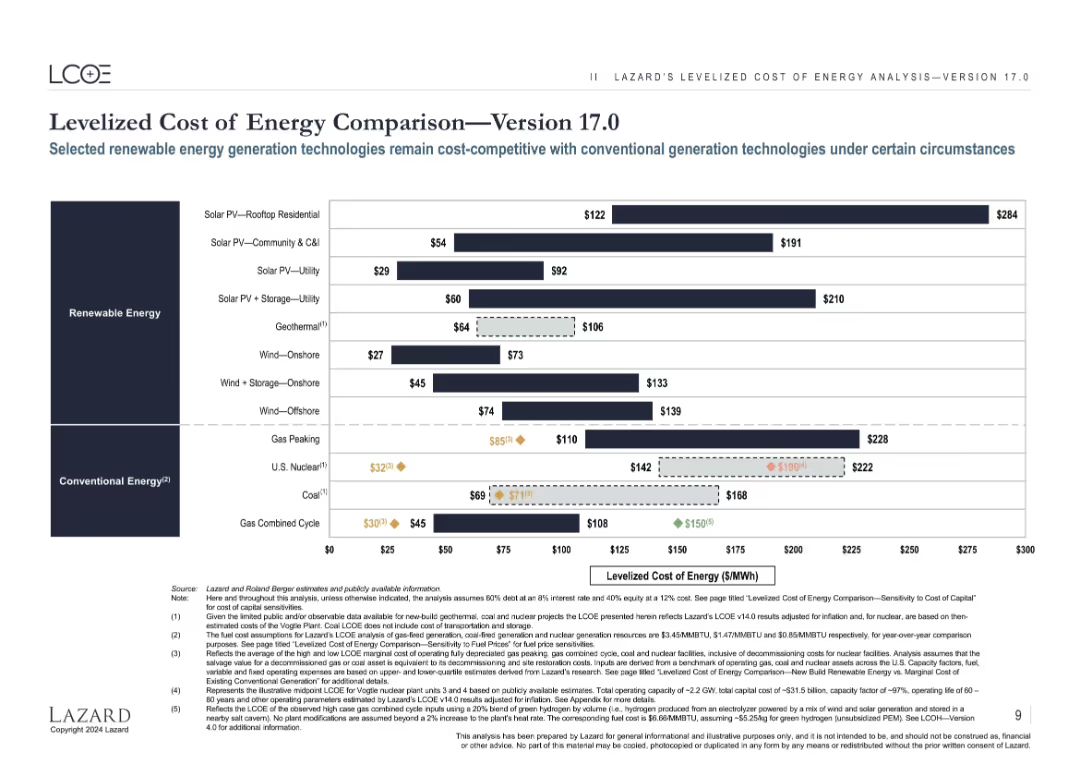
Horizontal bar chart comparing LCOE for various renewable and conventional energy sources; categorized into two vertical sections with color-coded bars.
Market Analysis and Trends
Energy & Utilities
This slide compares the Levelized Cost of Energy (LCOE) across energy sources, highlighting the cost competitiveness of renewables vs. fossil fuels under typical assumptions.
LCOE, renewable, solar, wind, nuclear, coal, gas, comparison, $/MWh, energy costs
Single Chart
Roland Berger
Saved
Includes a bar chart showing different taxes ranked by their likelihood of causing significant audit exposures. Accompanied by textual analysis and key takeaways.
Regulatory and Compliance
Financial Services
This slide presents potential tax exposure areas during audits in the financial services industry, emphasizing the high risk associated with specific taxes and the need for effective management and compliance strategies.
tax, audits, exposure, financial services, compliance, column chart
Mixed Chart
PwC/Strategy&
Saved
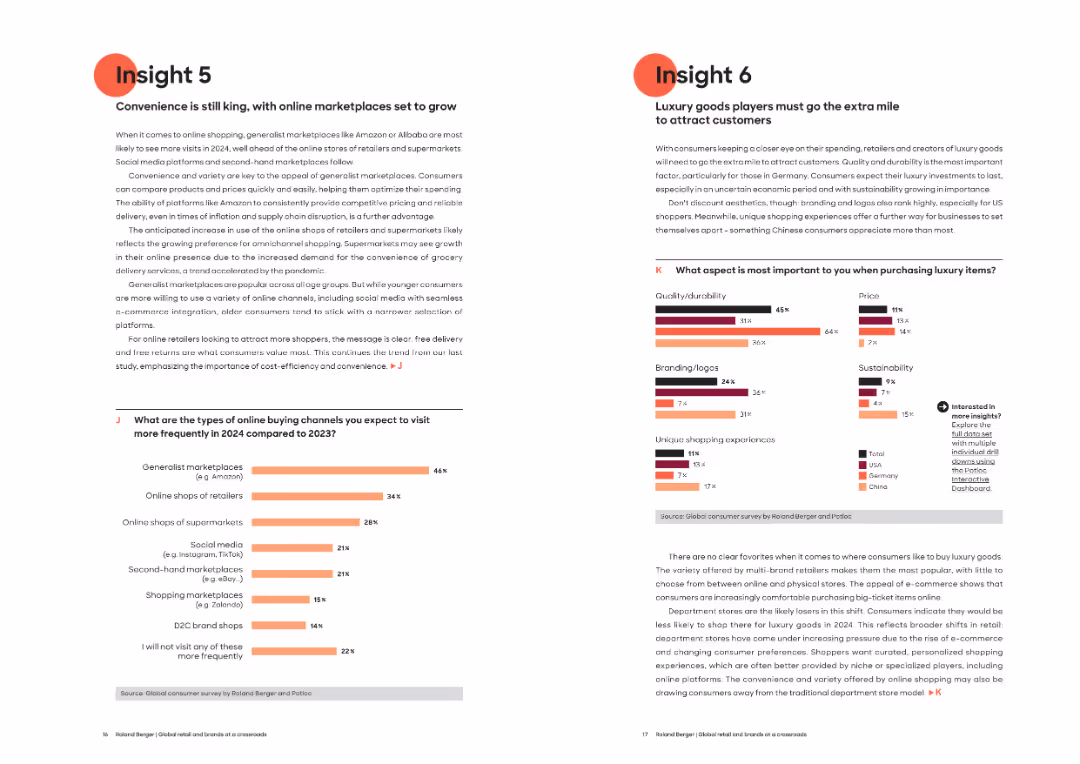
Two-column split slide, each side with a chart and a few paragraphs. Consistent use of red highlights and structured formatting for clarity.
Market Analysis and Trends
Retail & E-commerce
Insight 5 discusses the growing dominance of generalist marketplaces like Amazon for online shopping due to convenience and cost. Insight 6 focuses on luxury goods purchasing drivers, noting quality, sustainability, and unique experiences as critical factors.
Online marketplaces, luxury goods, consumer behavior, shopping trends, generalist platforms, branding, sustainability, price sensitivity
Multiple Chart
Roland Berger
Saved
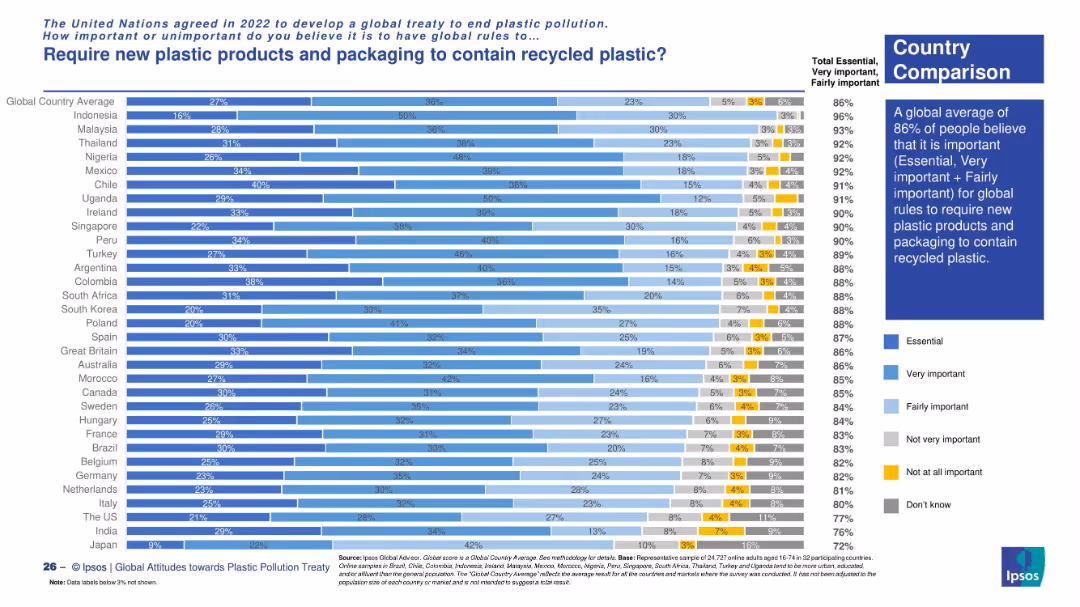
Vertical bar chart with country-level comparison. Bars are segmented by importance level using color gradients. Sidebar summarizes global average opinion and highlights key insights.
Market Analysis and Trends
Environmental Services & Sustainability
This slide displays a country-wise comparison of public support for requiring recycled plastic in new products. It highlights that a global average of 86% consider it important. Countries like Indonesia, Malaysia, and Nigeria show the strongest support for this regulation.
recycled plastic, packaging, consumer views, plastic regulation, sustainability, global treaty, Ipsos survey, country comparison, environmental concern
Mixed Chart
IPSOS
Saved
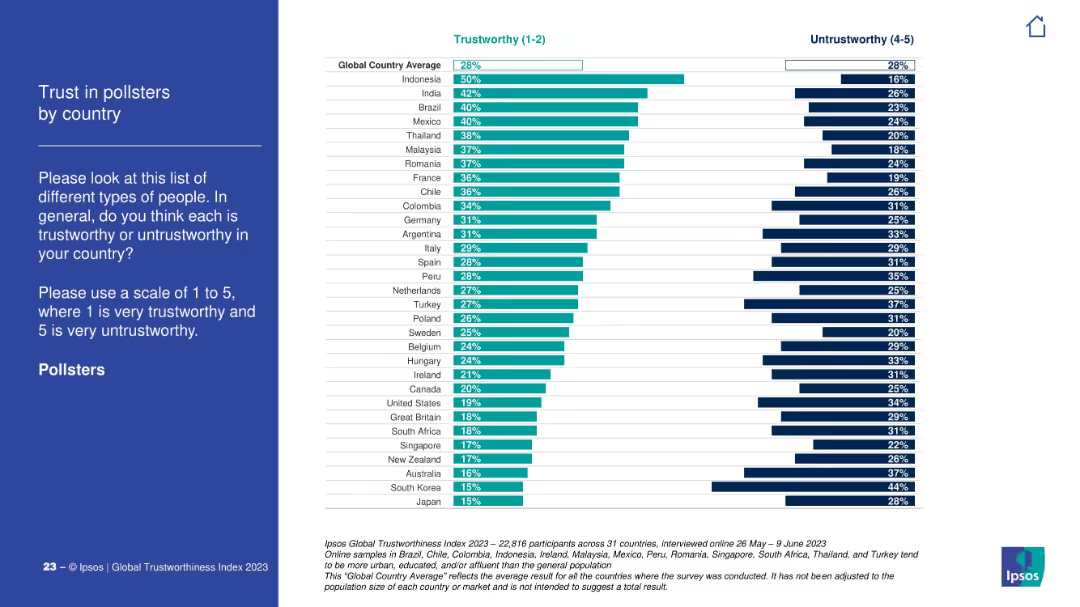
Left panel with title and description in white on blue. Right panel is a horizontal bar chart comparing "Trustworthy" vs. "Untrustworthy" by country.
Market Analysis and Trends
Media & Entertainment
The slide shows public trust levels in pollsters across countries based on Ipsos' 2023 global survey. It compares ratings on a 1–5 scale, highlighting notable disparities.
trust, pollsters, perception, global, country, Ipsos, bar chart, opinion, media, rating
Mixed Chart
IPSOS
Saved
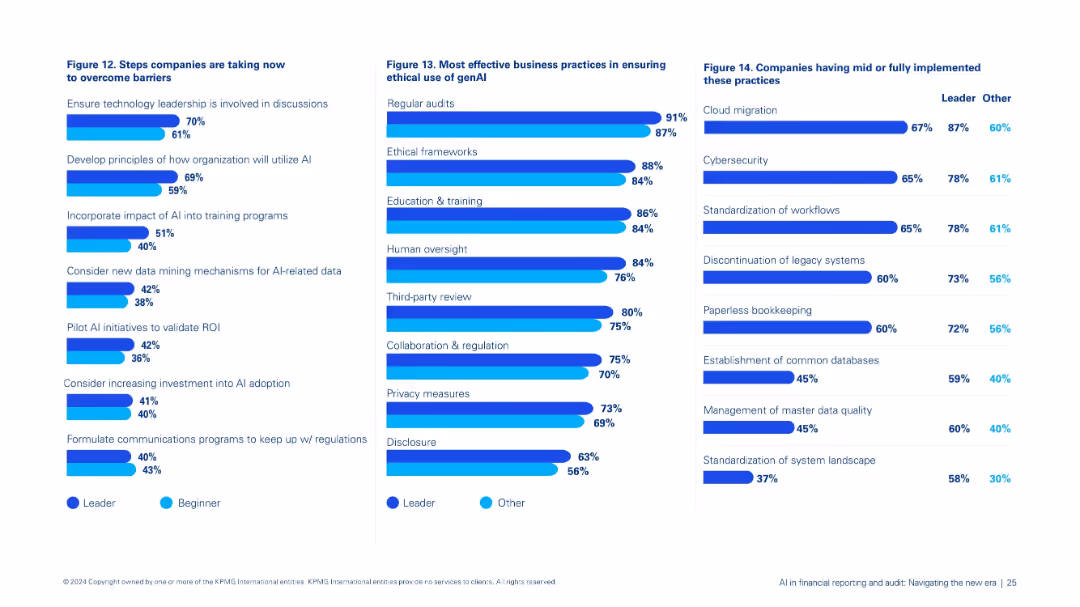
Three-pane layout: left shows Figure 12 on overcoming barriers, center Figure 13 on ethical genAI practices, right Figure 14 on implementation practices.
Strategic Planning
Financial Services
Consolidates steps organizations are taking to advance AI integration: leadership involvement, ethical safeguards, pilot testing, and implementation of best practices in data and system management.
AI strategy, ethics, genAI, leadership, implementation, training, data governance
Multiple Chart
KPMG
Saved
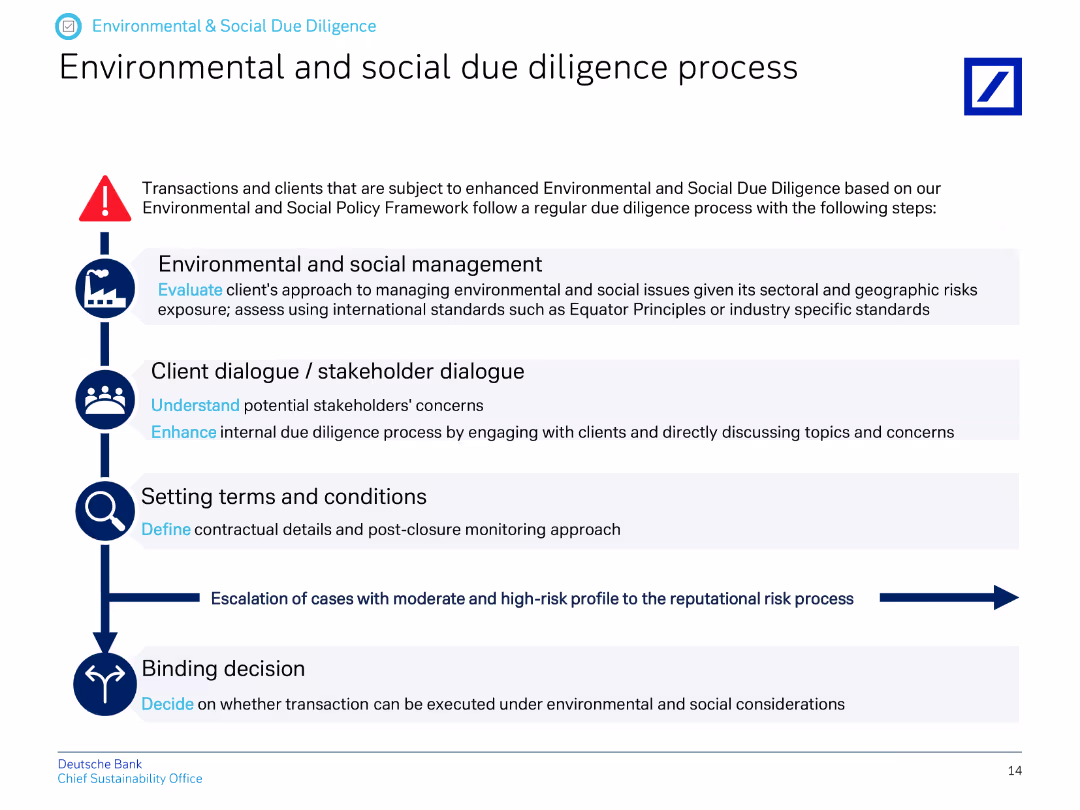
The slide presents a vertical flow chart outlining the steps in the environmental and social due diligence process.
Regulatory and Compliance
Financial Services
This slide explains the process for environmental and social due diligence, detailing steps from management to stakeholder dialogue, setting terms, and making binding decisions.
due diligence, environmental process, social process, stakeholder dialogue, terms and conditions, decision-making
Vertical Flow
Deutsche Bank
Saved
The slide includes two doughnut charts comparing Asia’s investment values for 2012 and 2016, highlighting the rise in China and Southeast Asia.
Market Analysis and Trends
Financial Services
Discusses the rapid increase in investment values within Asia, particularly in China and Southeast Asia, over the four-year period.
Asia, Investment, China, Southeast Asia, Trends
Multiple Chart
Kearney
Saved
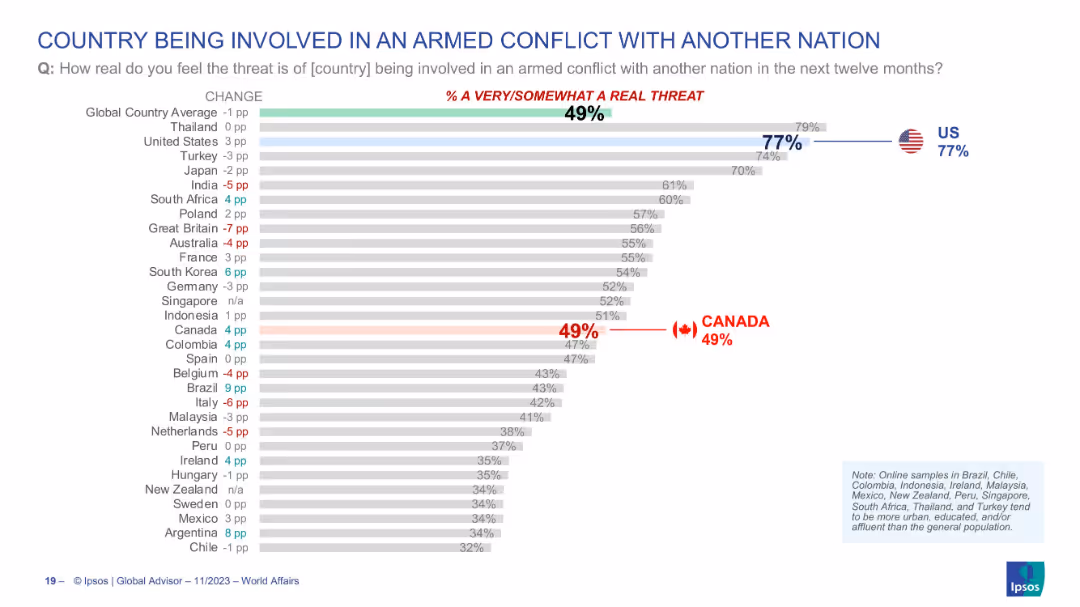
Similar bar chart format; countries ranked by perceived threat of armed conflict with another nation; US and Canada highlighted; change in % noted on the left.
Risk Assessment and Management
Government & Public Sector
This chart presents public sentiment regarding the risk of their country being involved in an armed conflict with another nation in the next twelve months. The global average is 49%, with the US at 77% and Canada at 49%. It reflects national security concerns and geopolitical tensions perceived by the population.
armed conflict, war, perception, international risk, global security, Ipsos, survey, USA, Canada, opinion
Single Chart
IPSOS
Saved
A line chart depicting the fluctuating contribution of social media to company performance, with annotations for significant changes.
Performance Metrics and KPIs
Professional Services
Evaluates the impact of social media on company performance, essential for performance tracking in consumer services and retail.
social media, performance, consumer services, retail, impact, fluctuation, evaluation, tracking, change, contribution
Mixed Chart
Deloitte
Saved
The slide features a two-tiered column chart showing average loans by client segment over three years, with text sections highlighting strategies.
Risk Assessment and Management
Financial Services
It analyzes loan performance segmented by client type, showcasing risk management and business growth strategies in financial services.
Risk Management, Loan Performance, Client Segments, Business Growth, Strategy, Financial Services
Mixed Chart
JP Morgan
Saved
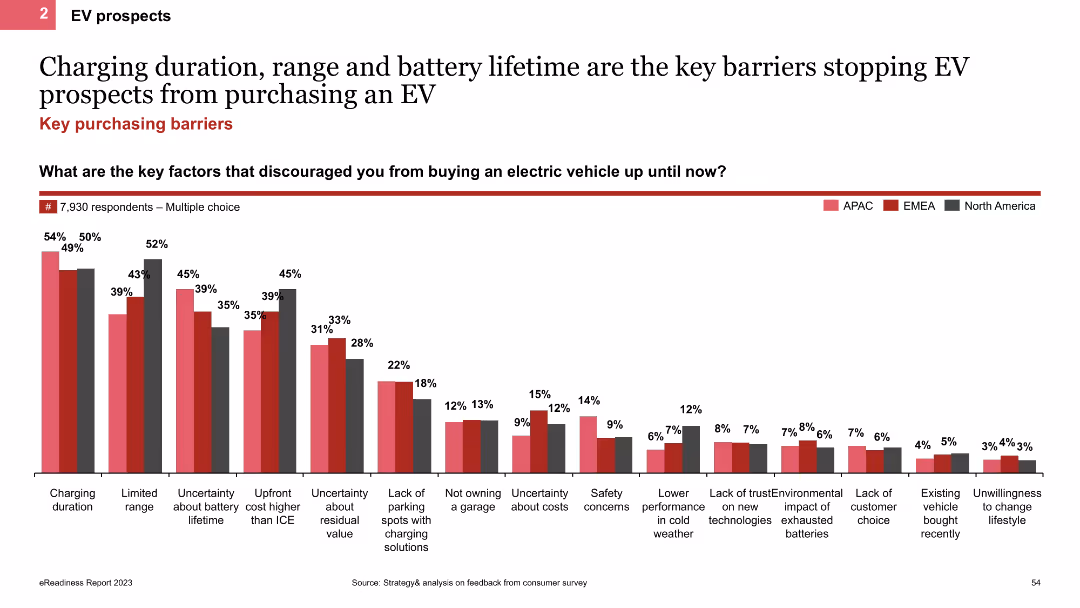
The slide uses a column chart to show the main barriers preventing EV purchases, such as charging duration, range, and battery lifetime. It includes regional comparisons indicated by colored bars for APAC, EMEA, and North America.
Market Analysis and Trends
Transportation & Logistics
This slide analyzes the key barriers to EV adoption, focusing on issues like charging duration, range, and battery lifetime. It provides regional data to show how these barriers vary across different areas.
EV barriers, column chart, charging duration, battery lifetime
Single Chart
PwC/Strategy&
Saved
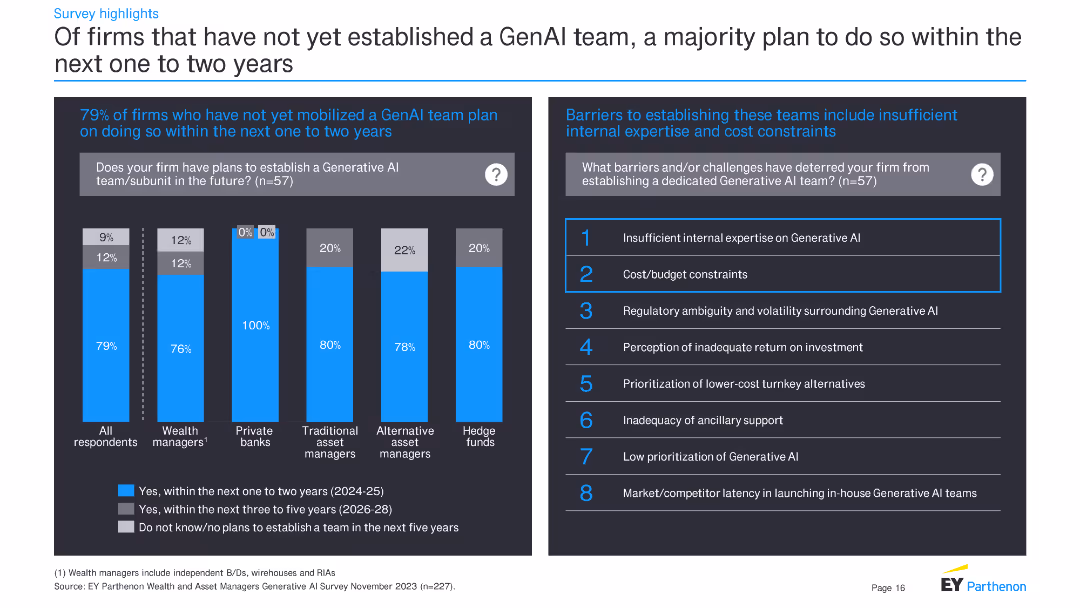
The slide is divided into two parts: a column chart on the left and a list of barriers on the right. The column chart shows responses from different types of financial firms on their plans to establish a GenAI team, with the x-axis representing firm types and the y-axis showing percentage values. The right side lists eight barriers to establishing these teams, formatted in a simple text list.
Strategic Planning
Financial Services
The slide presents survey results showing that 79% of firms plan to establish a GenAI team within the next one to two years. It also lists eight barriers preventing firms from establishing these teams, with insufficient internal expertise and cost constraints being the top reasons.
Generative AI, financial firms, survey results, barriers, expertise, cost constraints, future plans, team establishment
Mixed Chart
EY
Saved
Column chart showing growth metrics for client relationships, net new assets, fee-based flows, and asset management revenues from 2019 to 2023.
Strategic Planning
Financial Services
Highlights significant growth in Morgan Stanley's Path to Advice program, illustrating metrics for client relationships, new assets, fee-based accounts, and revenues.
Morgan Stanley, growth, client relationships, assets, fee-based
Multiple Chart
Morgan Stanley
Saved
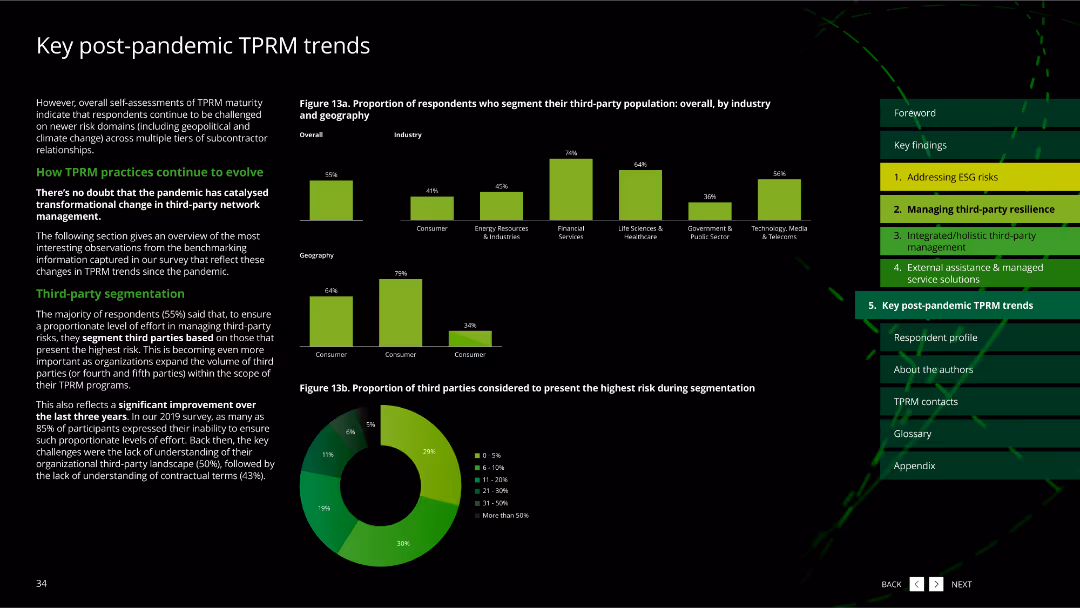
The slide has multiple column charts and a pie chart, showing the proportion of respondents segmenting third-party population by industry and geography.
Market Analysis and Trends
Professional Services
It highlights trends in third-party risk management (TPRM) post-pandemic, focusing on segmentation practices and the highest risk third parties.
post-pandemic trends, third-party segmentation, pie chart, column charts, TPRM, professional services
Multiple Chart
Deloitte
Saved
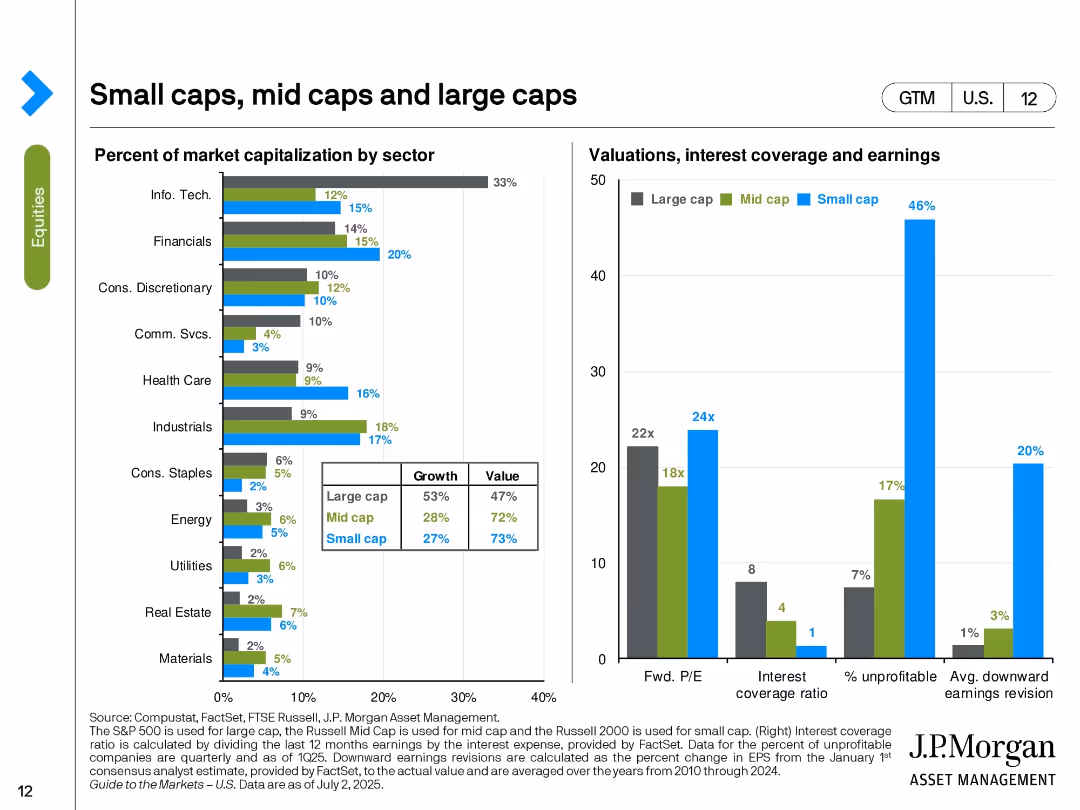
Bar charts comparing market sector exposure by cap size (left) and valuation/financial metrics (right) for small, mid, and large caps.
Customer and Market Segmentation
Financial Services
This slide compares small, mid, and large cap stocks across multiple dimensions including sector weightings, valuation (Fwd. P/E), interest coverage, unprofitability, and earnings revisions. Small caps show higher risk (46% unprofitable) but are more heavily weighted in certain sectors like Industrials.
small cap, mid cap, large cap, market cap, valuation, sector allocation, interest coverage, earnings revision, equity segmentation
Multiple Chart
JP Morgan
Saved
A structured layout with icons and bullet points, highlighting key financial opportunities and industry capabilities enabled by connectivity.
Investment Analysis
Telecommunications
Discusses the monetization opportunities and new capabilities for industries created by advanced connectivity.
Connectivity, Monetization, Industry, Telecom, B2B, Devices, IoT
Header Horizontal
McKinsey
Saved
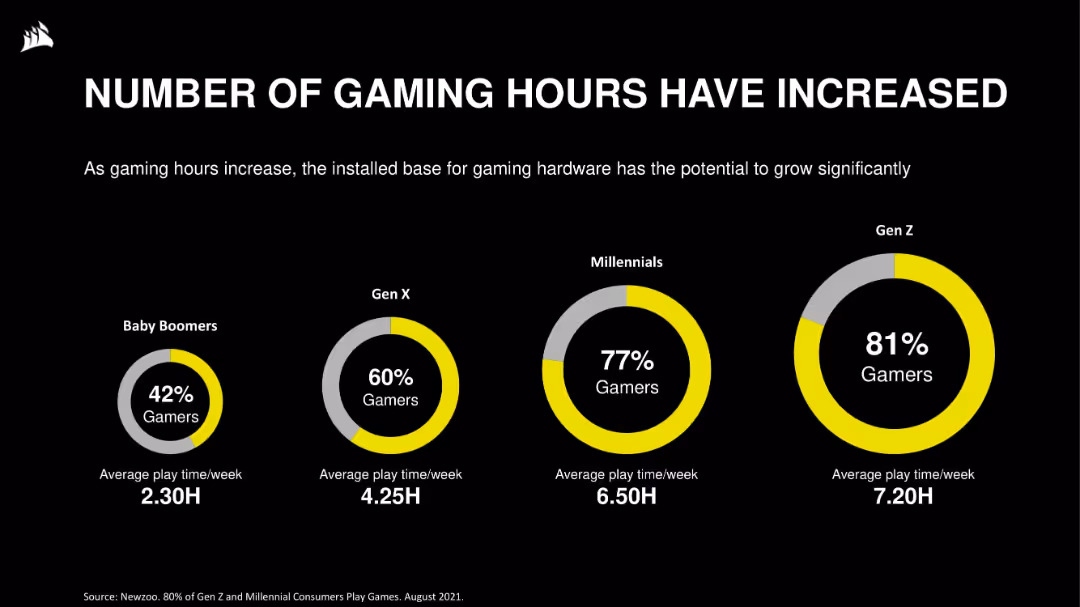
Circular infographics for generational comparison across Baby Boomers to Gen Z, showing % of gamers and average weekly playtime. Clean visual hierarchy on dark background.
Customer and Market Segmentation
Technology & Software
The slide highlights gaming adoption and engagement across age groups. Gen Z leads with 81% gamers and the highest average weekly playtime. The data suggests a growing user base and potential for hardware adoption tied to rising usage.
gaming hours, demographics, Gen Z, Millennials, playtime, gamer segmentation, user engagement, trends
Single Chart
Goldman Sachs
Saved
Features a pie chart showing the percentage of people using Generative AI for work, with a bar chart for specific purposes like personal, work, and education.
Market Analysis and Trends
Technology & Software
Highlights the adoption of Generative AI tools in professional contexts, estimating the number of users and their application areas.
Generative AI, workplace adoption, professional use, technology impact, user statistics
Mixed Chart
Deloitte
Saved
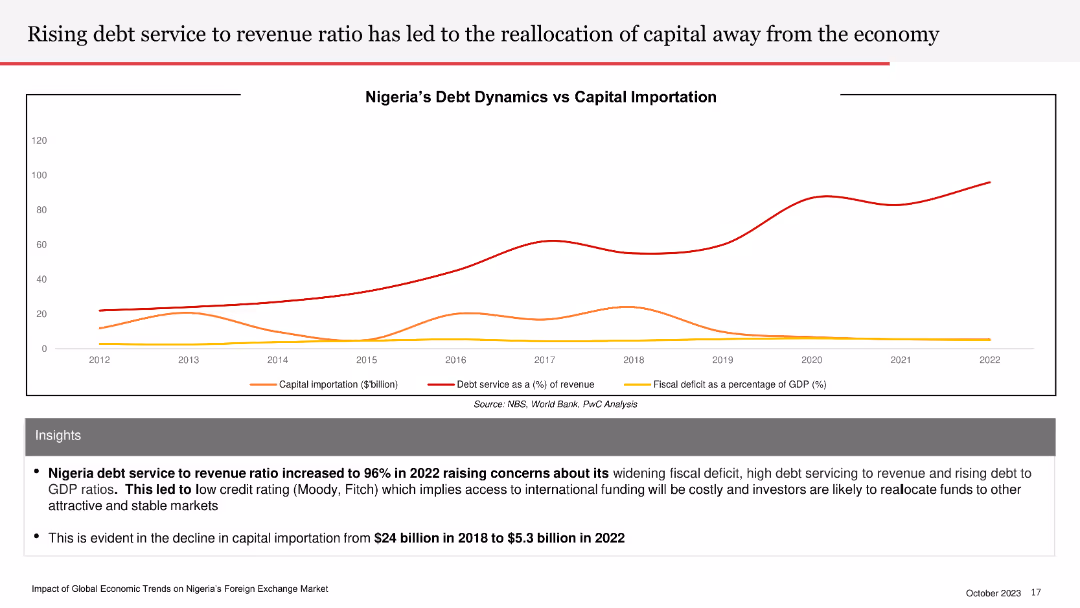
The slide features a line chart showing Nigeria’s debt dynamics versus capital importation over time, with separate lines for each metric.
Risk Assessment and Management
Financial Services
The slide highlights the rising debt service to revenue ratio in Nigeria and its impact on capital importation and economic stability.
debt service, revenue ratio, capital importation, Nigeria, economic impact
Mixed Chart
PwC/Strategy&
Saved
Previous
Next
If nothing, comes up, please save your slides first
Create a FREE account to continue browsing
Receive Instant Access to 1,000+ slides from companies like McKinsey, Google, and Goldman Sachs
First Name
Last Name
Email
Password
I agree to all
Terms & Privacy Policy
Thank you! Your submission has been received!
Oops! Something went wrong while submitting the form.
Have an account?
Sign in
Column Chart
Heatmap
Chevron
Org Chart
Infographic
Callouts
Timeline
List
Graphic
Picture
Process Flow
Diagram
Paragraph
Map
Table
Framework
Subtitle
Takeaway Box
Icon
Other Chart
Radar Chart
Waterfall Chart
Mekko Chart
Pie Chart
Scatter Plot
Line Chart
Bar chart
Bullet points