My Account
My Slides
Search by Category
Templates
View All Templates
Download Template Slides
Leave Feedback
Login
Logout
Get Started
Browse all Slides
Browse all Slides
Create a FREE Account
Instant access to 1,000+ real slides from top companies like McKinsey, BCG, Goldman Sachs, Google and many more!
First Name
Last Name
Email
Password
I agree to all
Terms & Privacy Policy
Thank you! Your submission has been received!
Oops! Something went wrong while submitting the form.
Have an account?
Sign in
Saved Slides
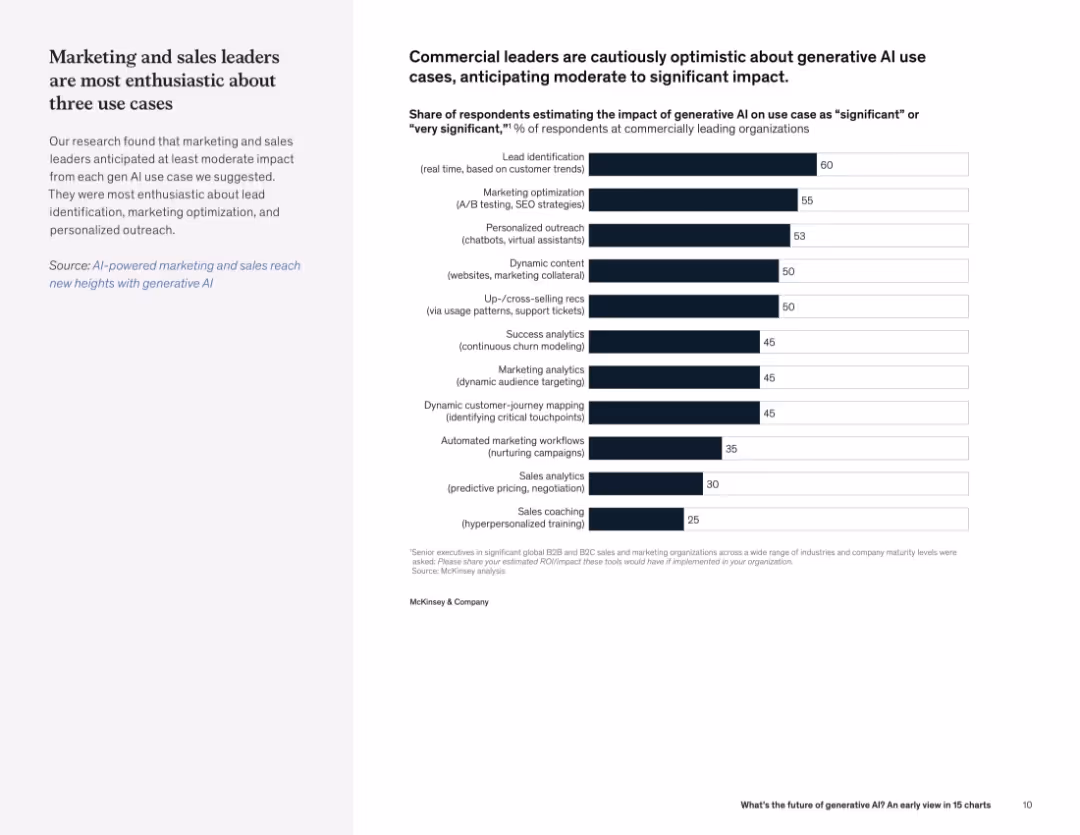
Split layout with text on left and horizontal bar chart on right listing use cases and perceived impact levels.
Product and Service Analysis
Artificial Intelligence
The slide presents survey results showing the perceived business impact of generative AI across use cases. Lead identification, marketing optimization, and personalized outreach rank highest in expected impact.
lead identification, personalized outreach, AI use cases, business impact, marketing, survey, optimism
Mixed Chart
McKinsey
Saved
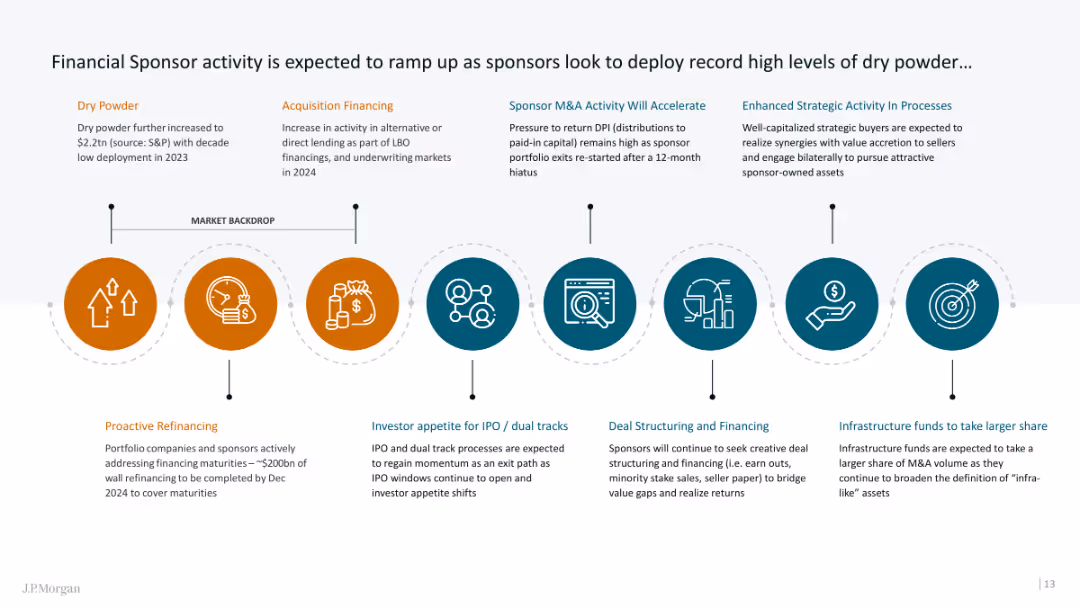
The slide contains an infographic with icons representing different aspects of financial sponsor activities and strategies.
Strategic Planning
Financial Services
It outlines the expected increase in financial sponsor activity, highlighting various financing and strategic planning elements.
Financial sponsor, dry powder, strategic planning, infographic, financing
Linear Flow
JP Morgan
Saved
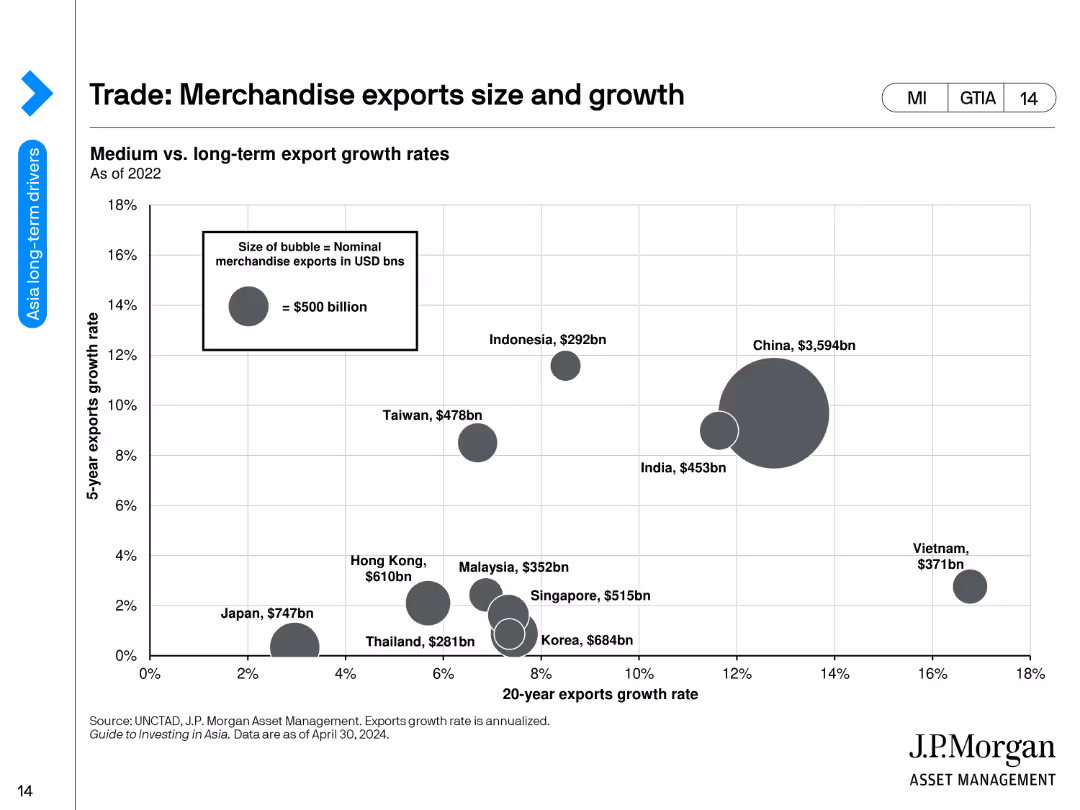
A bubble chart showing the merchandise export growth rates and sizes for various countries.
Market Analysis and Trends
Financial Services
The slide analyzes the medium vs. long-term export growth rates of merchandise exports for different countries, represented by bubble sizes corresponding to export values.
merchandise exports, growth rates, economic analysis, countries, trade, export values, financial trends, bubbles, development, export growth
Single Chart
JP Morgan
Saved
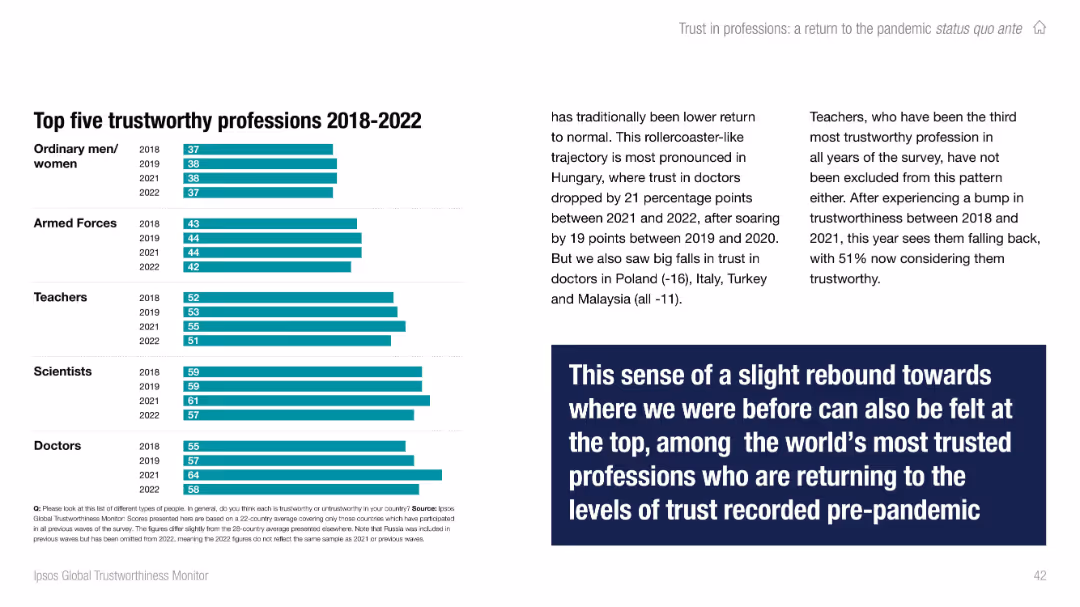
Right side contains multi-year bar chart; left has contextual text with a bold quote box. Color-coded by year.
Performance Metrics and KPIs
Professional Services
Highlights the top five most trusted professions from 2018 to 2022: doctors, scientists, teachers, armed forces, and ordinary people. Notes recent dips in trust for teachers and doctors in specific countries but overall consistency near the top of the trust scale.
professions, trust, Ipsos, top trusted, trends, teachers, doctors, global
Mixed Chart
IPSOS
Saved
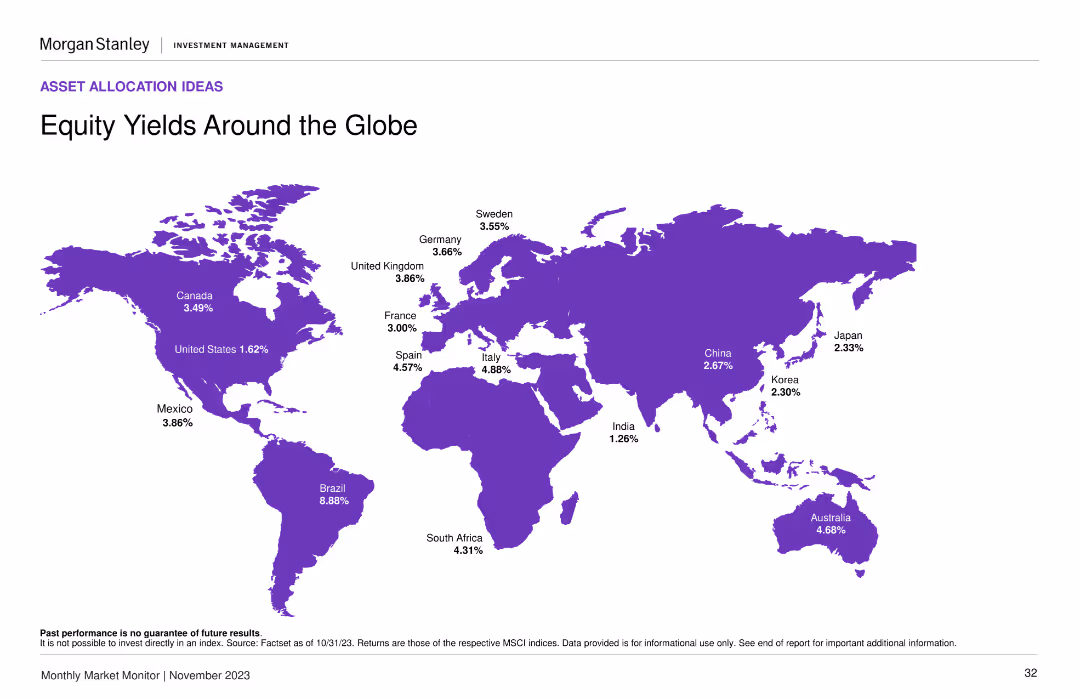
A world map displaying various countries highlighted in purple, with equity yield percentages annotated next to each country. The layout is clean with a central focus on the map.
Market Analysis and Trends
Financial Services
This slide provides a comparison of equity yields across different countries, showing investors where they might find the highest yields. Useful for global market analysis and investment decisions.
equity yields, global market, investment, countries, percentages
Graphic
Morgan Stanley
Saved
A diagram illustrating how Nielsen Streaming Signals optimize targeting intelligence. Includes boxes for CTV tuning information, individual/HHLD data, and Nielsen data science.
Technology and Digital Transformation
Media & Entertainment
Explains how Nielsen Streaming Signals improve the performance of targeting intelligence through optimization signals and data integration.
targeting, intelligence, Nielsen, streaming, optimization, data science
Diagram
Nielsen
Saved
Comprised of three sectioned column charts detailing investment expenses in different areas. The design is structured with color coding for ease of comparison and interpretation.
Investment Analysis
Financial Services
JPMorgan Chase's slide presents a multi-year investment strategy across business sectors, technology, and marketing. It demonstrates the firm's commitment to growth and adaptation in response to evolving market needs.
Investment Strategy, Long-term Success, Business Growth, Technology, JPMorgan Chase
Multiple Chart
JP Morgan
Saved
The slide contains a list with checkmarks showcasing assets and innovations in the card industry, complemented with icons representing digital and physical payments. It is structured for easy readability and distinction between unique assets and continuous innovation efforts.
Strategic Planning
Financial Services
This slide emphasizes the unique assets and innovative strides of a card franchise, underlining factors like unmatched scale and top-of-wallet share. It serves as a benchmark for companies aiming to enhance their market positioning through innovation.
Wallet share, Innovation, Industry assets, Branded cards, Loyalty program, Digital payments
Table
JP Morgan
Saved
The slide includes a column chart depicting the estimated levelized cost of hydrogen (LCOH) per production technology, with data points for Brown, Blue, Green hydrogen, and an average line. It shows costs in $ per kg for various technologies like SMR, Coal Gasification, and Alkaline Electrolysis.
Financial Performance
Energy & Utilities
The slide compares the estimated LCOH for different hydrogen production technologies, highlighting the cost differences between brown, blue, and green hydrogen sources. It provides a financial analysis of hydrogen production costs.
LCOH, Hydrogen, Cost, Production, Technology
Single Chart
Kearney
Saved
The slide features a column chart, a table, and color-coded timelines.
Investment Analysis
Financial Services
The slide presents the history and innovation in investment types over time with a focus on alternatives. It includes historical timelines, net IRR percentages, and growth in asset mix.
Alternatives, Investment, Growth, IRR, Timeline
Mixed Chart
JP Morgan
Saved
This slide features a three-column layout with icons and bullet points under each column. The icons are simple and relevant to the respective themes.
Market Analysis and Trends
Healthcare & Pharmaceuticals
This slide summarizes the findings on financial outlook, operation priorities, and digitalization in hospitals, highlighting key points under each theme.
financial outlook, operation priorities, digitalization, hospitals, summary
Pillar
LEK
Saved
The slide includes a stacked column chart displaying unlinked bus and rail rides annually, with distinct colors for each mode of transport and a trend line indicating changes.
Industry Overview
Transportation & Logistics
Presents data on declining ridership in public transportation, identifying trends and potential areas for operational improvements to enhance service efficiency.
public transportation, ridership decline, operational efficiency, data analysis
Multiple Chart
Deutsche Bank
Saved
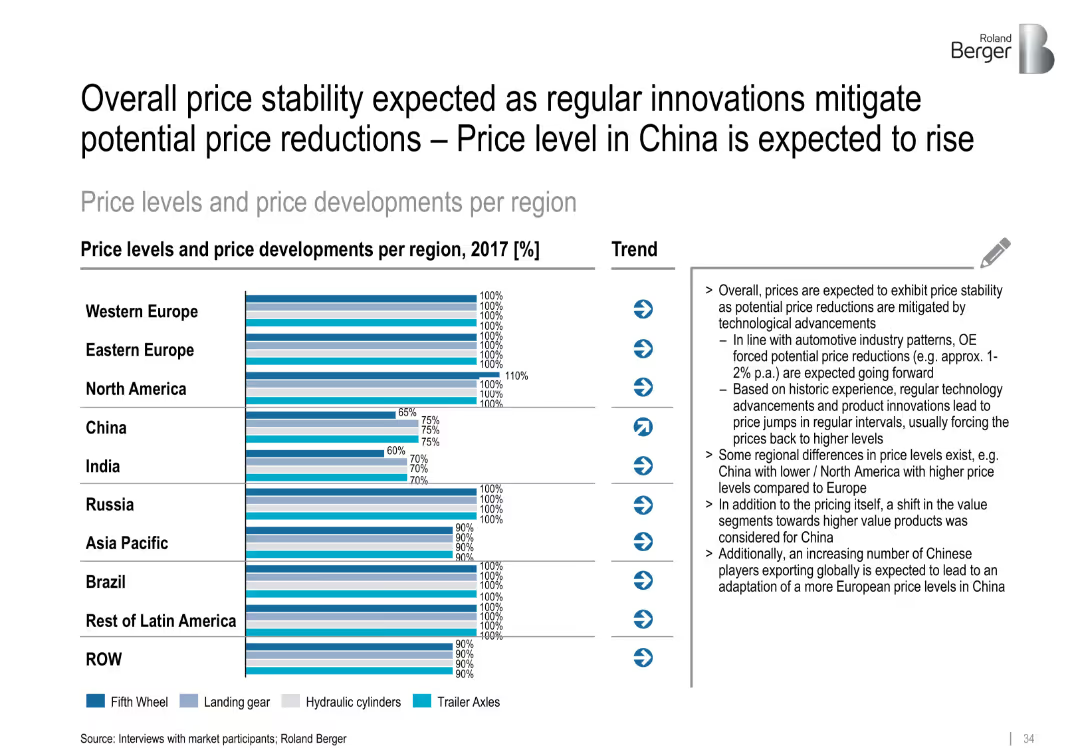
Horizontal bar chart with four component types per region; trend arrows and right-aligned detailed notes
Pricing Strategies
Transportation & Logistics
The slide highlights regional price levels and developments for trailer components in 2017. Western markets show uniform 100% pricing, while developing markets show lower relative price levels. Innovations are expected to stabilize prices, especially in China.
price stability, trailer components, China, pricing forecast, innovation impact, global regions, trailer axles, fifth wheel
Mixed Chart
Roland Berger
Saved
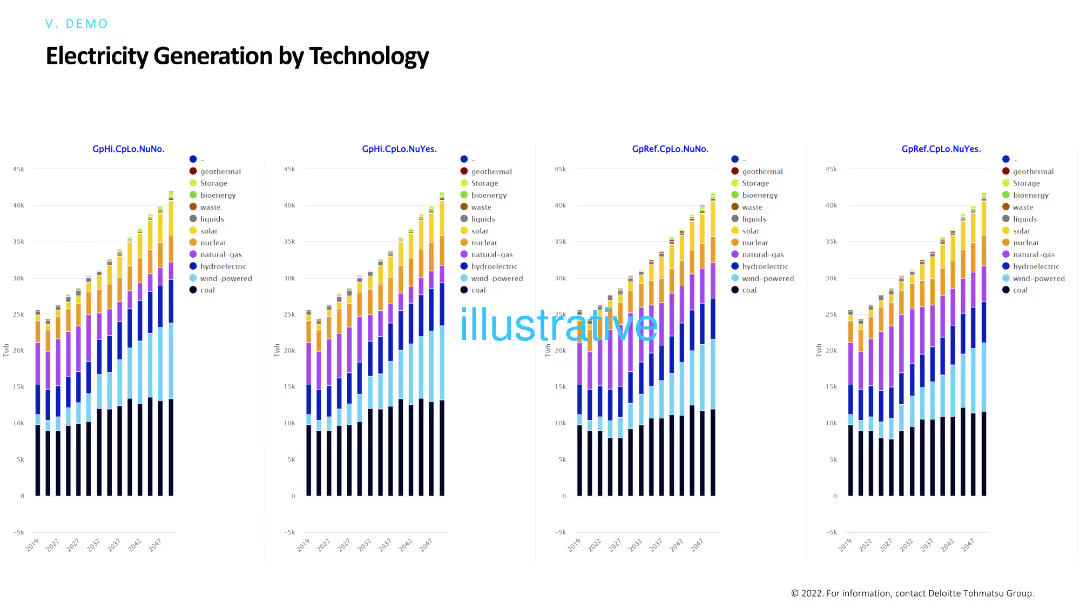
The slide includes multiple column charts comparing electricity generation by different technologies (geothermal, solar, nuclear, etc.) under various scenarios. Each chart shows a breakdown of technology contributions over time.
Technology and Digital Transformation
Energy & Utilities
This slide compares electricity generation technologies across different scenarios, highlighting the contributions of various sources like solar, wind, and nuclear, and projecting future energy mixes.
Electricity generation, technology, renewable energy, scenarios, energy mix
Multiple Chart
Deloitte
Saved
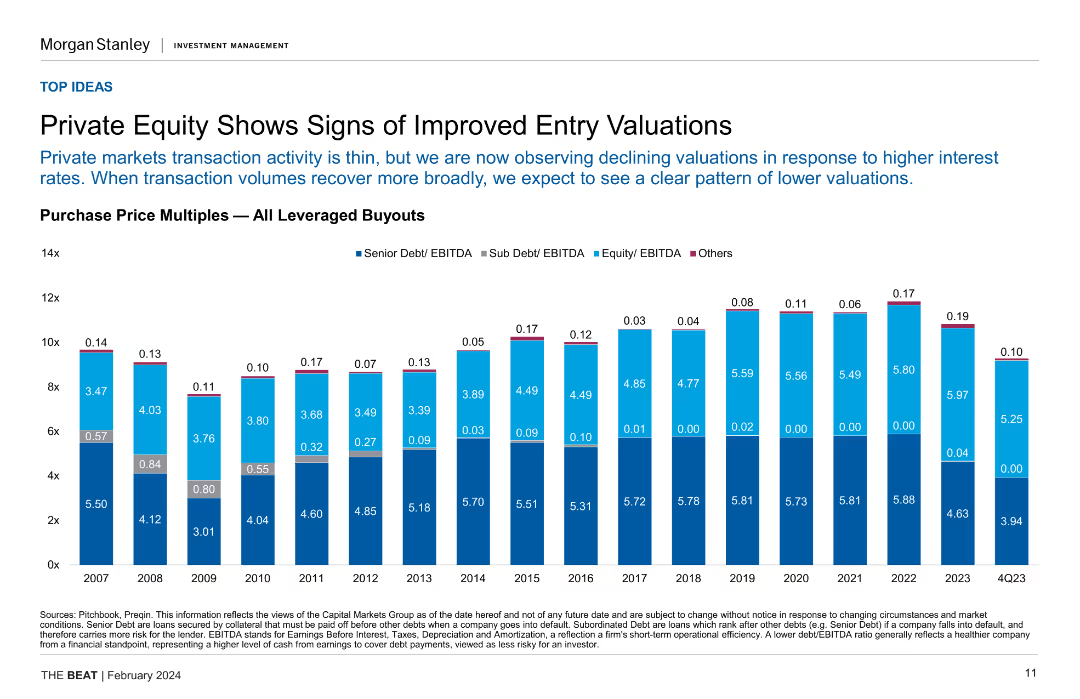
Column chart showing purchase price multiples for all leveraged buyouts over several years, highlighting senior and sub debt/EBITDA ratios.
Investment Analysis
Financial Services
This slide indicates improved entry valuations in private equity, with declining valuations due to higher interest rates, and compares historical purchase price multiples.
private equity, entry valuations, leveraged buyouts, purchase price multiples, investment analysis
Single Chart
Morgan Stanley
Saved
This slide features multiple column charts showing loan volumes, revenues, and deposits growth from 2016 to 2017 for ICG and GCB units.
Financial Performance
Financial Services
The slide compares year-over-year growth in loan volumes, revenues, and deposits for Citigroup's ICG and GCB units, emphasizing strategic partnerships and market expansion.
Banking, Finance, Revenue, Growth, Loans
Multiple Chart
Citigroup
Saved
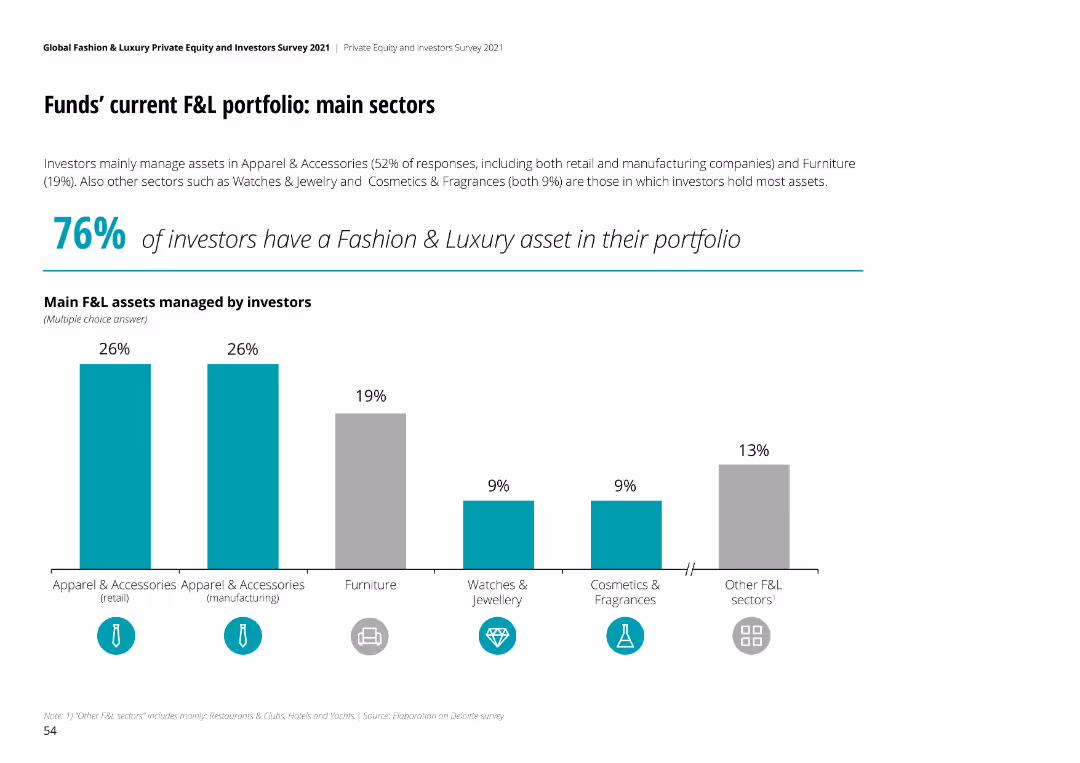
The slide contains a column chart showing the main sectors of F&L assets managed by investors, along with a key finding highlight.
Market Analysis and Trends
Financial Services
This slide presents the main sectors of current F&L portfolios managed by investors, indicating the proportion of assets in various sectors.
F&L, portfolio, sectors, investors, analysis
Mixed Chart
Deloitte
Saved
World map highlighting global presence, pie chart of regional revenue split, and key textual data points.
Industry Overview
Financial Services
Highlights the global reach and financial footing of the bank, detailing employee numbers and loan book value, aimed at investors and market analysts.
global network, banking, market presence, 2022
Mixed Chart
Deutsche Bank
Saved
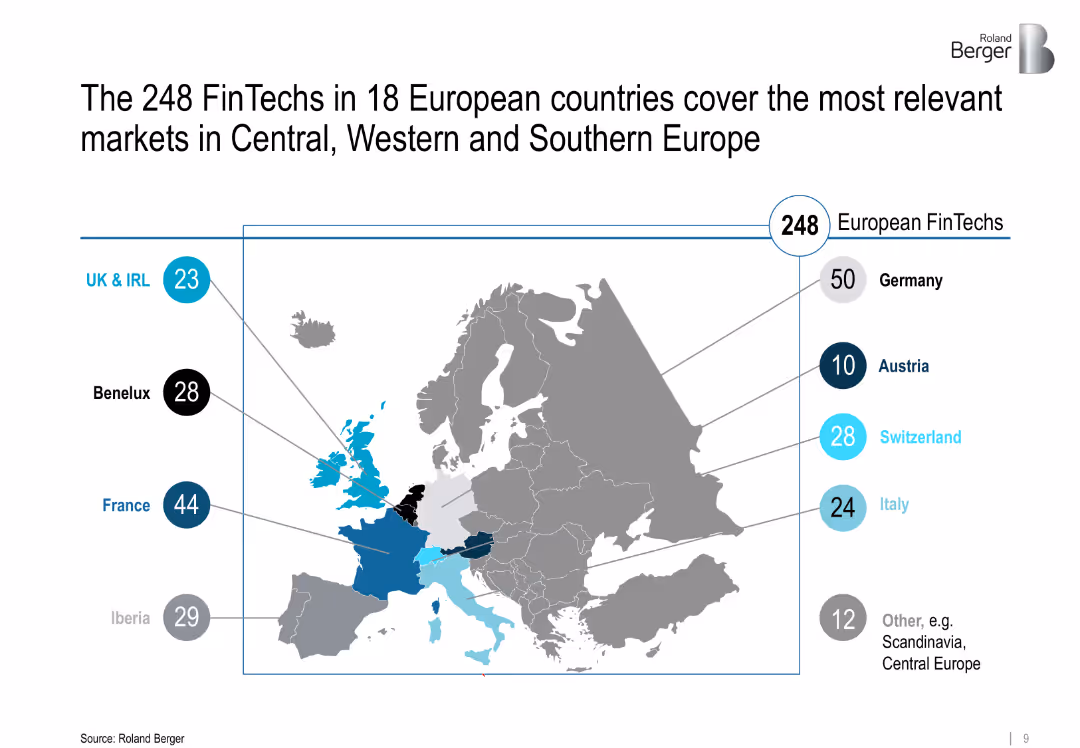
Map of Europe highlighting FinTech distribution by region with bubbles and numeric labels
Market Analysis and Trends
Financial Services
Geographic distribution of 248 FinTechs across 18 European countries, emphasizing Central, Western, and Southern Europe with visual emphasis on countries like Germany, France, and Iberia.
Europe, FinTech hubs, regional analysis, Central Europe, startup ecosystems
Single Chart
Roland Berger
Saved
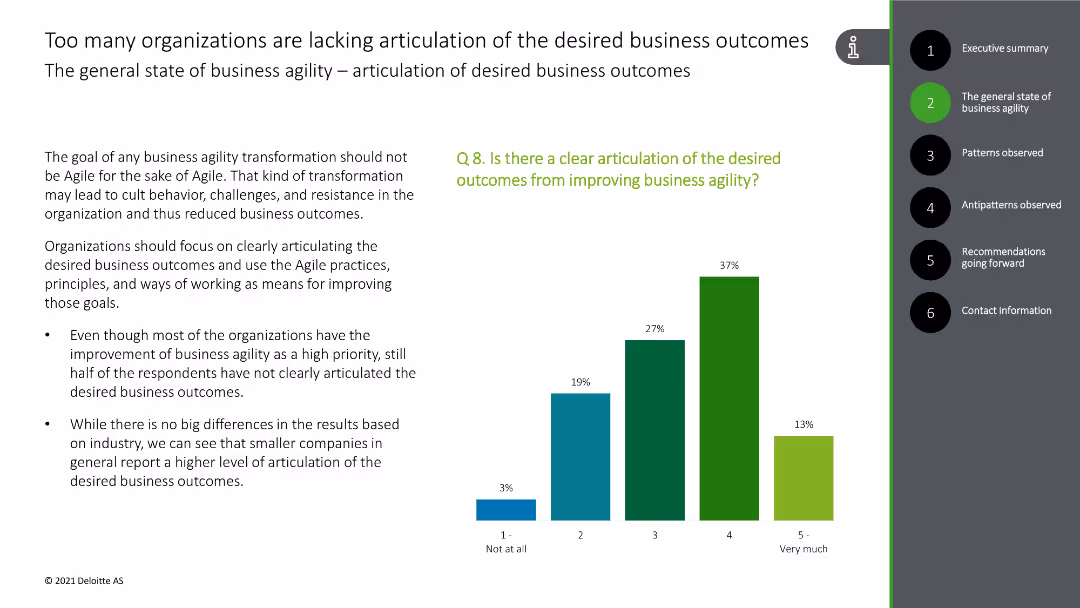
This slide presents a column chart showing levels of articulation of desired outcomes from improving business agility, with bars in green and blue shades.
Strategic Planning
Technology & Software
The slide addresses the need for clear articulation of business outcomes related to agility improvement, supported by survey results.
business agility, outcomes, clarity, articulation, survey data
Mixed Chart
Deloitte
Saved
Visuals include column charts for financial data, textual content for context, and a line graph for market trends.
Financial Performance
Financial Services
Reviews the performance of the CIB against industry wallet size and market share, including revenue and adjusted return on equity.
industry wallet, market share, CIB performance, capital requirements, return on equity, financial trends
Multiple Chart
JP Morgan
Saved
Contains a mix of bar charts and tables depicting financial metrics like revenues and costs, alongside textual annotations and a simple, professional color scheme.
Financial Performance
Financial Services
This slide covers the financial outcomes for the Corporate & Other segment, detailing losses and expenses with key highlights noted.
corporate finance, losses, expenses, financial results, Q4 2023
Mixed Chart
Deutsche Bank
Saved
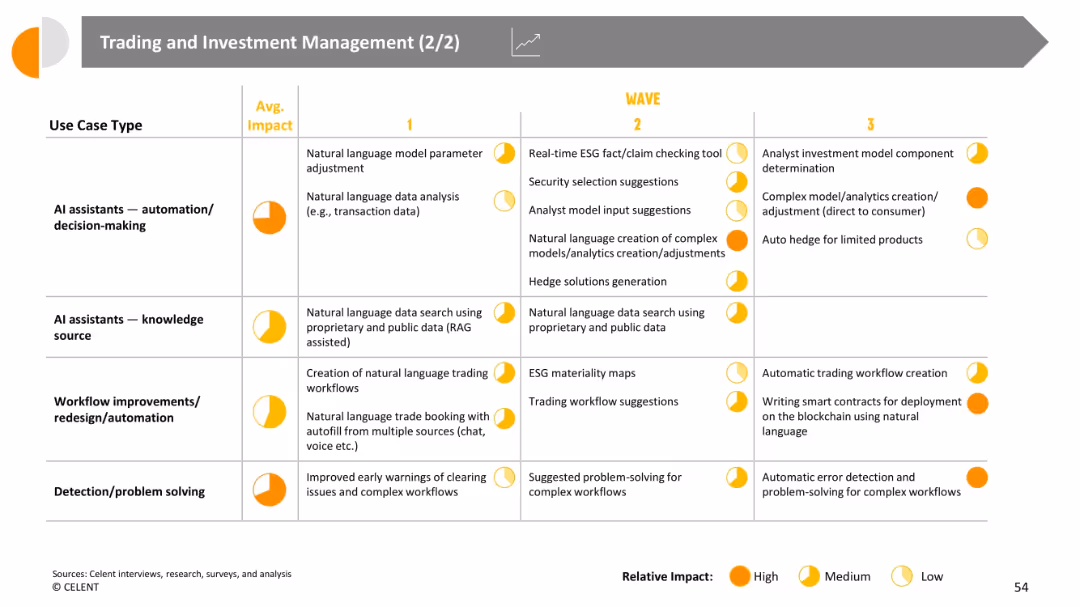
Continuation of tabular matrix; more technical/decision-making AI use types; average impact highlighted for each use case
Risk Assessment and Management
Financial Services
Shows advanced AI use cases including automation/decision-making, workflow redesign, and error/problem detection. Highlights advanced automation of trading logic, smart contracts, and risk management processes across three waves.
AI decision-making, risk models, workflow automation, smart contracts, GenAI in trading
Single Chart
Oliver Wyman
Saved
A donut chart showing 91% of respondents have disciplinary procedures in place.
Strategic Planning
Professional Services
Useful for HR management to evaluate the adoption and effectiveness of disciplinary procedures within organizations.
HR, disciplinary procedures, evaluation, adoption, effectiveness
Single Chart
PwC/Strategy&
Saved
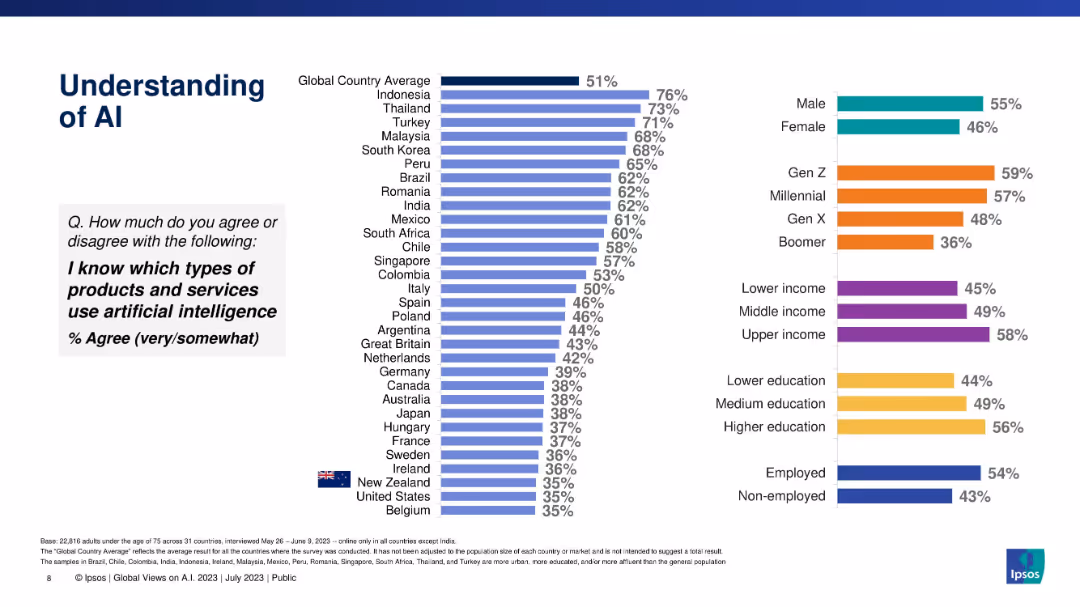
Vertical bar chart showing % of people who know which products/services use AI, by country and demographics.
Industry Overview
Artificial Intelligence
This slide measures familiarity with AI-powered products and services. It ranks countries by agreement and shows demographic patterns by gender, generation, income, and education, revealing significant differences in functional AI literacy.
AI products, awareness, demographics, Ipsos, product use, literacy, global view, services
Multiple Chart
IPSOS
Saved
Previous
Next
If nothing, comes up, please save your slides first
Create a FREE account to continue browsing
Receive Instant Access to 1,000+ slides from companies like McKinsey, Google, and Goldman Sachs
First Name
Last Name
Email
Password
I agree to all
Terms & Privacy Policy
Thank you! Your submission has been received!
Oops! Something went wrong while submitting the form.
Have an account?
Sign in
Column Chart
Heatmap
Chevron
Org Chart
Infographic
Callouts
Timeline
List
Graphic
Picture
Process Flow
Diagram
Paragraph
Map
Table
Framework
Subtitle
Takeaway Box
Icon
Other Chart
Radar Chart
Waterfall Chart
Mekko Chart
Pie Chart
Scatter Plot
Line Chart
Bar chart
Bullet points