My Account
My Slides
Search by Category
Templates
View All Templates
Download Template Slides
Leave Feedback
Login
Logout
Get Started
Browse all Slides
Browse all Slides
Create a FREE Account
Instant access to 1,000+ real slides from top companies like McKinsey, BCG, Goldman Sachs, Google and many more!
First Name
Last Name
Email
Password
I agree to all
Terms & Privacy Policy
Thank you! Your submission has been received!
Oops! Something went wrong while submitting the form.
Have an account?
Sign in
Saved Slides
The slide uses a structured format with headers and bullet points under each of the seven steps, describing the actions associated with each phase of social impact reporting.
Regulatory and Compliance
Telecommunications
This slide outlines a structured seven-step approach for assessing social impact, using NBN Co as a case study, highlighting industry-referenced frameworks.
social impact, NBN Co, frameworks, reporting, case study, structured approach
Linear Flow
Accenture
Saved
Describes the expected impact of ML industrialization across various sectors, with representative icons for each.
Technology and Digital Transformation
Technology & Software
Explores the potential impact of ML industrialization across a variety of industries and how it could offer competitive advantages.
ML, industries, impact, tech trend, competitive advantage
Header Vertical
McKinsey
Saved
The slide features a prominent logo at the top right, a title, two circle diagrams on the left, and a vertical column chart showing revenue trends from 2016/17 to 2020/21.
Financial Performance
Government & Public Sector
This slide presents annual revenue data from 2016/17 to 2020/21 alongside priority areas for structural reforms. It's useful for discussing financial strategies and policy impacts within the government sector.
Revenue, Reforms, Forecast, Government, Policy
Single Chart
PwC/Strategy&
Saved
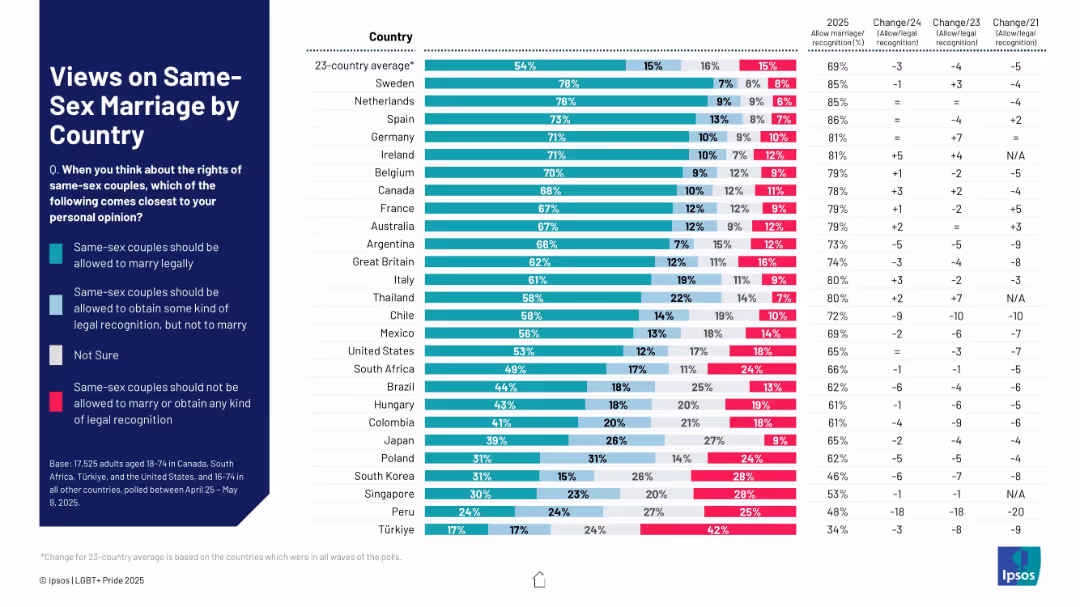
Multicolor stacked bar chart showing legal recognition support levels across countries, including "Not sure" responses.
Regulatory and Compliance
Government & Public Sector
This slide measures global sentiment toward same-sex marriage rights. It shows whether people believe same-sex couples should be allowed to marry, receive legal recognition, or be denied both. Trends over time are also included.
same-sex marriage, legal recognition, LGBTQ+ rights, marriage equality, international opinion, civil rights, public support, trends
Mixed Chart
IPSOS
Saved
Comprehensive tables and lists showing the status of PPP projects in the Philippines by status, sector, and area, with a professional and organized layout.
Operational Efficiency
Government & Public Sector
Provides an overview of public-private partnership projects in the Philippines, detailing their stages, sectors, and geographic distribution.
PPP, projects, Philippines, public-private, government, sectors, distribution
Table
Deloitte
Saved
A map showing the REHYNE project overview, detailing the Shell refinery in Wesseling, Germany. The slide includes project details, including hydrogen production, emissions, and future plans.
Strategic Planning
Energy & Utilities
The slide outlines the business case for producing green hydrogen at the Shell refinery in Wesseling, covering current situation, integration of a 10 MW PEM electrolyzer, and future projections.
green hydrogen, Shell, Wesseling, refinery, PEM electrolyzer, Germany, project overview, hydrogen production
Graphic
Kearney
Saved
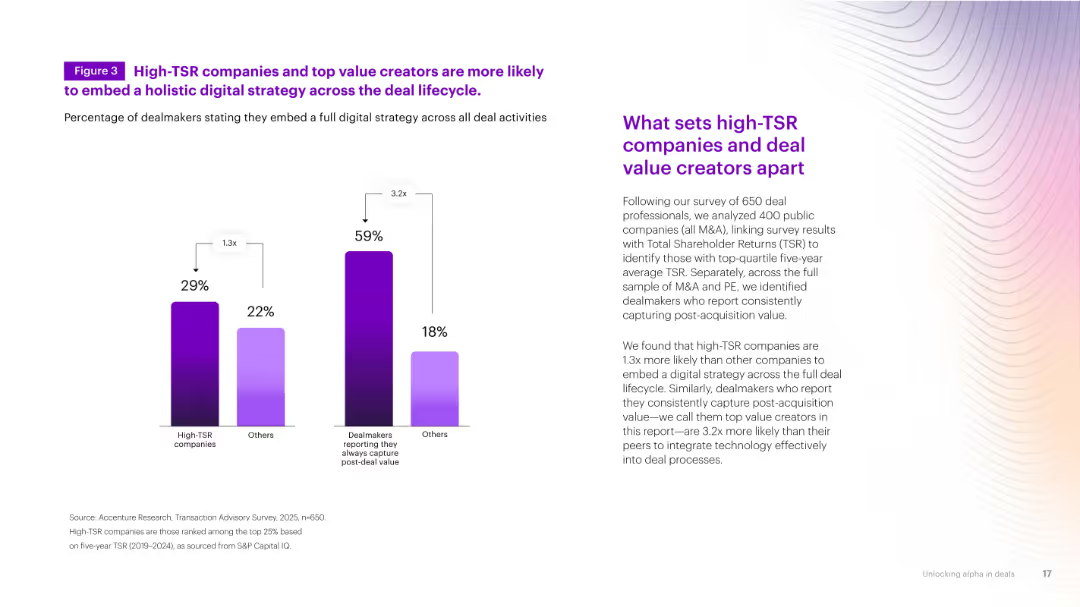
Dual bar chart comparing high-TSR vs. other companies in digital strategy embedding. Accompanied by explanatory paragraph on the right. Gradient background.
Performance Metrics and KPIs
Financial Services
Shows that high-TSR firms are significantly more likely to embed digital strategies and consistently capture post-deal value. Supports the case for digital transformation in M&A.
TSR, digital strategy, post-deal, performance, transformation
Mixed Chart
Accenture
Saved
This slide presents a column chart with projected advisor headcount growth and several icon-based stats related to advisor productivity. It has a clean, organized layout with a blue and grey color scheme.
Operational Efficiency
Financial Services
Discusses the strategy to increase advisor headcount in branches and the outcomes like advisor productivity and client satisfaction. It's intended to inform about scaling operations and anticipated outcomes in advisor channels and client satisfaction levels through a unique branch-based model.
Advisor headcount, Productivity, Client satisfaction, Growth, Talent
Mixed Chart
JP Morgan
Saved
Column charts showing the amount of data created and connected devices worldwide from 2010 to 2035, with a list of activities that happen in 60 seconds on the Internet.
Technology and Digital Transformation
Technology & Software
This slide illustrates the exponential growth in data creation and connected devices, driven by the rise of IoT. It emphasizes the increasing interconnectedness and the potential of smart physical objects and processes to transform various industries through massive data generation and utilization.
Data Creation, IoT, Connected Devices, Internet
Multiple Chart
Roland Berger
Saved
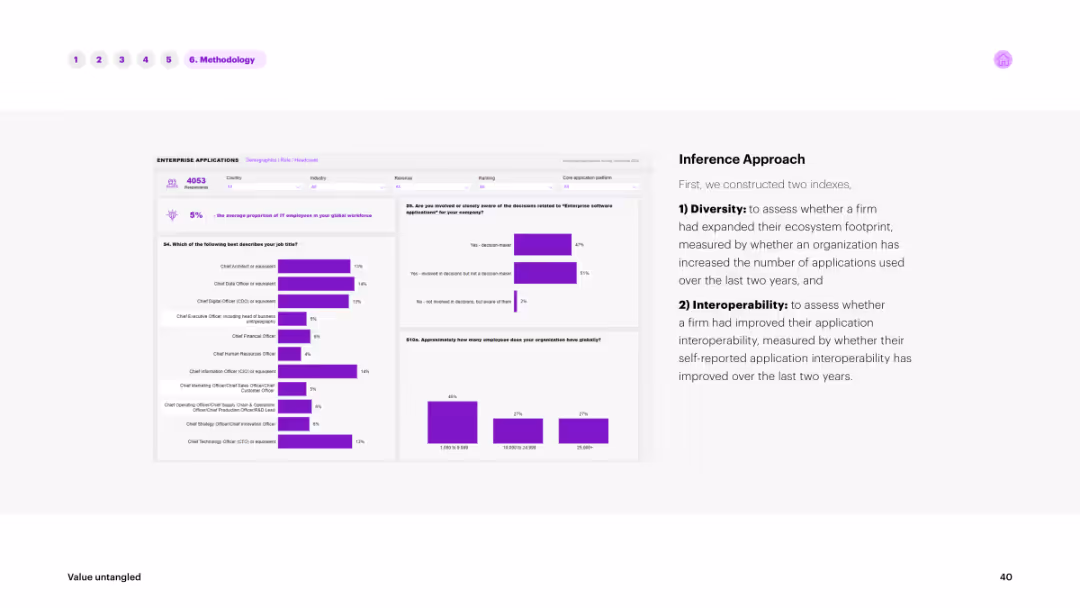
The slide includes text on the right explaining the inference approach and multiple bar charts on the left showing data distributions. The charts and text are in shades of purple against a white background.
Market Analysis and Trends
Technology & Software
Describes the inference approach used in the survey, focusing on diversity and interoperability indices. The bar charts show the distribution of responses, providing insights into ecosystem footprints and application interoperability improvements.
inference, approach, survey, diversity, interoperability
Multiple Chart
Accenture
Saved
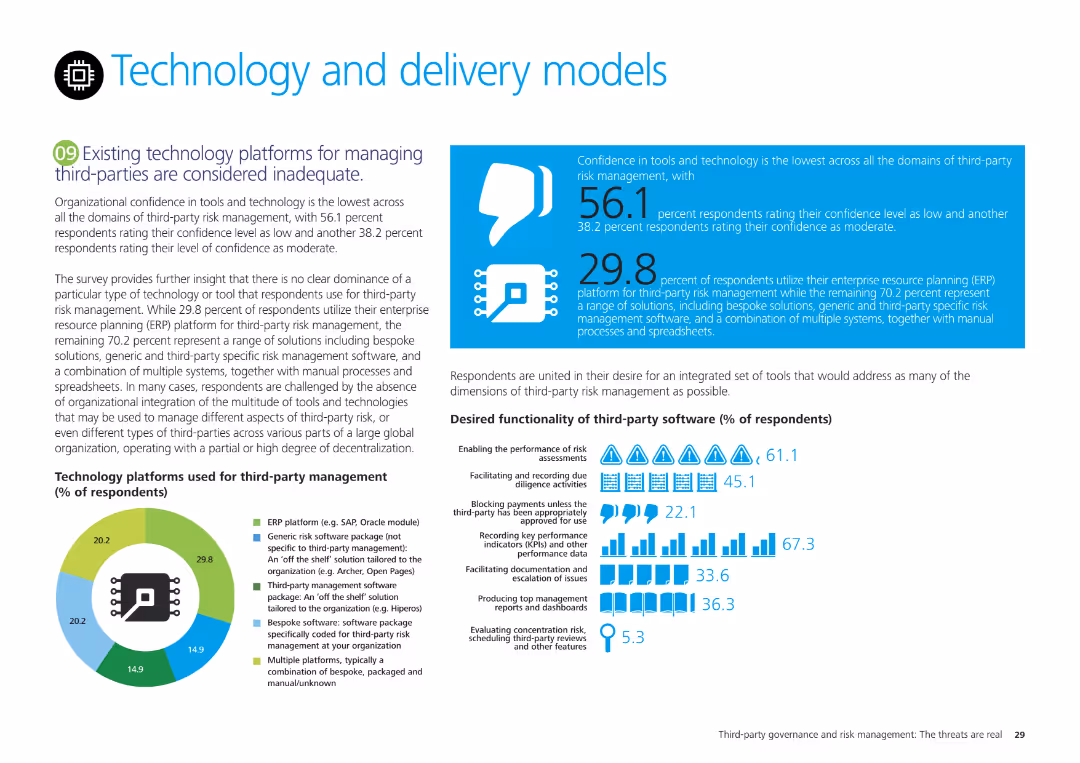
Multiple charts showing confidence levels in technology platforms and desired functionality of third-party software. High visual density with explanatory text boxes.
Technology and Digital Transformation
Technology & Software
Highlights existing inadequacies in technology platforms for third-party management, desired functionalities, and confidence levels, with detailed charts.
technology, delivery models, third-party, software, confidence, functionality
Mixed Chart
Deloitte
Saved
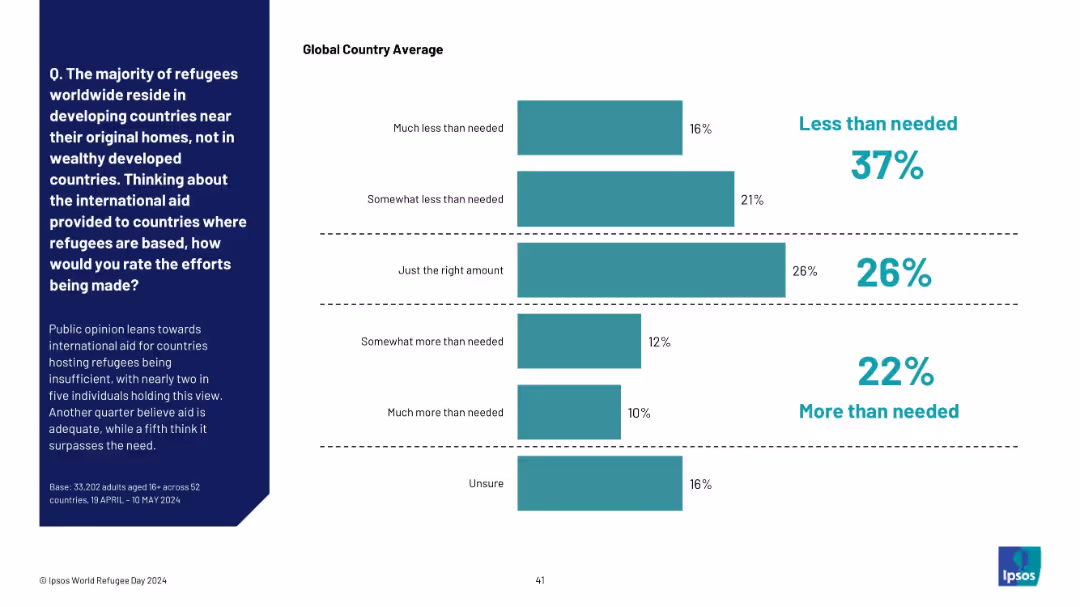
Horizontal bar chart with five answer categories, segmented into three color-coded opinion clusters (less than needed, just right, more than needed). Explanatory paragraph on the left.
Risk Assessment and Management
Government & Public Sector
This slide evaluates public opinion on the adequacy of international aid to countries hosting refugees. Responses are grouped by perception of sufficiency, revealing a general sense that support is less than needed.
international aid, refugee support, public perception, adequacy, global opinion, Ipsos, host countries, sufficiency, bar chart
Mixed Chart
IPSOS
Saved
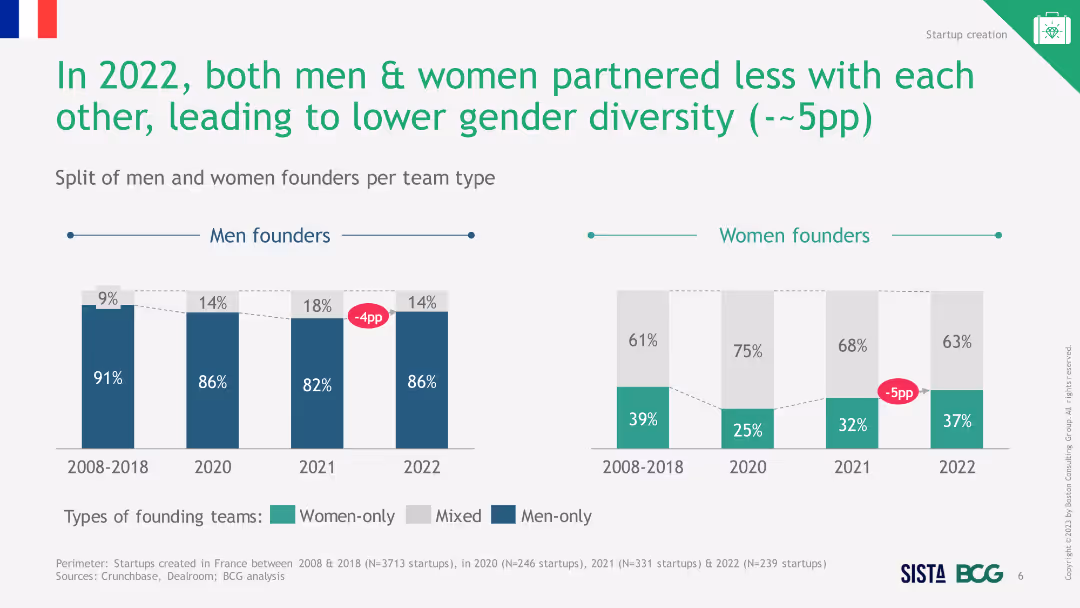
Text and column chart showing the distribution of team types for startups by gender in 2022, highlighting solo and group startups for men and women.
Market Analysis and Trends
Professional Services
The slide indicates that fewer women start businesses solo compared to men and highlights the disparity in partnership types by gender.
women entrepreneurs, solo business, gender disparity
Multiple Chart
BCG
Saved
The slide presents icons showing different fears affecting innovators, with comparative intensity levels among average and leading innovators.
Human Resources and Talent Management
Professional Services
Explores common fears among innovators, comparing how these fears vary between average and leading innovators and their impact on innovation efficiency.
innovation, fears, impact, career, outcomes, criticism, comparison
Pillar
McKinsey
Saved
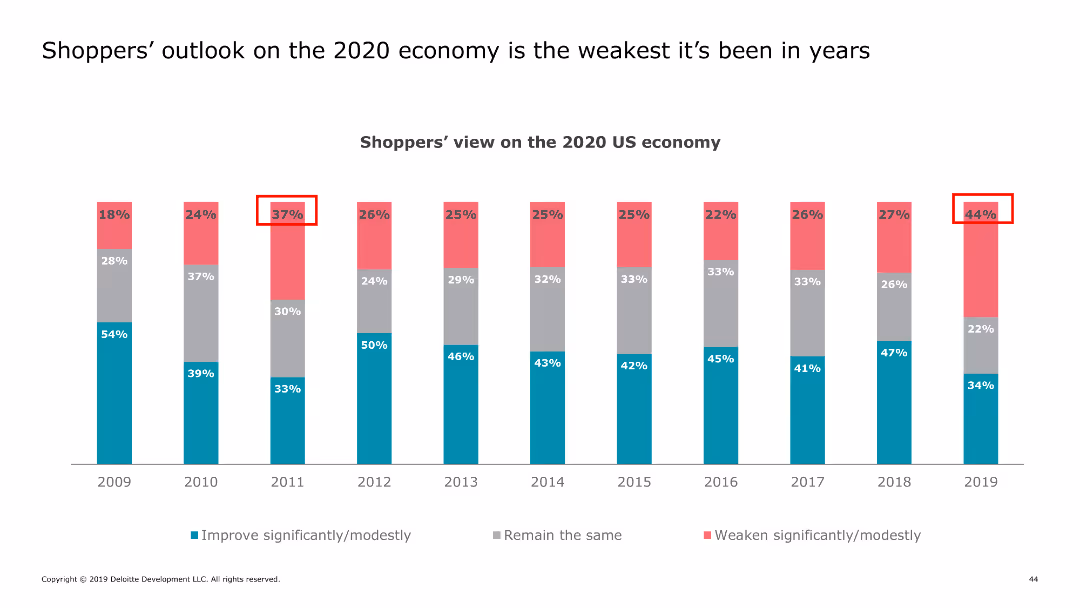
This slide presents a column chart tracking shoppers' views on the US economy over multiple years, with emphasis on the 2020 outlook. Different colors represent different levels of optimism.
Market Analysis and Trends
Retail & E-commerce
It reviews the declining optimism of shoppers regarding the US economy for the year 2020, compared to previous years, indicating a weak economic outlook.
economy, outlook, shoppers, US, trends
Single Chart
Deloitte
Saved
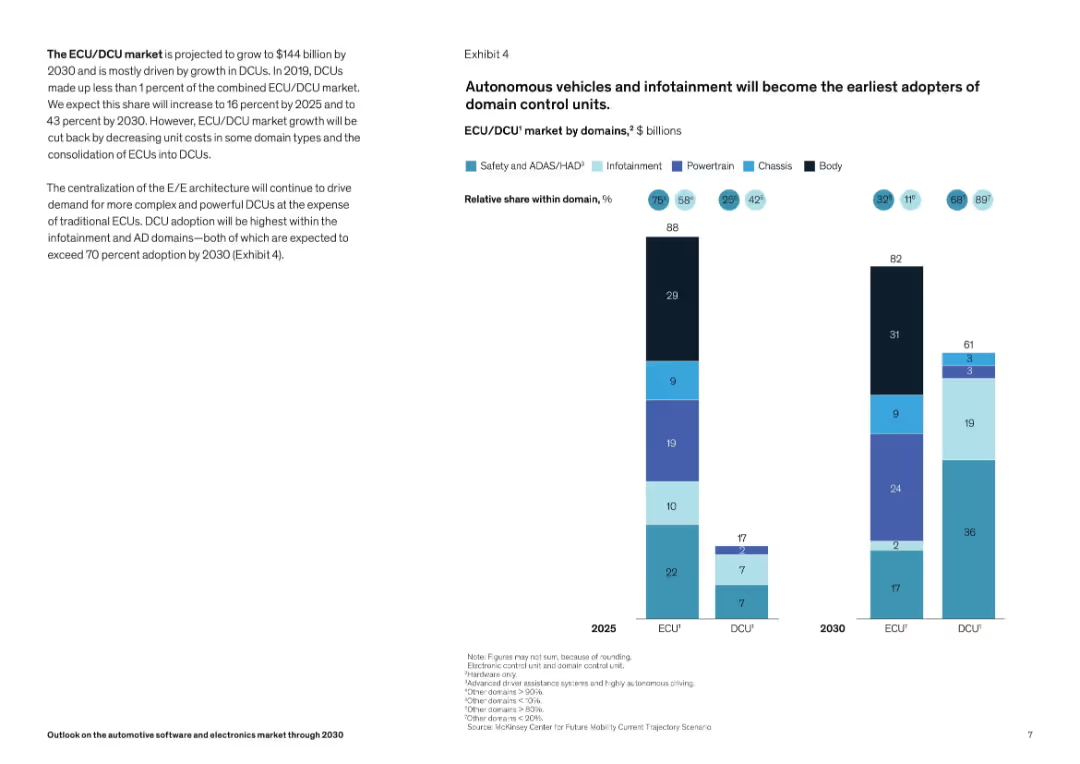
Two-column layout; left side has textual insights, right side features a stacked bar chart comparing ECU and DCU market values and domain shares for 2025 and 2030. Color-coded bars indicate different vehicle domains.
Market Analysis and Trends
Industrial & Manufacturing
This slide highlights the growth of the ECU/DCU market to $144B by 2030, driven by DCU adoption, especially in autonomous driving (AD) and infotainment. A bar chart shows domain-wise distribution and projected adoption trends for 2025 and 2030. Centralized E/E architecture is emphasized as a growth driver for DCUs.
ECU, DCU, ADAS, infotainment, autonomous driving, domain architecture, market growth, vehicle electronics, 2030 forecast, automotive
Mixed Chart
McKinsey
Saved
The slide shows two column charts, one with special effects and one without, emphasizing Tufte's principle of removing special effects.
Technology and Digital Transformation
Professional Services
This slide demonstrates how removing special effects can improve data clarity and focus in presentations according to Tufte's guidelines.
Tufte, data-to-ink, ratio, survey, responses, visualization, special effects, chart, clarity, design
Multiple Chart
EY
Saved
This slide presents a combined graph and textual information. On the left, a column chart shows 'GS Group Vanilla and Preferred Stock Issuance vs. Maturities' over several years. On the right, a pie chart details '1Q20 GS Group Vanilla Issuance by Currency'. Additionally, there are bullet points summarizing key funding details.
Financial Performance
Financial Services
Offers a look into the company's funding strategy through various debt instruments and preferred stocks, useful for investors or financial analysts interested in funding diversification and debt maturity profiles.
vanilla funding, preferred stock, issuance, debt maturities, bar chart, pie chart, currency distribution, investment analysis, financial diversification, funding strategy
Multiple Chart
Goldman Sachs
Saved
The slide shows a dual-axis line chart tracking accelerator attendance and equity investment over time, with text descriptions on accelerator impacts.
Market Analysis and Trends
Technology & Software
It discusses the role and impact of accelerators in Edinburgh, showing trends in equity investment and accelerator attendance from 2011 to 2020, with a focus on local technology growth.
accelerators, investment, Edinburgh, technology, growth, equity, government role, startup support, local ecosystem, economic development
Mixed Chart
Barclays
Saved
Circular flow diagram centralizing the key criteria for blockchain application, such as distributed ledger and economic benefits, each represented with an icon and brief description, set against a clean background.
Strategic Planning
Technology & Software
Discusses the critical considerations for applying blockchain technology, focusing on aspects like economic benefits and trust absence. Useful for strategic discussions on where blockchain can be effectively implemented.
blockchain, criteria, application, distributed ledger, trust
Linear Flow
McKinsey
Saved
Presents a column chart comparing the average weekly study hours of students in Nigerian public schools to those in various other countries, highlighting the educational challenges in Nigeria.
Strategic Planning
Education & Training
Analyzes the limitations in study hours faced by students in Nigerian public schools due to inadequate power supply, using international benchmarks to underscore the need for infrastructural improvements like solar power installations.
education, Nigeria, study hours, international comparison, public schools, power supply, benchmarks
Multiple Chart
BCG
Saved
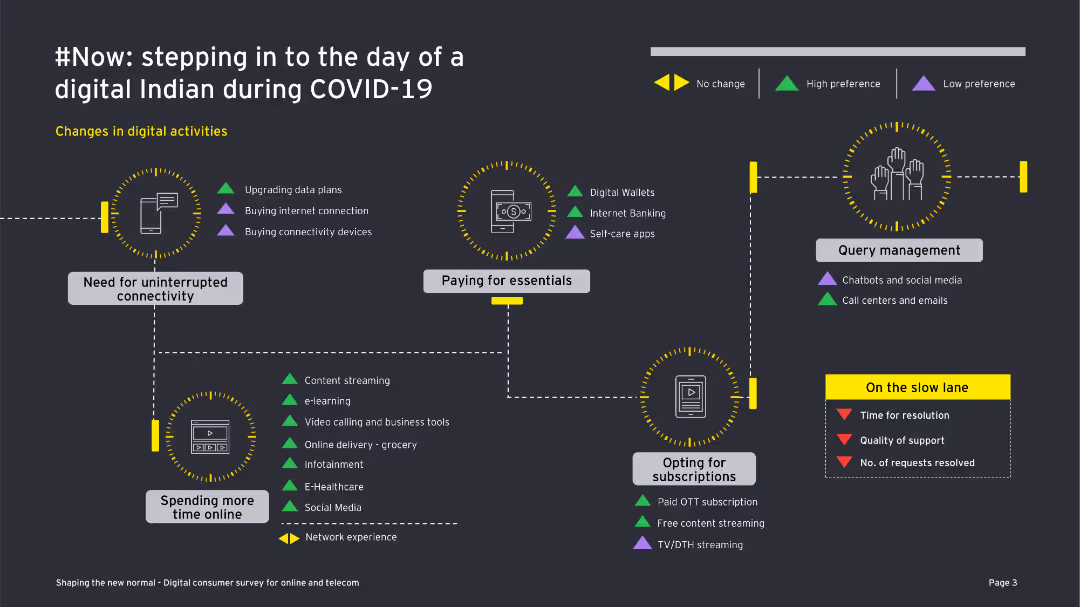
This slide contains a flowchart showing changes in digital activities with icons and directional arrows. The visual elements are moderately detailed.
Market Analysis and Trends
Telecommunications
The slide illustrates the shift in digital activities of Indian consumers during COVID-19, highlighting needs for connectivity and preferences for services.
digital activities, COVID-19, consumer behavior, connectivity, digital wallets, internet banking, e-learning, subscriptions, social media, customer support
Diagram
EY
Saved
Features detailed bar charts with industry comparisons, textual annotations, and legends.
Operational Efficiency
Energy & Utilities
Shows energy savings across industries by implementing sustainable practices, emphasizing cost reduction.
Energy savings, sustainability, industry comparison, operational efficiency
Multiple Chart
McKinsey
Saved
Left side features three percentage boxes, right side has a column chart and text
Risk Assessment and Management
Financial Services
Discussion on new working groups, data guidelines, and human roles in managing generative AI security risks
AI security, data guidelines, working groups, InfoSec
Mixed Chart
Gartner
Saved
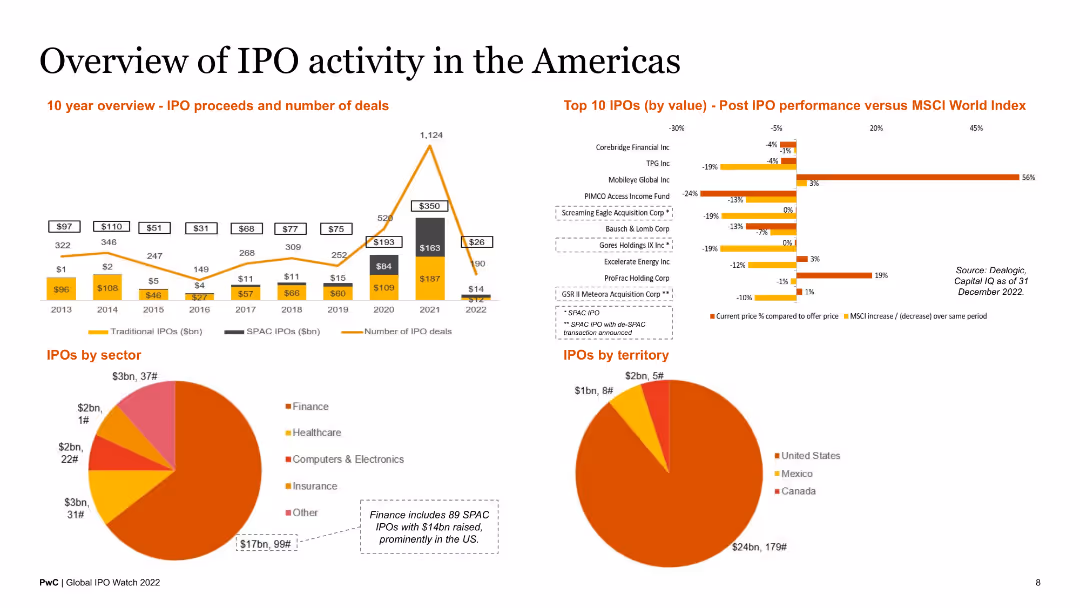
This slide includes a 10-year overview of IPO proceeds and number of deals, a bar chart of top 10 IPOs by value, and pie charts of IPOs by sector and territory. The layout is balanced with a mix of charts and brief text descriptions.
Market Analysis and Trends
Financial Services
The slide provides a comprehensive overview of IPO activity in the Americas, including historical data, top IPOs, and sector and territorial distribution. It is designed for market analysts and investors.
IPO activity, Americas, top IPOs, sector analysis, territorial overview
Multiple Chart
PwC/Strategy&
Saved
Previous
Next
If nothing, comes up, please save your slides first
Create a FREE account to continue browsing
Receive Instant Access to 1,000+ slides from companies like McKinsey, Google, and Goldman Sachs
First Name
Last Name
Email
Password
I agree to all
Terms & Privacy Policy
Thank you! Your submission has been received!
Oops! Something went wrong while submitting the form.
Have an account?
Sign in
Column Chart
Heatmap
Chevron
Org Chart
Infographic
Callouts
Timeline
List
Graphic
Picture
Process Flow
Diagram
Paragraph
Map
Table
Framework
Subtitle
Takeaway Box
Icon
Other Chart
Radar Chart
Waterfall Chart
Mekko Chart
Pie Chart
Scatter Plot
Line Chart
Bar chart
Bullet points