My Account
My Slides
Search by Category
Templates
View All Templates
Download Template Slides
Leave Feedback
Login
Logout
Get Started
Browse all Slides
Browse all Slides
Create a FREE Account
Instant access to 1,000+ real slides from top companies like McKinsey, BCG, Goldman Sachs, Google and many more!
First Name
Last Name
Email
Password
I agree to all
Terms & Privacy Policy
Thank you! Your submission has been received!
Oops! Something went wrong while submitting the form.
Have an account?
Sign in
Saved Slides
The slide features the Citigroup logo and mentions the event, "Investor Day," set against a blue and white background with a dotted pattern.
Corporate Finance and Valuation
Financial Services
Serves as the introductory slide for Citigroup's Investor Day presentation, setting the stage for corporate finance and valuation discussions.
Investor Day, Citigroup, Introduction, Corporate Event, Finance, Valuation, Presentation, Corporate Communication
Title
Citigroup
Saved
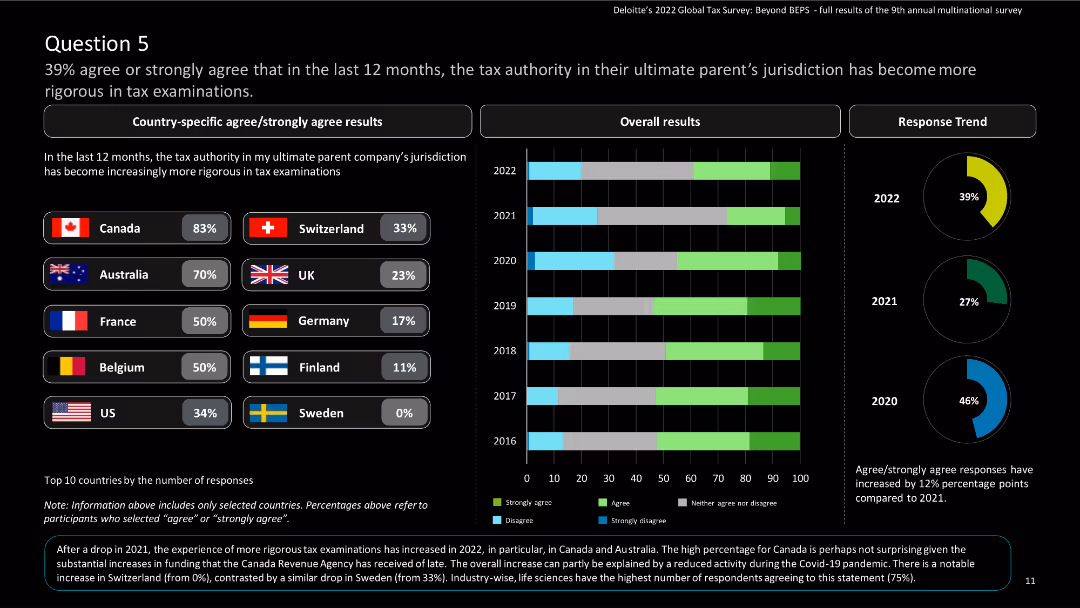
The slide features country-specific results and a column chart showing overall and response trend results over the years.
Regulatory and Compliance
Financial Services
The slide highlights the increasing rigor of tax examinations by the tax authority in the parent company’s jurisdiction.
Tax examinations, rigor, global tax, Deloitte, agree, strongly agree, survey, multinational
Multiple Chart
Deloitte
Saved
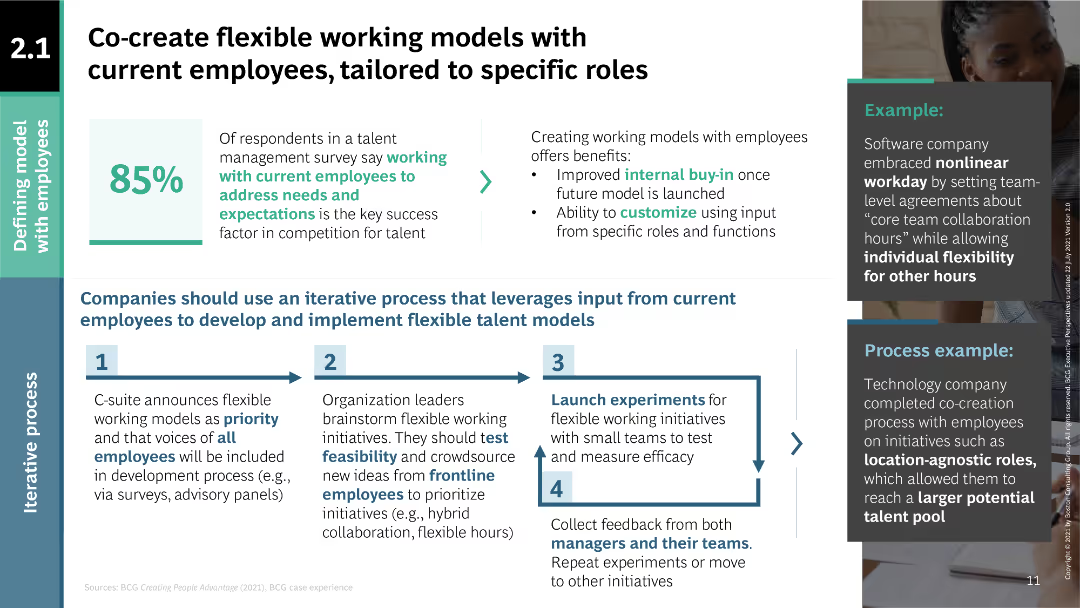
Process flow diagram for creating flexible working models; text explaining benefits and steps for implementation.
Human Resources and Talent Management
Professional Services
Outlines a process for developing flexible working models by involving current employees, highlighting benefits like internal buy-in and role-specific customization.
flexible working models, employee involvement, role-specific, internal buy-in, customization, iterative process, talent management
Linear Flow
BCG
Saved
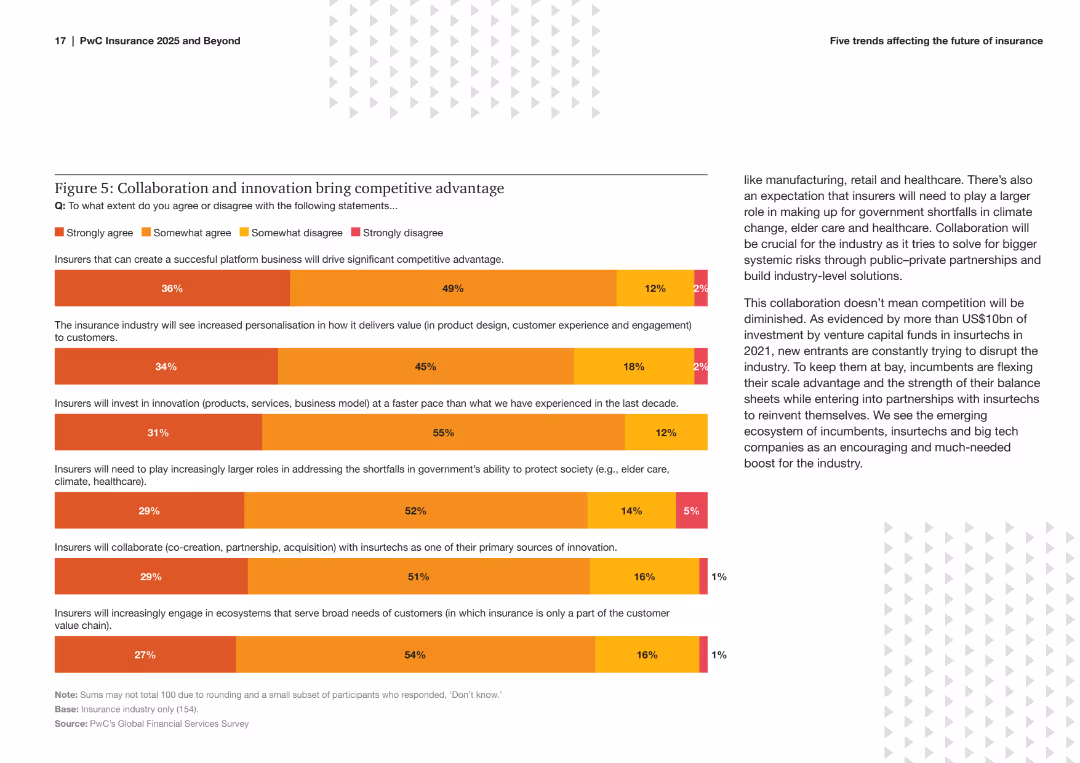
The slide includes a bar chart showing survey results on the extent to which insurers agree with statements about collaboration, innovation, and competitive advantage. It uses color coding to differentiate levels of agreement.
Strategic Planning
Financial Services
This slide highlights survey findings on the importance of collaboration and innovation in gaining competitive advantage within the insurance industry. It presents the percentage of respondents agreeing with various strategic statements.
Collaboration, Innovation, Competitive Advantage, Insurance, Survey, Strategic Planning, Bar Chart, Trends, Industry Insights, Analysis
Mixed Chart
PwC/Strategy&
Saved
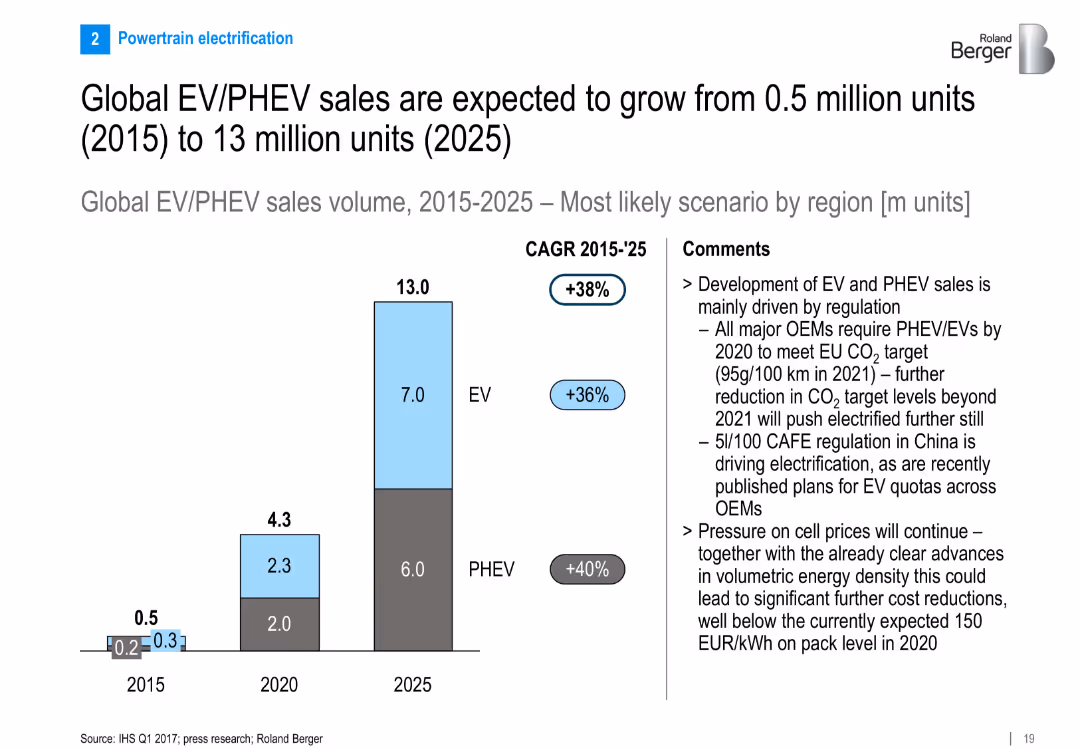
Bar chart visualizing EV/PHEV sales growth from 2015 to 2025; CAGR annotated; right side contains drivers such as regulation and cost reduction
Market Analysis and Trends
Industrial & Manufacturing
Forecasts rapid global growth of EV and PHEV sales, driven largely by regulations in EU and China. Details CAGR and suggests that battery price and density improvements will drive further adoption.
EV sales, PHEV growth, 2025 forecast, electrification, regulation, CO2 targets, battery cost, CAGR
Mixed Chart
Roland Berger
Saved
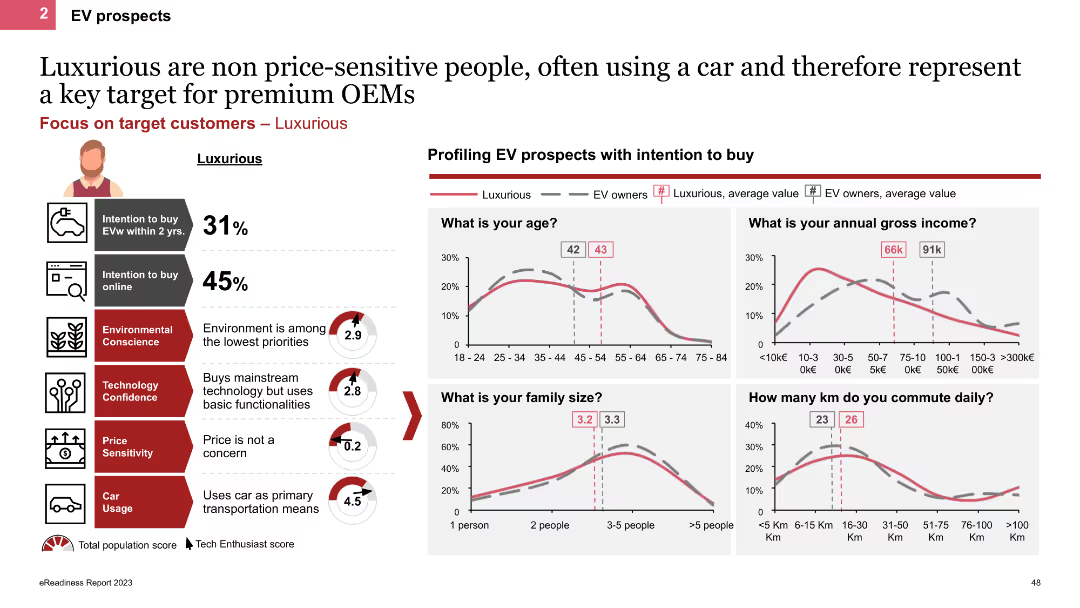
The slide profiles Luxurious personas using line charts and icons, showing demographic details like age, income, and family size. It highlights their high car usage and low price sensitivity, with charts comparing their characteristics to other EV owners.
Customer and Market Segmentation
Transportation & Logistics
This slide describes Luxurious personas, emphasizing their high income, frequent car usage, and lack of price sensitivity. It provides demographic comparisons and insights into their EV purchase behaviors and preferences.
EV prospects, Luxurious, line charts, demographics, high income
Multiple Chart
PwC/Strategy&
Saved
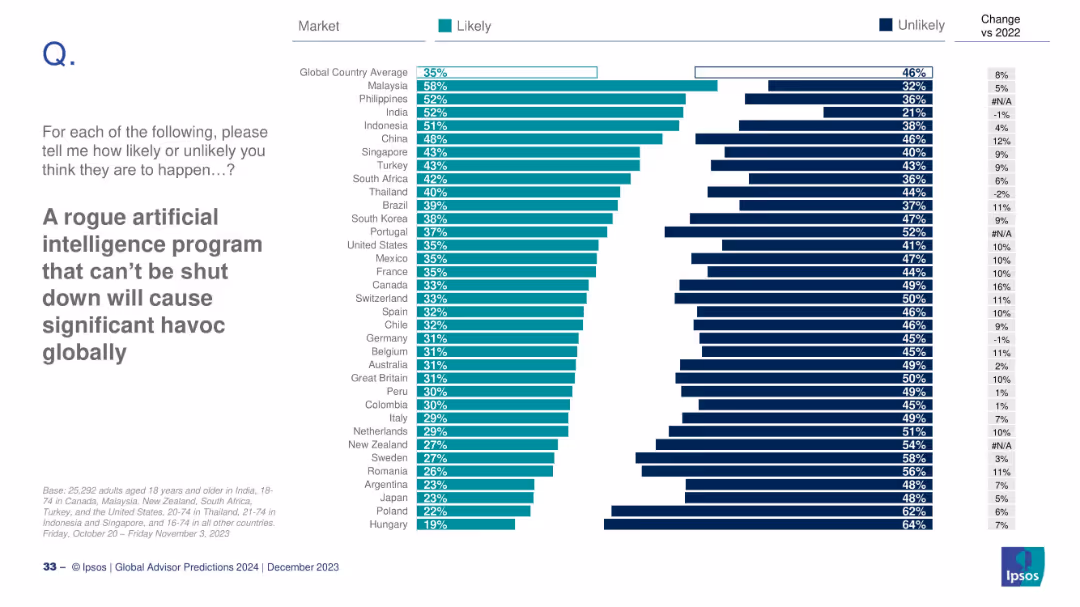
Horizontal bar chart with countries ranked by likelihood of AI-caused chaos; right side shows change vs 2022.
Risk Assessment and Management
Artificial Intelligence
This slide evaluates global concerns about uncontrollable AI causing havoc. Malaysia and Philippines rank highest, while Hungary and Poland rank lowest. A comparison with 2022 perceptions is included, showing changes in sentiment for each country.
AI risk, rogue AI, global concern, survey, Ipsos, public opinion, 2024 prediction
Mixed Chart
IPSOS
Saved
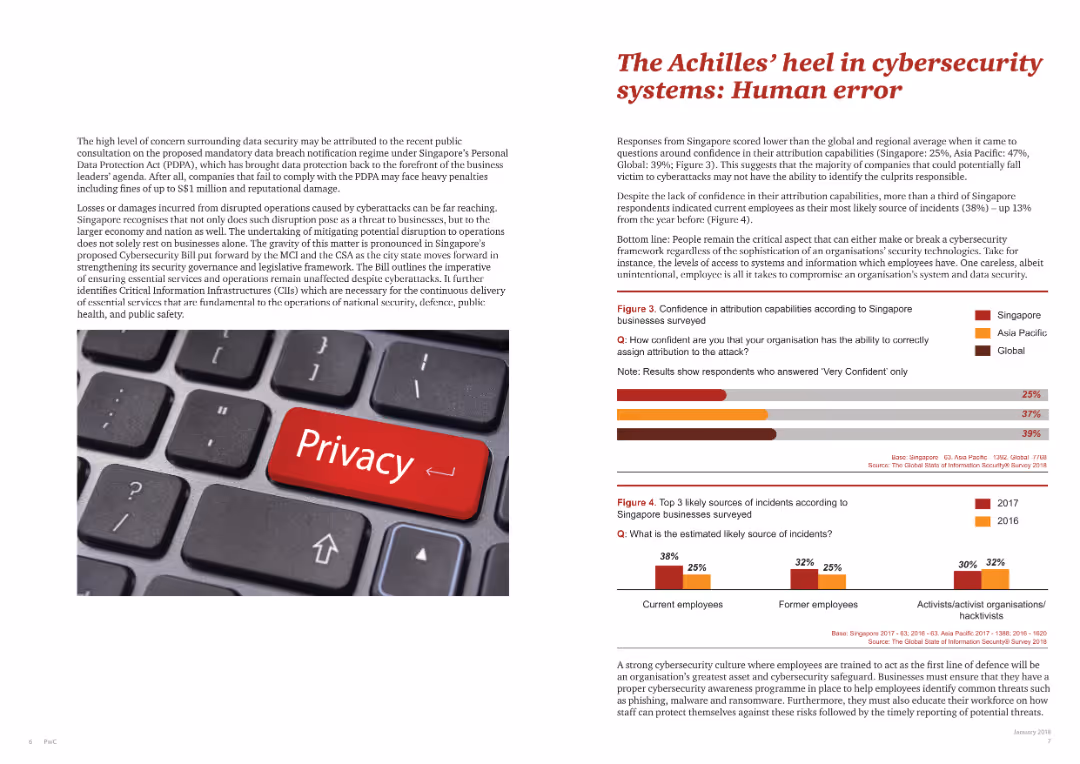
Text-heavy slide with supporting graphics, including a keyboard with a "Privacy" key, and bar charts showing data on human error in cybersecurity.
Risk Assessment and Management
Telecommunications
Discusses how human error is a significant vulnerability in cybersecurity systems, based on survey responses and statistical data.
human error, cybersecurity, vulnerability, survey data, privacy
Multiple Chart
PwC/Strategy&
Saved
Icons detailing significant sustainability milestones and regional collaboration efforts within SEA nations.
Industry Overview
Government & Public Sector
Reviews recent sustainability progress and ongoing challenges in Southeast Asia, emphasizing the need for further efforts towards achieving Net Zero.
SEA, sustainability, government actions, regional collaboration, Net Zero
Header Vertical
Bain
Saved
This slide features a column chart and a numeric list detailing the impact of logistics on e-commerce deals. The colors used differentiate the segments clearly, with annotations providing insights on investment trends.
Market Analysis and Trends
Transportation & Logistics
Analyzes how logistics investments have become a major driver in e-commerce deal values, with a notable surge in H1 2021. It also touches on the growing trend of non-marketplace investment opportunities within the e-commerce realm.
E-commerce, Logistics, Investment Trends, SEA
Mixed Chart
Bain
Saved
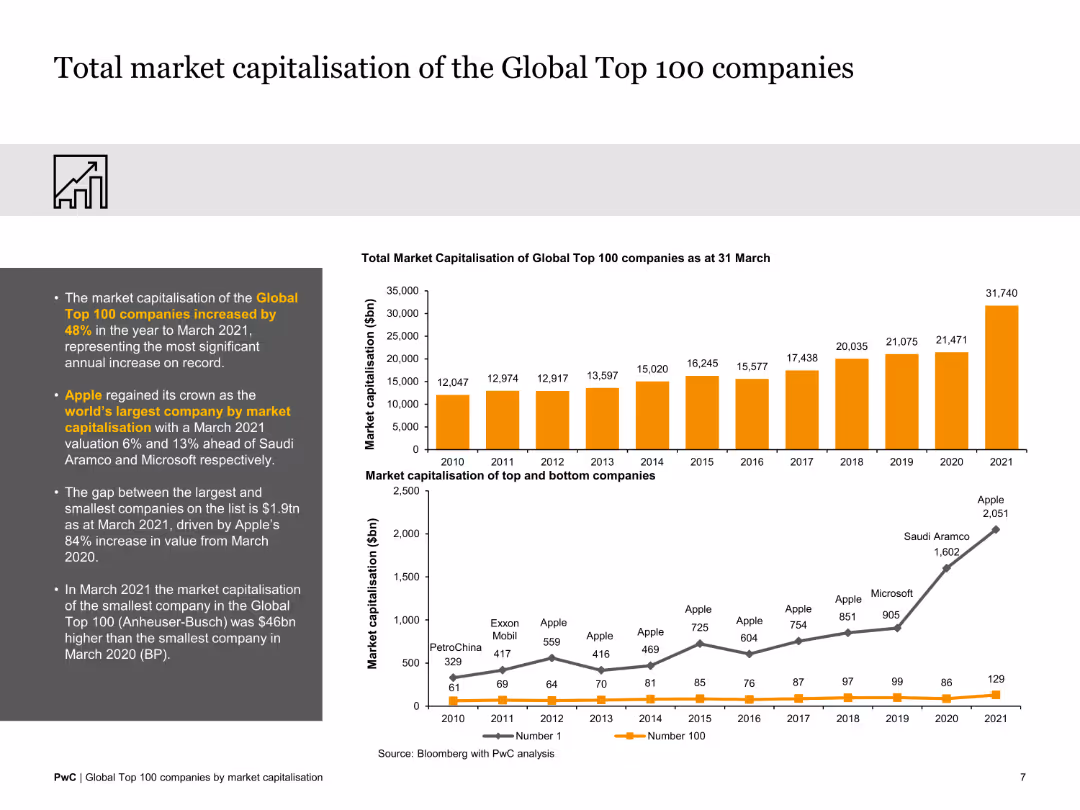
The slide contains two column charts showing total market capitalization data over the years, with text explanations on the side. The design is clear and data-centric.
Market Analysis and Trends
Financial Services
This slide highlights the market capitalization growth of the top 100 companies from 2010 to 2021, emphasizing the significant increase observed in the recent years.
market capitalization, growth, top companies, data analysis, 2010-2021, financial trends
Multiple Chart
PwC/Strategy&
Saved
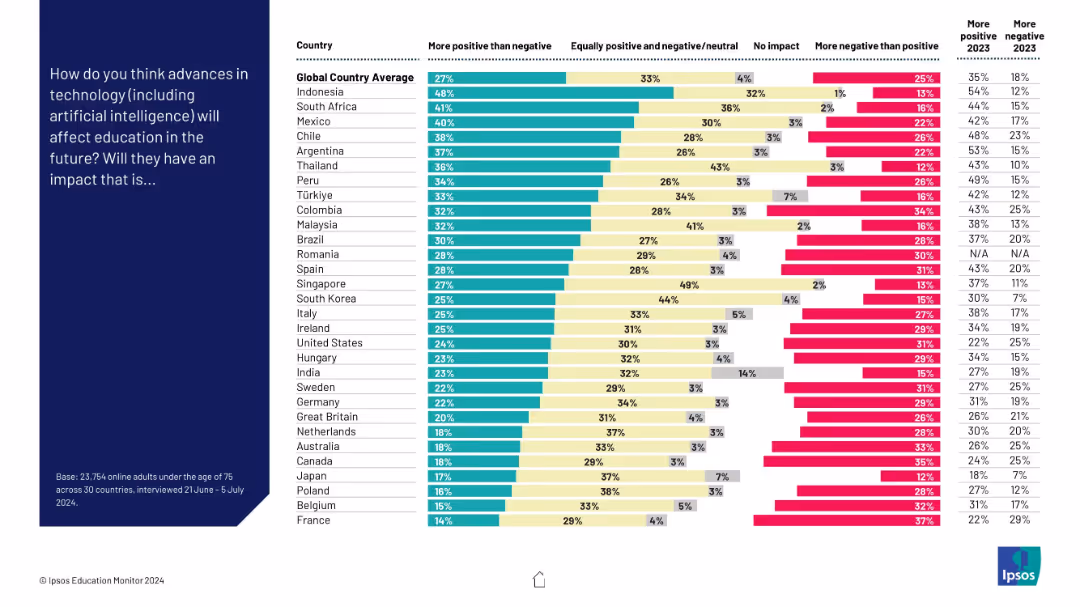
Vertical bar chart on the right showing responses from various countries, with segmented bars (more positive, neutral, no impact, more negative); dark blue left panel with question text
Market Analysis and Trends
Education & Training
The slide presents survey results across 30 countries on public perceptions of how technology (including AI) will affect education. Most countries lean toward a positive view, but significant variation exists, with some populations more skeptical.
education, technology, AI, perception, global, survey, positivity, negativity, impact
Mixed Chart
IPSOS
Saved
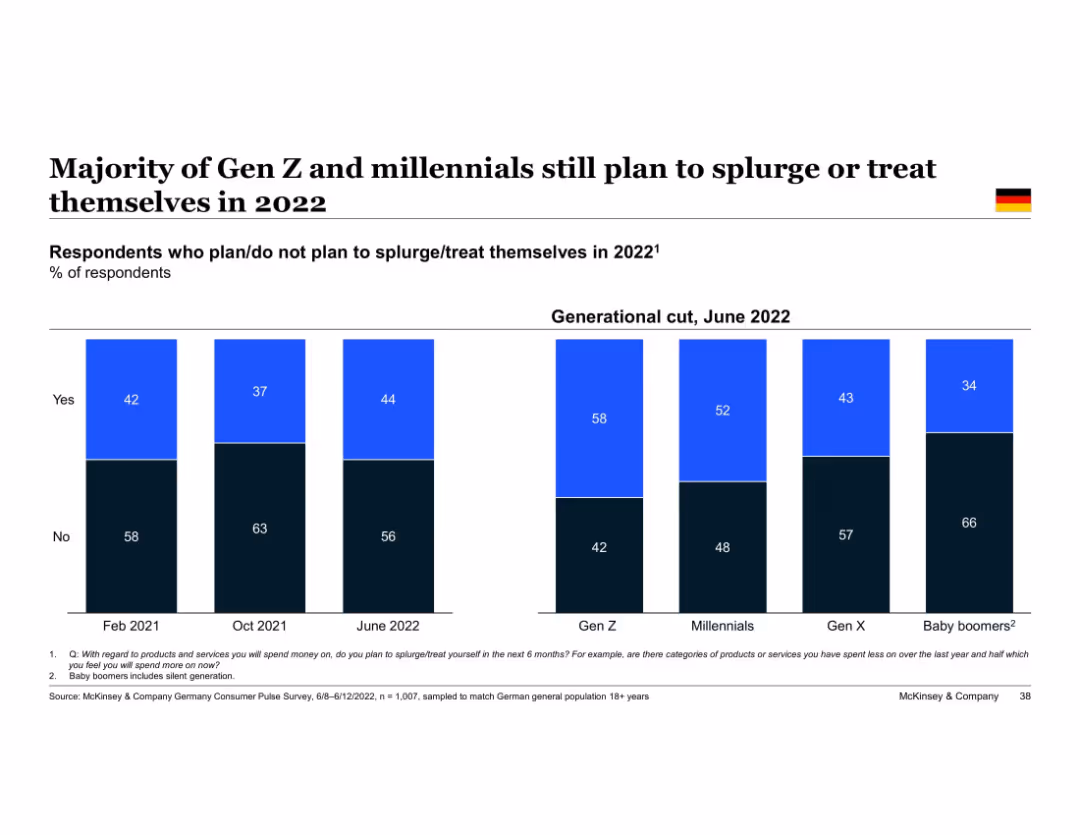
Bar chart with generational breakdown; sections labeled “Yes” and “No”
Market Analysis and Trends
Consumer Goods
Indicates that younger generations (Gen Z and Millennials) are more likely to plan for splurging or treating themselves in 2022. Tracks changes in intent across three survey waves and splits by generation.
splurging, Gen Z, millennials, consumer behavior, 2022 intent, McKinsey, Germany, spending patterns
Single Chart
McKinsey
Saved
Slide displays a line graph showing an epidemic curve with stages marked by circles, and a dotted line representing potential future scenarios, set against a dark background.
Strategic Planning
Healthcare & Pharmaceuticals
Discusses the uncertainty in long-term COVID-19 spread and potential outcomes depending on public health decisions. Useful for strategic planning in healthcare and government policy-making.
COVID-19, epidemiology, healthcare capacity, epidemic curve, public health, future scenarios
Single Chart
McKinsey
Saved
The slide includes a series of bar charts showing the correct, wrong, and 'don't know' responses to various statements about crypto assets for 2023 and 2022.
Human Resources and Talent Management
Financial Services
This slide evaluates the general knowledge of crypto assets, presenting correct and incorrect beliefs among respondents, and comparing changes from 2022 to 2023. It helps in assessing overall awareness.
Crypto, Knowledge, Awareness, Education, Comparison
Mixed Chart
IPSOS
Saved
This slide is text-dominant with a straightforward layout on a dark background, directing leaders' focus to the benefits and uncertainties associated with engaging with edge computing trends.
Technology and Digital Transformation
Technology & Software
The slide aims at guiding leaders on engaging with edge computing trends, outlining the potential benefits such as improved data latency and compliance, and risks like business model challenges and technical hurdles. It serves as a decision-making framework for leaders to assess opportunities and manage risks in adopting edge computing technologies.
Edge Computing, Leadership Considerations, Business Risks
Boxed
McKinsey
Saved
Line chart depicting the ISG forecast for the 10-year US Treasury yield from 2019 to 2024, highlighting key rate projections.
Market Analysis and Trends
Financial Services
Discusses the expected decline in the US 10-year Treasury yield to 3.5-3.9% by year-end 2024, impacting intermediate Treasury bonds and duration risk over credit risk.
interest rates, US Treasury, forecast, bonds, financial market
Mixed Chart
Goldman Sachs
Saved
A column chart exhibits the SEA travel GMV ($B) across airlines, hotels, and vacation rentals. It includes growth percentages and CAGR data. The slide's blue and white theme aids in data clarity.
Market Analysis and Trends
Hospitality & Tourism
This slide offers insights into the SEA online travel industry's post-pandemic recovery, comparing segments like airlines, hotels, and vacation rentals, with predictions on future trends.
online travel, SEA, pandemic recovery, airlines, hotels, vacation rentals, CAGR, market trends
Mixed Chart
Bain
Saved
Moderate complexity with bullet points, icons, and text
Technology and Digital Transformation
Environmental Services & Sustainability
This slide showcases examples of companies and technologies that have made a significant impact on sustainable consumption. It is beneficial for discussing successful cases of innovation in sustainability, highlighting how various sectors are integrating green technology.
Innovation, Case Studies, Green Technology, Sustainability, Consumption
Header Vertical
McKinsey
Saved
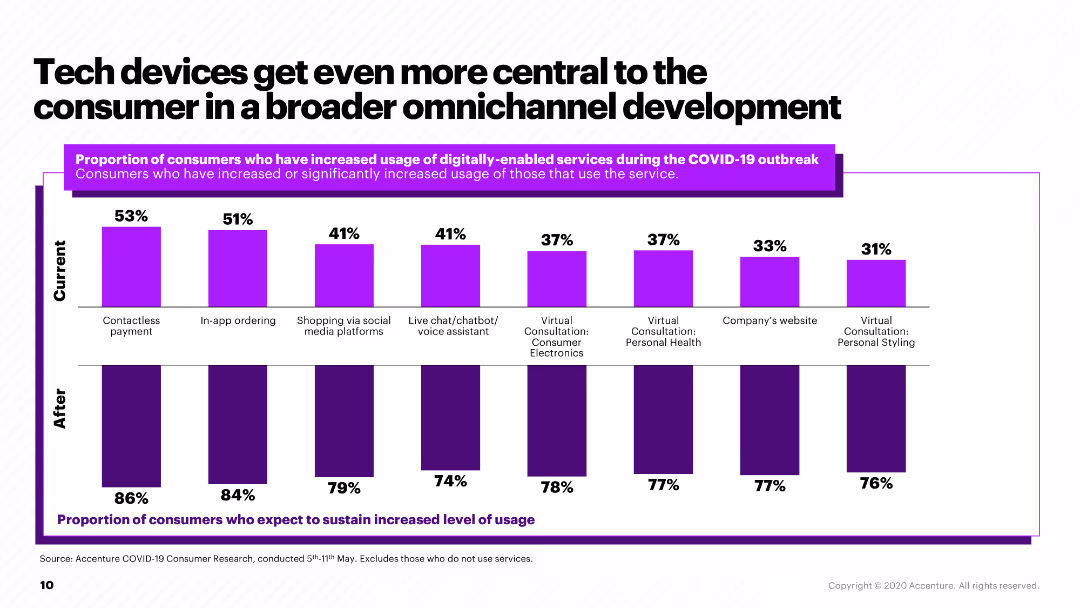
The slide features a column chart showing the increase in usage of various digitally-enabled services during and after the COVID-19 outbreak.
Market Analysis and Trends
Retail & E-commerce
The slide highlights the growth in the use of digital services, such as contactless payments and in-app ordering, during the COVID-19 pandemic and projected continuation.
digital services, COVID-19, consumer electronics, omnichannel, tech adoption
Multiple Chart
Accenture
Saved
The slide includes a bar chart comparing the percentage of respondents expressing various concerns about digital health adoption in 2021 versus 2022, such as patient privacy and solution incompatibility.
Risk Assessment and Management
Healthcare & Pharmaceuticals
The slide addresses the growing concerns regarding digital health adoption, highlighting issues like increased concerns about patient privacy, incompatibility between digital solutions, and the shortage of talent for developing and implementing these solutions.
Digital adoption, concerns, patient privacy, compatibility
Single Chart
LEK
Saved
A bar chart comparing Millennials and Gen Z on their views about climate change, with agree/disagree metrics on whether it is too late to repair the damage.
Market Analysis and Trends
Environmental Services & Sustainability
The slide examines the views of Millennials and Gen Z on the possibility of reversing climate change damage, comparing their levels of agreement and disagreement.
Climate change, Millennials, Gen Z, agreement, disagreement, environmental views, damage reversal, sustainability, comparison
Mixed Chart
Deloitte
Saved
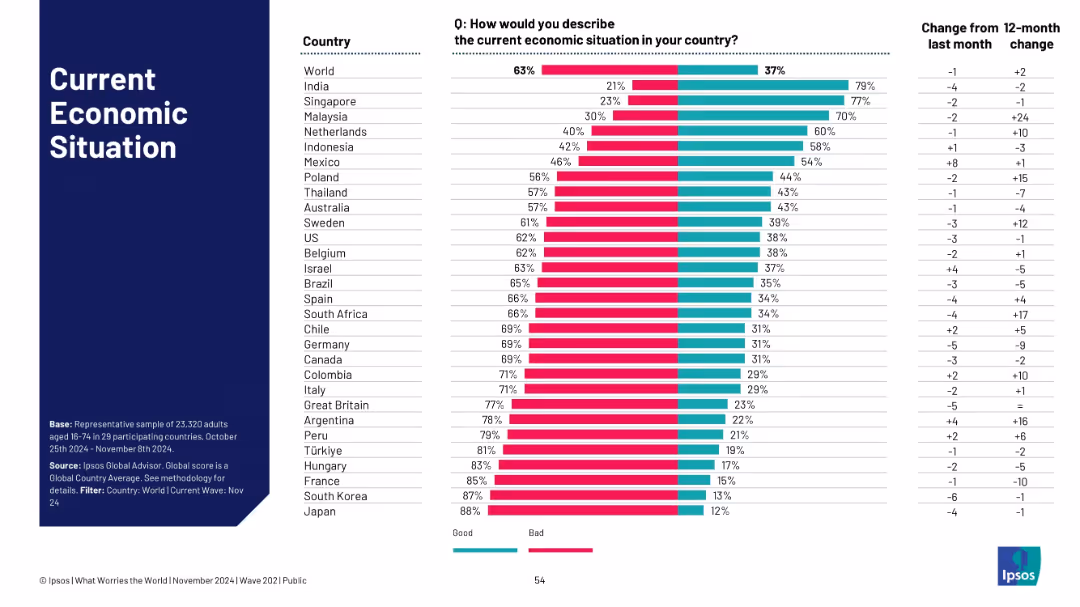
Bar chart of countries with % seeing economy as good or bad; stacked bar format; includes time-based changes.
Financial Performance
Financial Services
Assesses global sentiment on national economic conditions. The slide contrasts “good” vs. “bad” perceptions by country. India and Singapore show optimism, while Japan and South Korea remain pessimistic. Time-tracked changes show evolving sentiment.
economic sentiment, perception, financial outlook, Ipsos, optimism, pessimism, survey, recovery, inflation, public opinion
Single Chart
IPSOS
Saved
A column chart displays the spread analysis for various financial instruments, with high, low, and median values. Each category is color-coded.
Financial Performance
Financial Services
The slide analyzes spread data for different financial instruments over time, providing insights into current and historical spreads in basis points.
Spread Analysis, Financial Instruments, Basis Points, Historical Data
Mixed Chart
Morgan Stanley
Saved
The slide uses a timeline to show key phases from 2022 to 2025 onwards, with bullets detailing specific actions and goals for each phase.
Strategic Planning
Financial Services
Presents the strategic roadmap for transforming Credit Suisse, highlighting deleveraging, cost reduction, and growth initiatives to restore stakeholder trust.
roadmap, Credit Suisse, strategic planning, cost reduction, stakeholder trust
Linear Flow
Credit Suisse
Saved
Previous
Next
If nothing, comes up, please save your slides first
Create a FREE account to continue browsing
Receive Instant Access to 1,000+ slides from companies like McKinsey, Google, and Goldman Sachs
First Name
Last Name
Email
Password
I agree to all
Terms & Privacy Policy
Thank you! Your submission has been received!
Oops! Something went wrong while submitting the form.
Have an account?
Sign in
Column Chart
Heatmap
Chevron
Org Chart
Infographic
Callouts
Timeline
List
Graphic
Picture
Process Flow
Diagram
Paragraph
Map
Table
Framework
Subtitle
Takeaway Box
Icon
Other Chart
Radar Chart
Waterfall Chart
Mekko Chart
Pie Chart
Scatter Plot
Line Chart
Bar chart
Bullet points