My Account
My Slides
Search by Category
Templates
View All Templates
Download Template Slides
Leave Feedback
Login
Logout
Get Started
Browse all Slides
Browse all Slides
Create a FREE Account
Instant access to 1,000+ real slides from top companies like McKinsey, BCG, Goldman Sachs, Google and many more!
First Name
Last Name
Email
Password
I agree to all
Terms & Privacy Policy
Thank you! Your submission has been received!
Oops! Something went wrong while submitting the form.
Have an account?
Sign in
Saved Slides
The slide features a detailed table with additional small bar charts and icons, representing different industries like Consumer, Automotive, and Energy. It includes textual content and a summary area.
Industry Overview
Technology & Software
This slide presents the potential value digital transformation could unlock across various industries by 2025, estimating the societal and industry-specific financial impacts, with additional insights on CO2 emissions reduction and job implications.
digital transformation, industry impact, CO2 emissions, job creation, financial analysis
Single Chart
Accenture
Saved
Column chart comparing economic expectations of study respondents for 2018 and 2019, with categories for upturn, boom, downturn, and recession.
Market Analysis and Trends
Financial Services
The slide analyzes the shifting economic expectations of participants in the 10th Operations Efficiency Radar, comparing sentiments from 2018 and 2019. It highlights the growing anticipation of an economic downturn among respondents, reflecting changes in business confidence and economic outlook.
Economic Expectations, Operations Efficiency, Downturn
Mixed Chart
Roland Berger
Saved
Bar charts and a pie chart detail the status and origins of forcibly displaced people, with emphasis on Syria and Turkey.
Market Analysis and Trends
Government & Public Sector
Highlights the global refugee crisis, focusing on the scale of displacement from Syria.
displacement, refugees, Syria, Turkey, crisis
Multiple Chart
Roland Berger
Saved
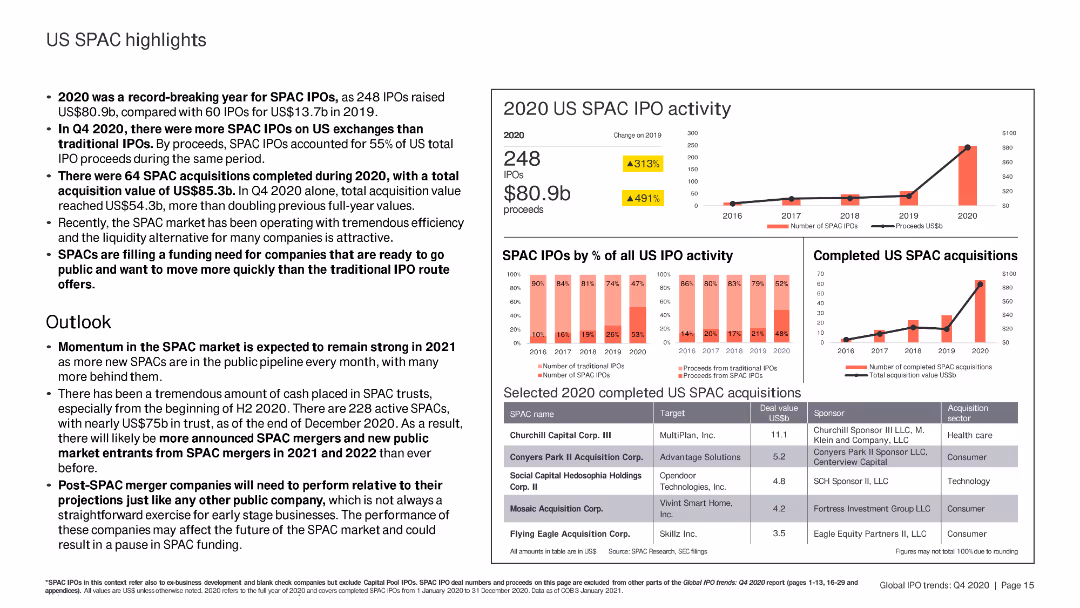
The slide includes column charts and bar charts summarizing US SPAC IPO activity, completed SPAC acquisitions, and selected SPAC deals in 2020.
Market Analysis and Trends
Financial Services
The slide highlights the record-breaking year for US SPAC IPOs in 2020, detailing the number of SPACs, total proceeds, and notable completed acquisitions. Future market outlook is also discussed.
SPAC IPO, 2020, acquisitions, proceeds, market
Multiple Chart
EY
Saved
Image and text layout explaining three strategic steps: Get a head start, Embed value-based models, and Amplify benefits with larger partners.
Strategic Planning
Professional Services
Advises on strategic managed services engagement for investment, emphasizing early involvement and collaboration with large partners for operational improvements.
strategy, managed services, investment, benefits, partners
Linear Flow
Accenture
Saved
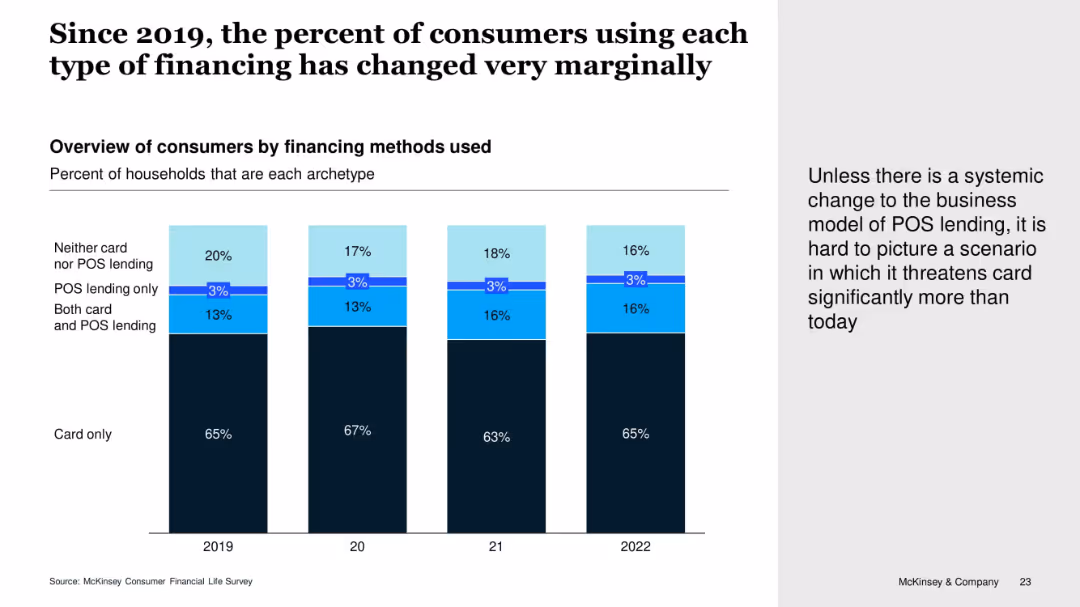
Vertical stacked bar chart showing consumer financing preferences by year (2019–2022), segmented by card use and POS lending combinations. Includes callout text on the right.
Customer and Market Segmentation
Financial Services
The slide shows little change over time in the types of consumer financing used. The majority continue to rely solely on cards, while POS lending adoption remains minimal. The narrative suggests POS lending isn't significantly threatening card use without a structural change.
POS Lending, Credit Cards, Consumer Behavior, Lending Trends, McKinsey Survey
Mixed Chart
McKinsey
Saved
The slide features a large title at the top with three proportional circle diagrams beneath, showing the increasing number of internet users from 2019 to 2022. It includes percentages and numerical data, labeled clearly to show growth over the years. The colors range from light to dark blue.
Industry Overview
Technology & Software
This slide visually demonstrates the growth in the number of internet users over a three-year span, highlighting the impact of the pandemic on digital adoption. It's useful for illustrating market growth in technology use and for identifying digital expansion trends in Southeast Asia.
internet users, SEA, pandemic, market growth, technology adoption, digital expansion, 2019-2022, circle diagrams
Multiple Chart
Bain
Saved
The slide includes a pie chart and column charts, with text describing the evolution of ESG awareness.
Regulatory and Compliance
Environmental Services & Sustainability
This slide discusses how organizations are evolving in their focus on ESG risks, with statistics and survey results.
ESG, risks, evolution, awareness, survey
Single Chart
Deloitte
Saved
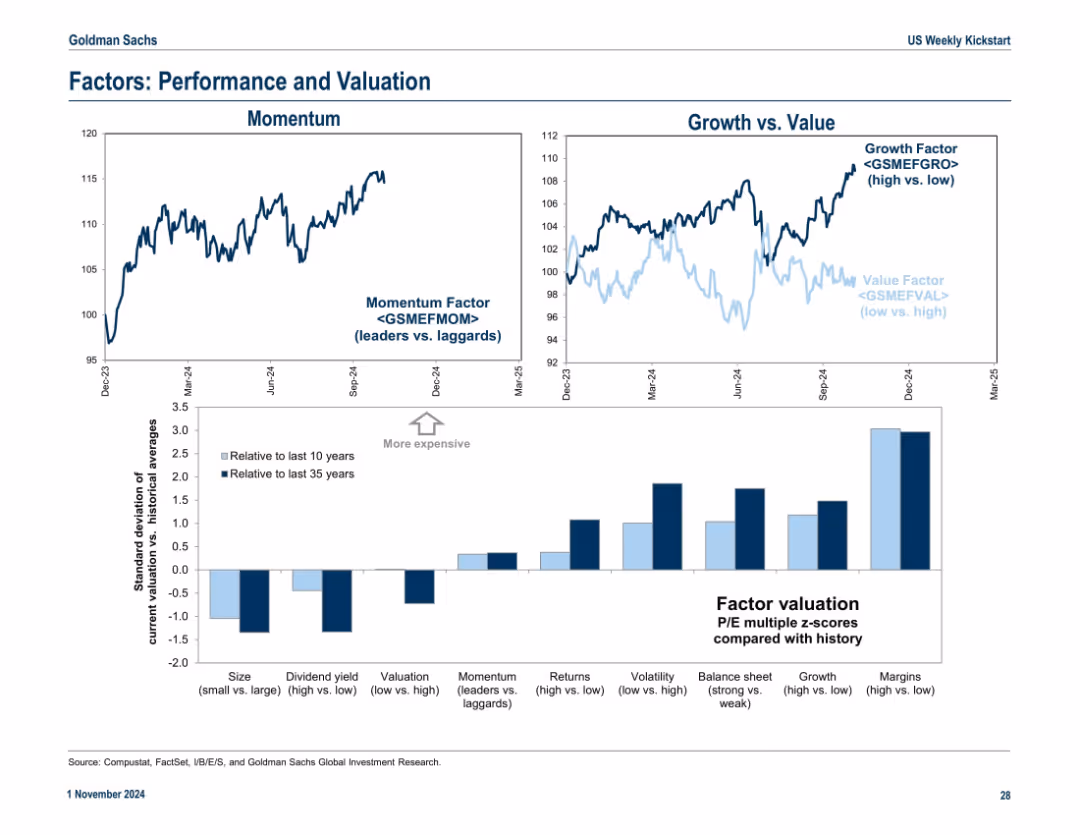
Combines three parts: momentum chart, growth vs. value chart, and a bar chart showing factor valuations against historical norms. Consistent font and axes styles.
Performance Metrics and KPIs
Financial Services
The slide compares key investment factors like momentum, growth vs. value, and other valuation factors. The lower chart uses Z-scores to measure deviation from long-term valuation averages across various factor categories.
momentum, growth, value, factor valuation, Z-score, returns, volatility, margins
Multiple Chart
Goldman Sachs
Saved
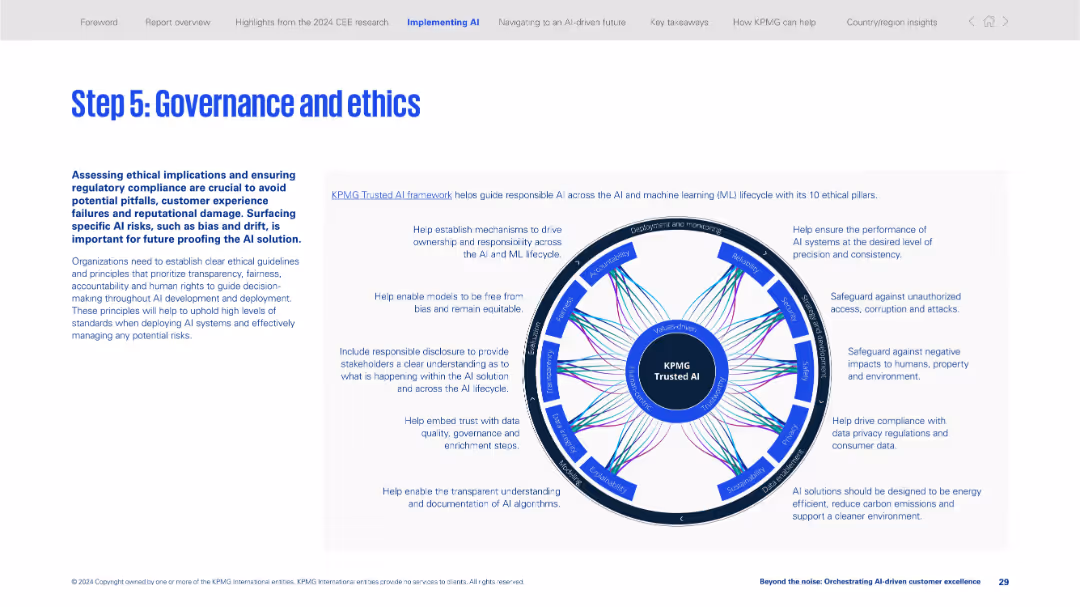
Two-section layout with explanatory text on left and a circular infographic on the right visualizing KPMG Trusted AI ethical pillars.
Regulatory and Compliance
Artificial Intelligence
Emphasizes the importance of ethics and governance in AI deployment. Introduces the KPMG Trusted AI framework and its 10 ethical pillars to ensure responsible, transparent, and compliant AI implementation.
AI ethics, governance, compliance, trusted AI, responsible AI, fairness, transparency, data security, bias, regulations
Framework
KPMG
Saved
Features comparative pie charts showing revenue breakdowns, efficiently comparing data pre- and post-acquisition.
Mergers and Acquisitions
Financial Services
Analyzes the geographical revenue impact of Faurecia's acquisition of Clarion, highlighting the strategic benefits and increased market presence in Asia, particularly with Japanese OEMs.
acquisition, revenue, market presence, Asia, automotive, OEMs
Multiple Chart
Deutsche Bank
Saved
The slide includes a bar chart comparing the LCOH evolution for blue, green, and brown hydrogen technologies from 2019 to 2030.
Market Analysis and Trends
Energy & Utilities
The slide forecasts that the costs of blue and green hydrogen will decline, closing the gap with brown hydrogen by 2030, as shown in the bar chart.
blue hydrogen, green hydrogen, LCOH, cost trends, 2030 forecast
Multiple Chart
Kearney
Saved
A graphic scale compares traits of a 'Stable Organisation' and an 'Adaptable Organisation' with colored circles denoting each trait's presence in an organization. There are icons representing different organizational qualities.
Strategic Planning
Professional Services
Compares behavioral traits between stable and adaptable organizations to prompt discussions on strategic planning and organizational adaptability within professional services.
adaptability, stable, organisation, strategic, planning, traits
Single Chart
Deloitte
Saved
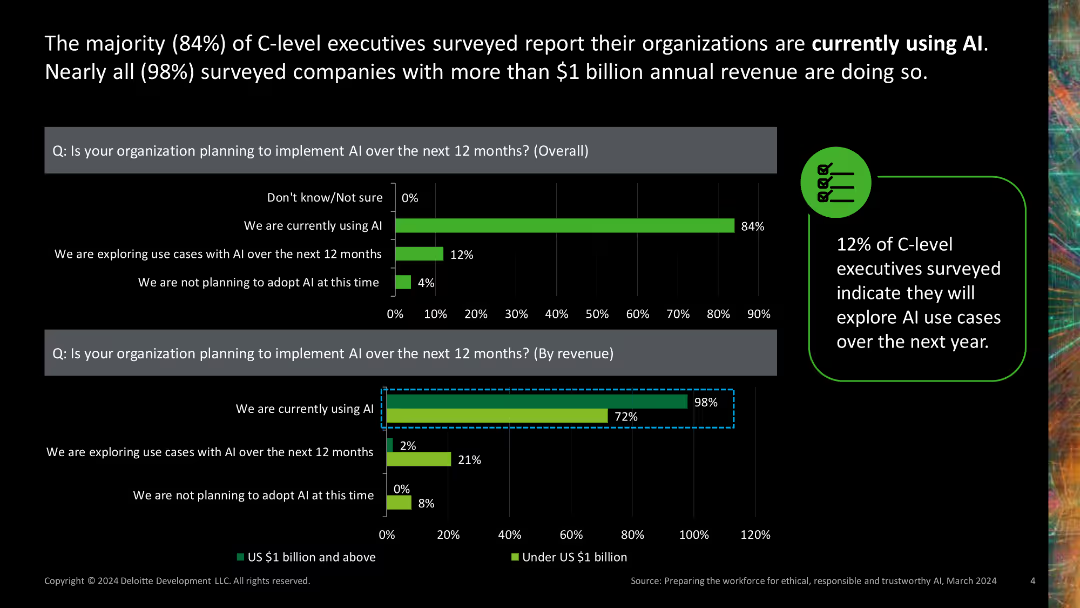
Two column charts showing AI adoption rates by overall and by revenue. Green bars with percentage values.
Market Analysis and Trends
Technology & Software
Presents data on the high rate of AI adoption among C-level executives and companies with significant annual revenue, indicating a trend towards widespread AI implementation.
AI adoption, C-level executives, revenue, market trends, technology
Multiple Chart
Deloitte
Saved
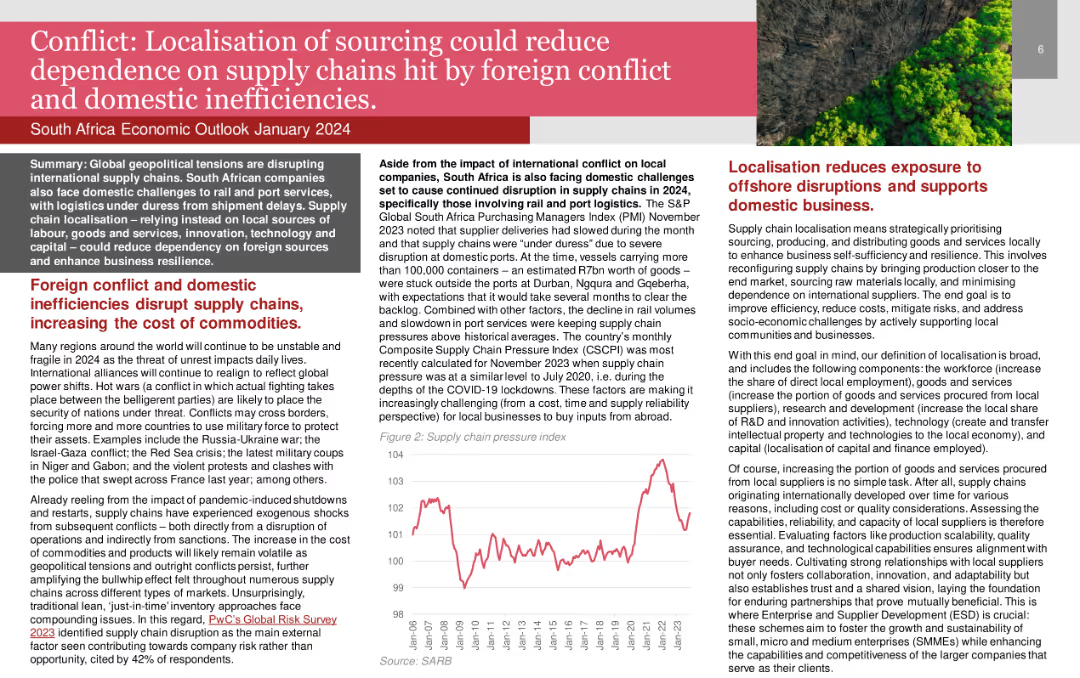
Line chart showing the Supply Chain Pressure Index over time.
Risk Assessment and Management
Transportation & Logistics
Highlights the benefits of localizing sourcing in South Africa to reduce reliance on disrupted international supply chains.
Localisation, Supply Chains, Conflict, Domestic Inefficiencies, South Africa
Mixed Chart
PwC/Strategy&
Saved
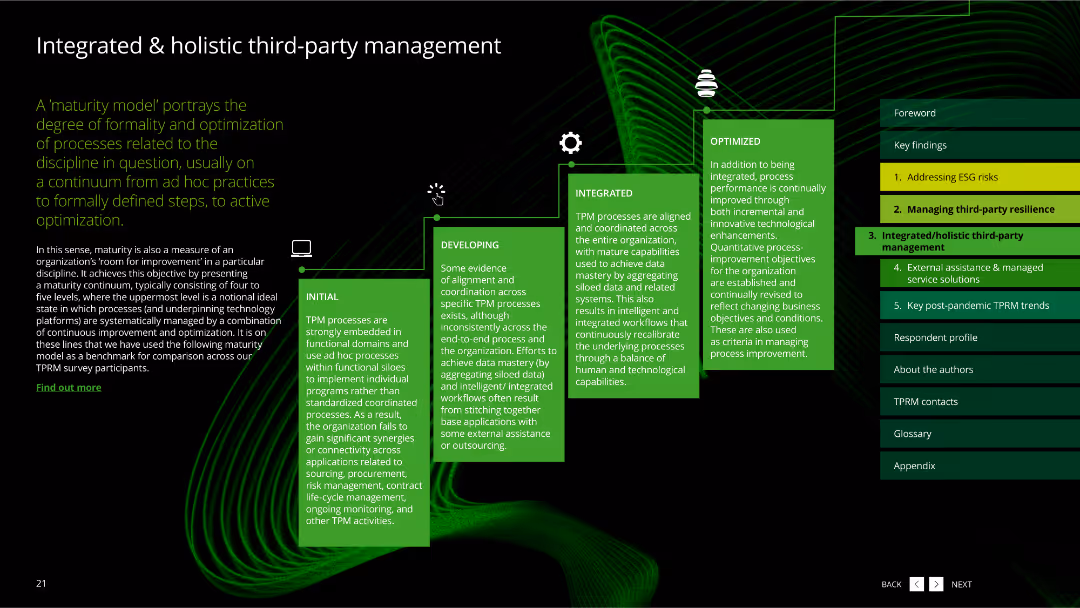
The slide features a dark background with a green wavy line pattern. It includes a flowchart with five green boxes describing the stages of third-party management maturity.
Risk Assessment and Management
Professional Services
The slide explains a maturity model for third-party management, portraying the degree of formality and optimization of processes from initial to optimized stages.
maturity model, third-party management, stages, process optimization, professional services
Linear Flow
Deloitte
Saved
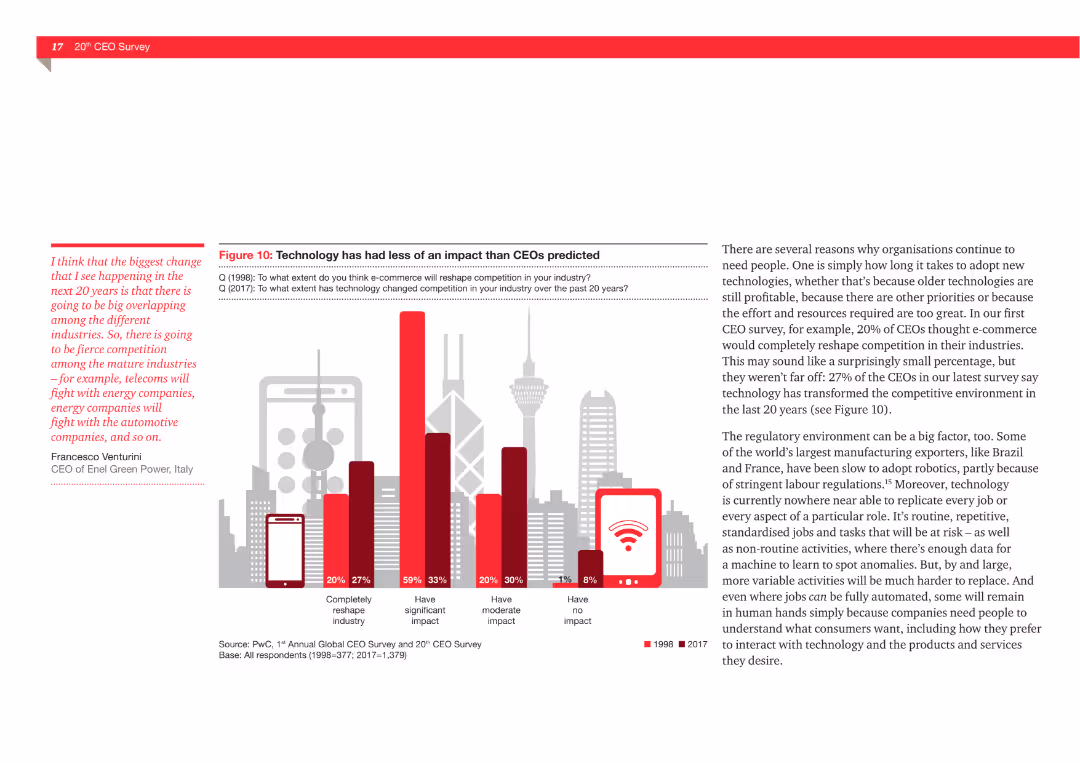
The slide features a column chart comparing CEOs' predictions from 1998 and 2017 about the impact of technology on competition, with categories like "significant impact" and "no impact."
Market Analysis and Trends
Technology & Software
This slide illustrates how CEOs' predictions about the impact of technology on competition have changed from 1998 to 2017. It shows that while many expected significant changes, the actual impact has been more moderate than anticipated.
Technology, impact, competition, predictions, CEOs, market analysis, trends
Mixed Chart
PwC/Strategy&
Saved
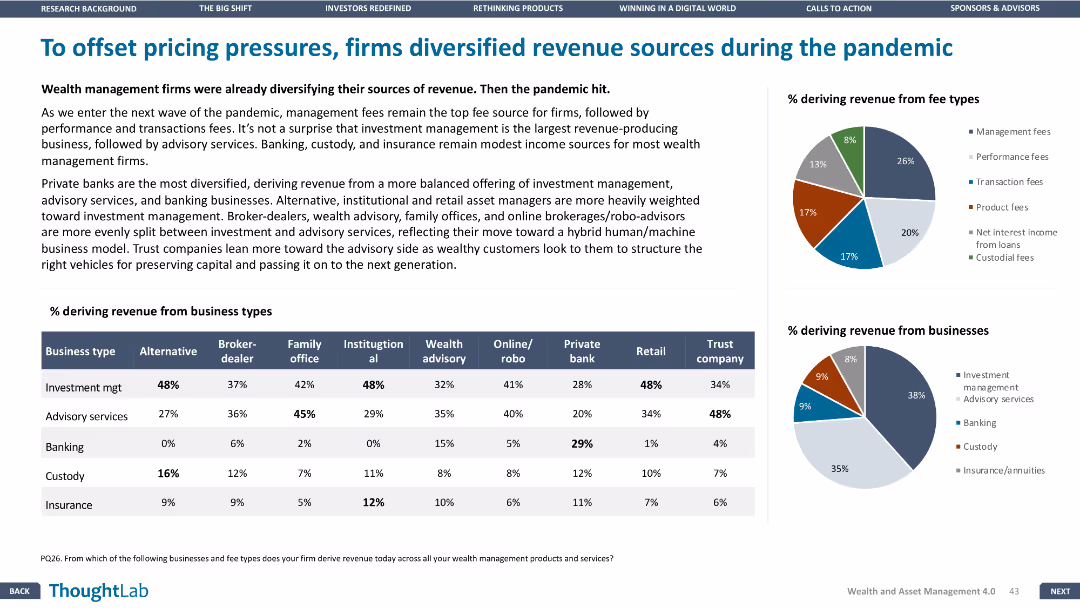
This slide has a column chart, pie charts, and a table. The layout is dense with multiple visual elements and minimal white space.
Strategic Planning
Financial Services
The slide discusses how wealth management firms diversified their revenue sources during the pandemic, with data showing the percentage of revenue from different business types and fee types.
Revenue, diversification, pandemic, wealth management, business types, fee types
Multiple Chart
Deloitte
Saved
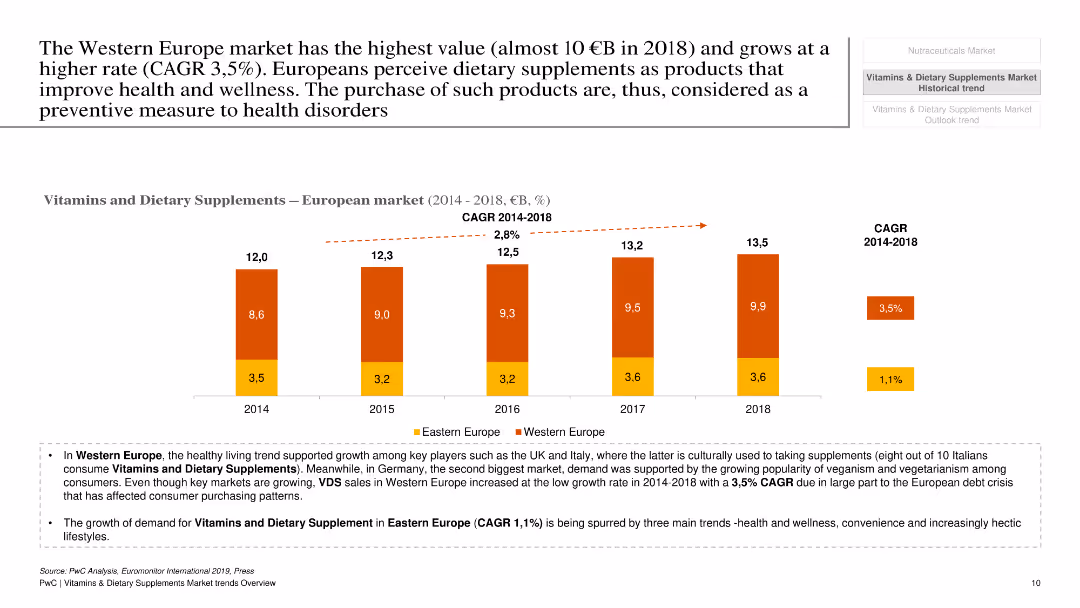
The slide has a white background with a column chart showing market value and growth rates of vitamins and dietary supplements in Western Europe from 2014 to 2018.
Market Analysis and Trends
Healthcare & Pharmaceuticals
This slide examines the market value and growth rate of vitamins and dietary supplements in Western Europe, focusing on key drivers and trends.
Vitamins, dietary supplements, Western Europe, market value, growth, trends, healthcare, pharmaceuticals, analysis
Mixed Chart
PwC/Strategy&
Saved
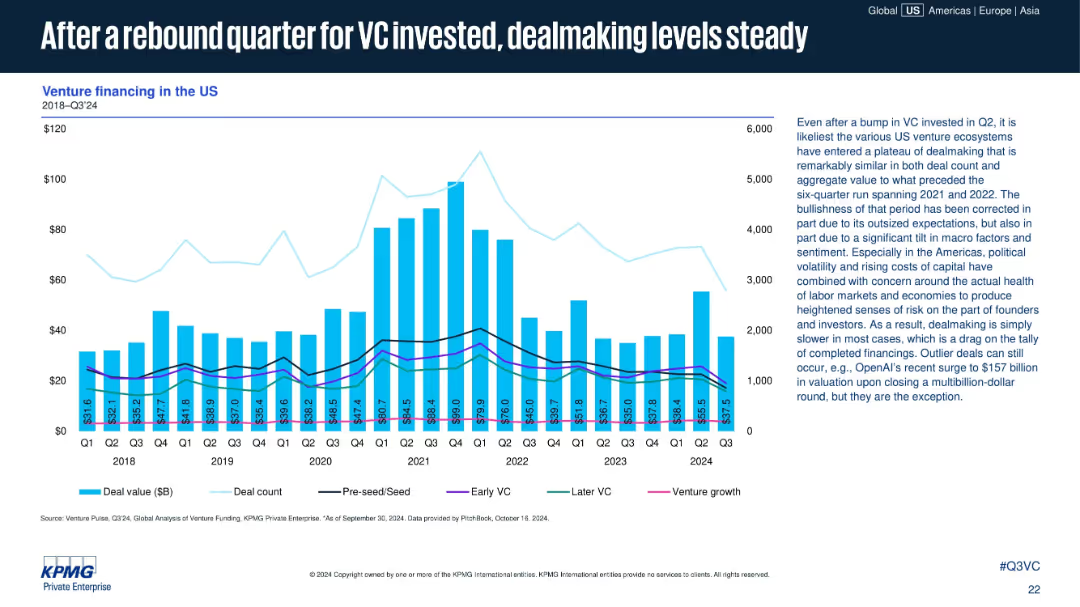
Bar-line chart showing U.S. VC financing by quarter (value and count); additional trendlines for financing type (seed to venture growth); detailed commentary on right.
Financial Performance
Technology & Software
This slide focuses on U.S. venture financing trends up to Q3 2024. After a bump in Q2, Q3 dealmaking appears steady, though overall deal count remains below historic highs. Text notes that macroeconomic factors and cautious sentiment have moderated growth across deal stages.
US venture capital, deal count, VC investment, seed to growth, financing types, macro trends, Q3 2024, startup deals, OpenAI example
Mixed Chart
KPMG
Saved
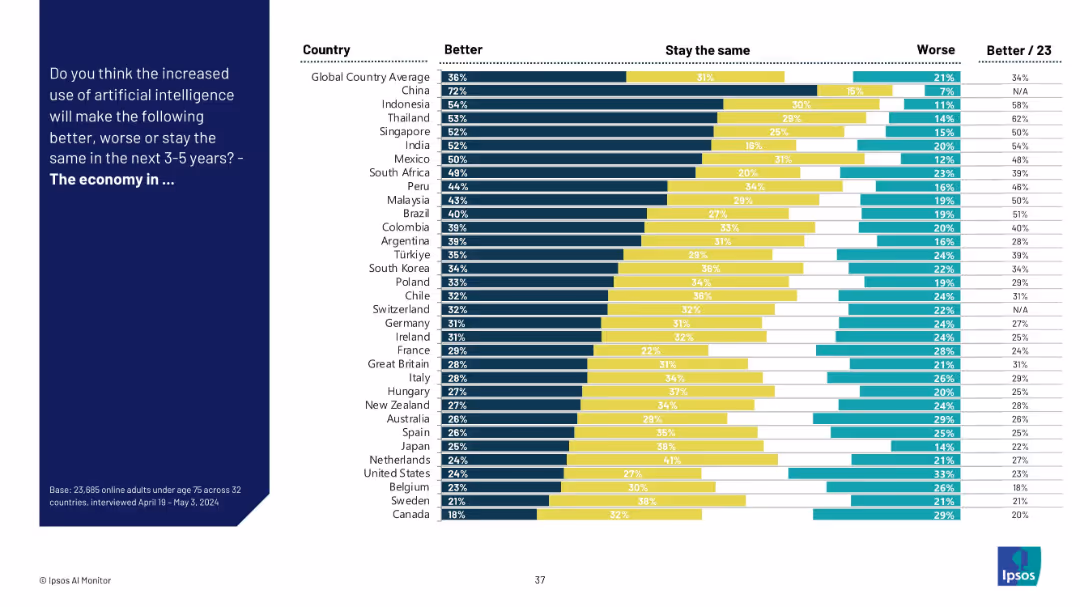
Split-panel layout with a dark blue sidebar containing the question text and a bar chart on the right showing responses across countries.
Market Analysis and Trends
Artificial Intelligence
The slide presents a global comparison of public opinion on whether AI will improve, worsen, or not affect the economy in the next 3–5 years. Results are shown for multiple countries, highlighting optimism in places like China and Indonesia.
AI impact, global economy, country comparison, public opinion, Ipsos, survey, optimism, AI perception, economic outlook, trends
Mixed Chart
IPSOS
Saved
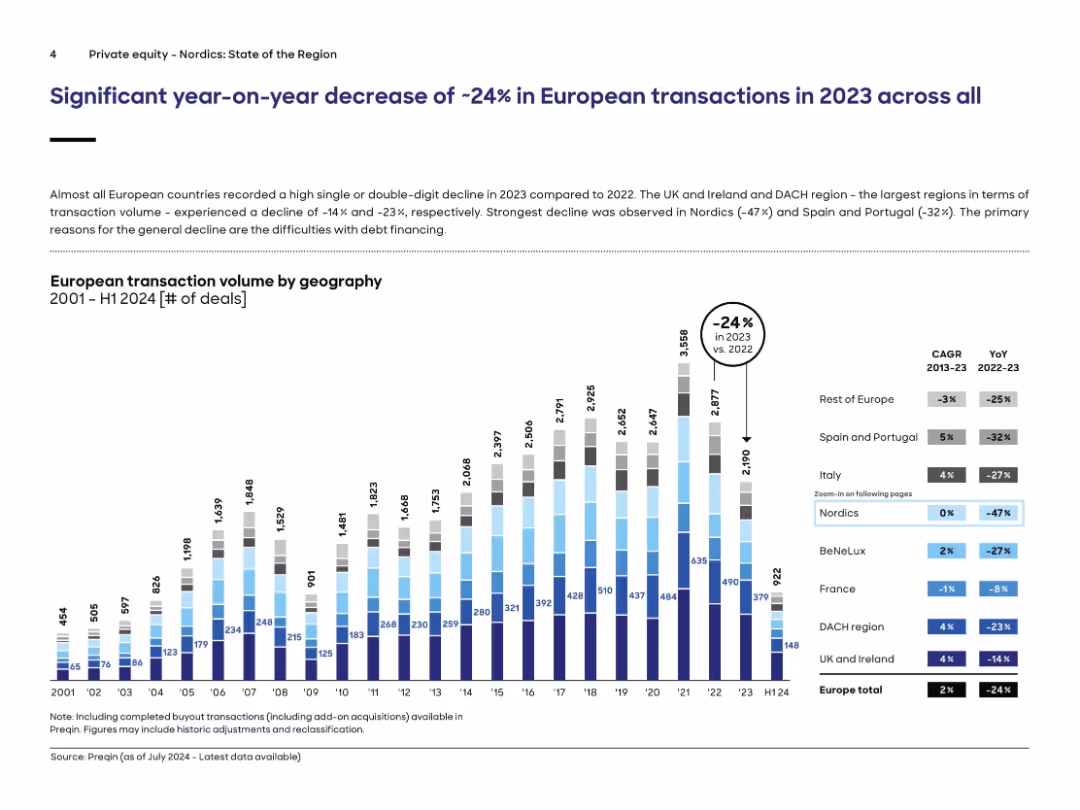
Bar chart displaying European transaction volumes by region over 20+ years; decline visualized for each region; title and CAGR/YoY table included.
Market Analysis and Trends
Financial Services
European transaction volume dropped 24% in 2023 vs. 2022 across nearly all regions. The chart breaks down deal count by geography (e.g., Nordics, DACH, UK). Nordics saw the steepest drop (-47%). Key causes cited include tightening debt financing. Supporting tables show YoY change and CAGR, with notable declines in major markets. Data sourced from Preqin.
transactions, private equity, Europe, volume, decline, Nordics, Preqin, DACH, market trend
Single Chart
Roland Berger
Saved
This slide compares investment trends across early-stage, growth-stage, and late-stage companies, using overlapping area charts for each stage to represent the private funding value from H1 2019 to H1 2022. Text annotations summarize the trend insights for each stage, such as growing early-stage investments and late-stage downturns.
Investment Analysis
Financial Services
An analysis of investment patterns, contrasting early, growth, and late-stage investments over time, with an emphasis on the flourishing early-stage sector and the challenges faced by late-stage investments due to diminished IPO prospects.
investments, early-stage, growth-stage, late-stage, IPO, trends, private funding
Multiple Chart
Bain
Saved
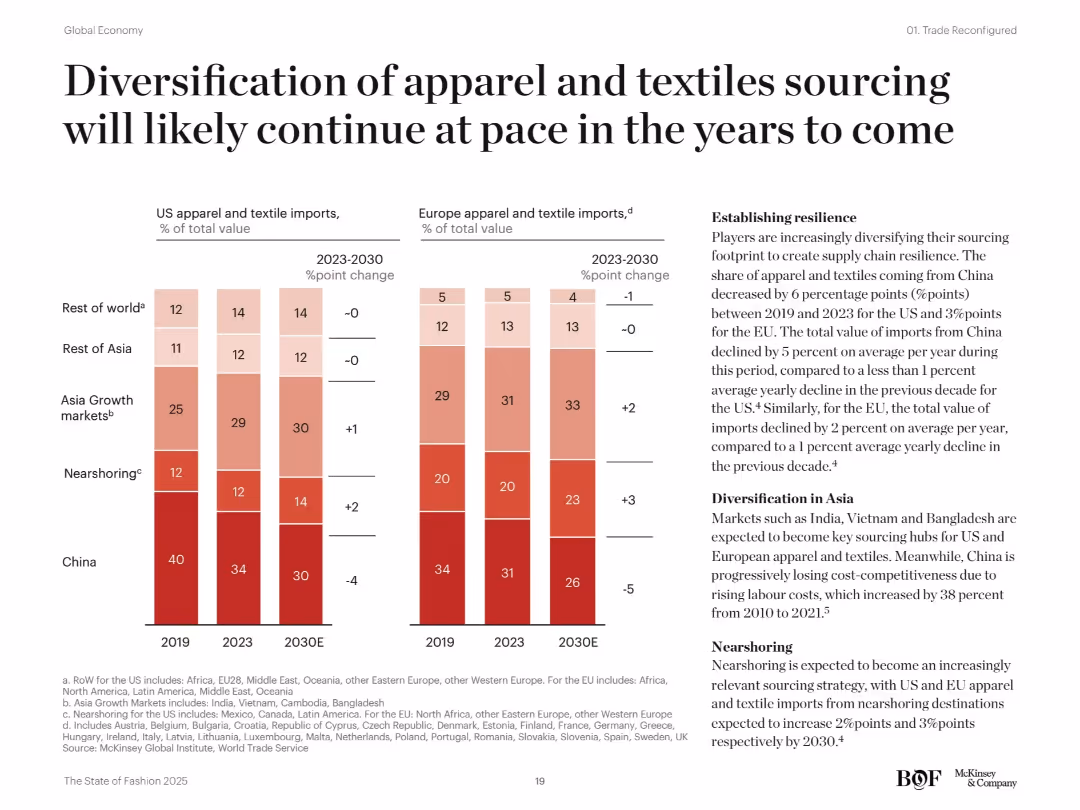
Two sets of vertical stacked bar charts (US and EU) on sourcing composition changes from 2019 to 2030. Text box explains drivers of change. Soft red and pink color palette.
Strategic Planning
Consumer Goods
This slide analyzes shifting sourcing patterns in apparel and textiles from China to Asian growth markets and nearshoring regions. It highlights resilience-building strategies, such as reduced reliance on China, increased sourcing from India, Vietnam, and others, and a growing preference for nearshoring in the US and EU.
apparel sourcing, China, nearshoring, Asia growth, diversification, US, EU, textiles, supply chain resilience, import patterns
Mixed Chart
McKinsey
Saved
This slide includes checklists, a circular flow diagram in the center with three labeled points, and a bar chart listing types of risks on the right. It is visually balanced with elements well-distributed across the slide.
Risk Assessment and Management
Financial Services
The slide outlines the risk management framework, emphasizing the firm's approach through a culture of risk management, process and structural oversight, and continuous improvement. A list details various types of risks such as market, credit, and operational risks. Suitable for a presentation on corporate governance or risk management strategies.
Risk Management, Governance, Framework, Corporate, Oversight, Improvement, Analysis
Linear Flow
Goldman Sachs
Saved
Previous
Next
If nothing, comes up, please save your slides first
Create a FREE account to continue browsing
Receive Instant Access to 1,000+ slides from companies like McKinsey, Google, and Goldman Sachs
First Name
Last Name
Email
Password
I agree to all
Terms & Privacy Policy
Thank you! Your submission has been received!
Oops! Something went wrong while submitting the form.
Have an account?
Sign in
Column Chart
Heatmap
Chevron
Org Chart
Infographic
Callouts
Timeline
List
Graphic
Picture
Process Flow
Diagram
Paragraph
Map
Table
Framework
Subtitle
Takeaway Box
Icon
Other Chart
Radar Chart
Waterfall Chart
Mekko Chart
Pie Chart
Scatter Plot
Line Chart
Bar chart
Bullet points