My Account
My Slides
Search by Category
Templates
View All Templates
Download Template Slides
Leave Feedback
Login
Logout
Get Started
Browse all Slides
Browse all Slides
Create a FREE Account
Instant access to 1,000+ real slides from top companies like McKinsey, BCG, Goldman Sachs, Google and many more!
First Name
Last Name
Email
Password
I agree to all
Terms & Privacy Policy
Thank you! Your submission has been received!
Oops! Something went wrong while submitting the form.
Have an account?
Sign in
Saved Slides
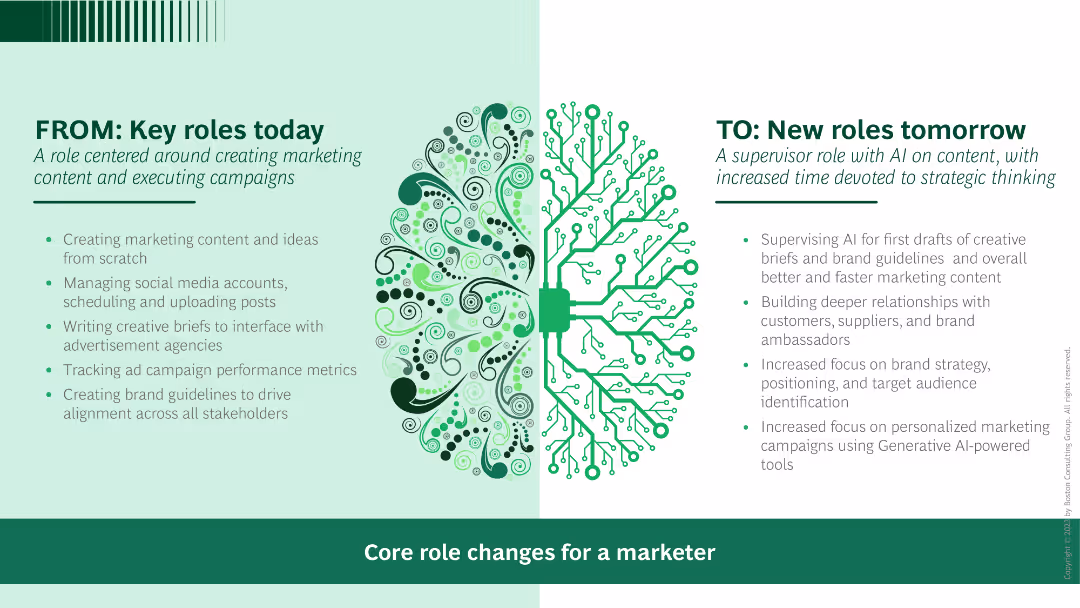
Side-by-side comparison with text explaining the current roles on the left and future roles with AI on the right. Visuals include icons and a central illustration of a brain.
Human Resources and Talent Management
Professional Services
Shows the evolution of marketing roles with the adoption of AI, emphasizing the shift from content creation to supervisory roles.
marketing, AI, role evolution, content creation, supervisory roles
Boxed
BCG
Saved
Bar and column charts, text breakdown, three-column layout.
Operational Efficiency
Financial Services
Operational cost breakdown and efficiency for 2021 and 2022, with outlook for 2023.
Operational, efficiency, cost, investments, overhead, revenue, structure, banking
Single Chart
JP Morgan
Saved
Column chart showing the demand projection for various API-related roles over the next 12 months, including Software Developer, DevOps Engineer, and API Engineer, with a breakdown of current roles and future plans.
Human Resources and Talent Management
Technology & Software
The slide analyzes the demand for different API-related roles in software development, indicating which roles are likely to see increased hiring and which ones will remain stable or decrease.
API roles, demand, software development, projections
Single Chart
Gartner
Saved
Features a column chart depicting JPMC's total client asset flows over time with an accompanying dot matrix that breaks down asset class by product, channel, and region. Another section compares 5-year total client asset flows against peers.
Market Analysis and Trends
Financial Services
Analyzes JPMC's diversified platform, showcasing robust asset flow growth across various classes and markets over a decade, comparing favorably with industry peers in market share.
asset flows, diversification, financial services, JPMC, market analysis, investment, regional distribution, product breakdown
Multiple Chart
JP Morgan
Saved
This slide uses blue column charts and gray bars to depict changes in CET1 ratio and Risk-weighted Assets. It includes detailed footnotes and highlights key regulatory impacts and capital management strategies used to improve financial ratios.
Regulatory and Compliance
Financial Services
Displays quarterly changes in CET1 ratios influenced by regulatory adjustments, capital strategies, and market conditions. It underscores the bank's efforts in maintaining robust capital ratios through strategic financial management and regulatory compliance.
CET1 ratio, capital, regulatory, market, management
Multiple Chart
Deutsche Bank
Saved
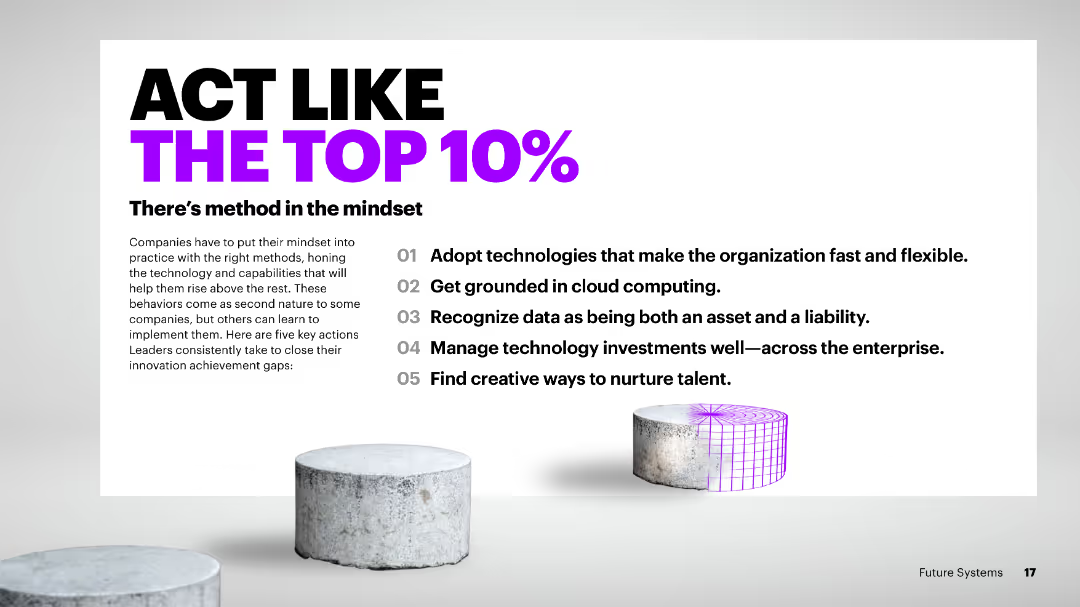
A single-column slide with text listing the key actions leaders take to close innovation gaps.
Strategic Planning
Technology & Software
The slide outlines five key actions that top-performing companies undertake to foster innovation, including adopting flexible technologies, investing in cloud computing, and nurturing talent creatively.
top 10%, innovation, key actions, flexible technologies, cloud computing, talent, strategies, performance, closing gaps, foster
Vertical Flow
Accenture
Saved
Horizontal bar chart with “Important” and “Not important” segments; ranked by importance of being born in country
Customer and Market Segmentation
Government & Public Sector
This slide shows how people in different countries perceive the importance of birthplace in defining national identity. The chart indicates high importance in Malaysia, Colombia, and Thailand, and lower importance in Western countries like Sweden and the Netherlands.
nationalism, birthplace, national identity, belonging, survey results, Ipsos, importance ranking, patriotism
Mixed Chart
IPSOS
Saved
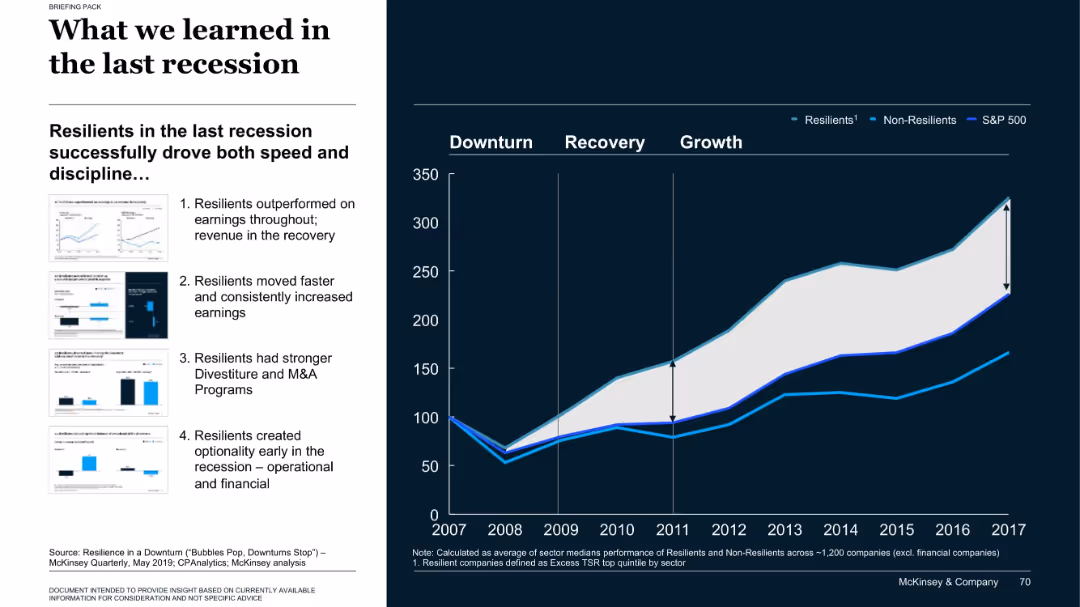
Left side text and thumbnails; right side line chart comparing company performance categories post-2008
Strategic Planning
Professional Services
The slide compares resilient vs. non-resilient companies during the 2008 recession, showing how resilient firms recovered faster and achieved higher long-term returns. Four key behaviors are outlined on the left that contributed to resilience.
recession, resilience, M&A, company performance, S&P 500
Mixed Chart
McKinsey
Saved
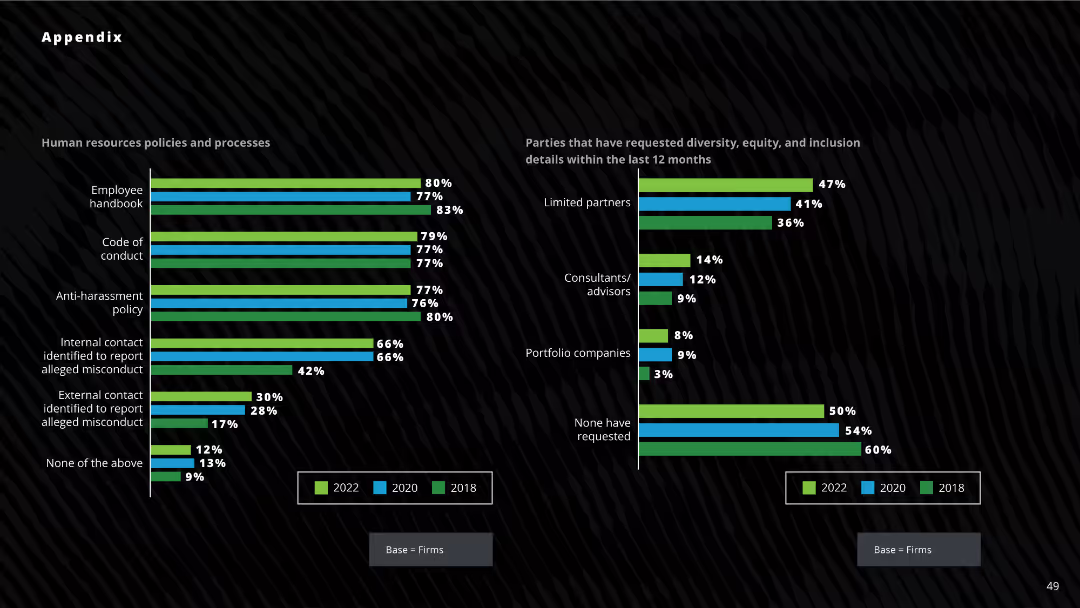
Two horizontal bar charts: one showing the adoption of HR policies across firms, the other displaying parties requesting diversity details within the last 12 months.
Human Resources and Talent Management
Professional Services
The slide illustrates the adoption rates of various HR policies over three years and highlights the parties requesting diversity details. Useful for understanding trends in HR policy adoption and diversity information requests.
HR policies, diversity, compliance, requests, adoption
Multiple Chart
Deloitte
Saved
Four blocks highlighting industry drivers of profitability in distribution: Inventory turns, Technical expertise, Fragmentation, Regulatory environment, Pricing dynamics, each with descriptive bullet points.
Market Analysis and Trends
Financial Services
The slide outlines the key profitability drivers in distribution industries, focusing on inventory, technical knowledge, market fragmentation, regulations, and pricing trends.
profitability, inventory turns, technical expertise, fragmentation, regulations, pricing dynamics, distribution
Pillar
EY
Saved
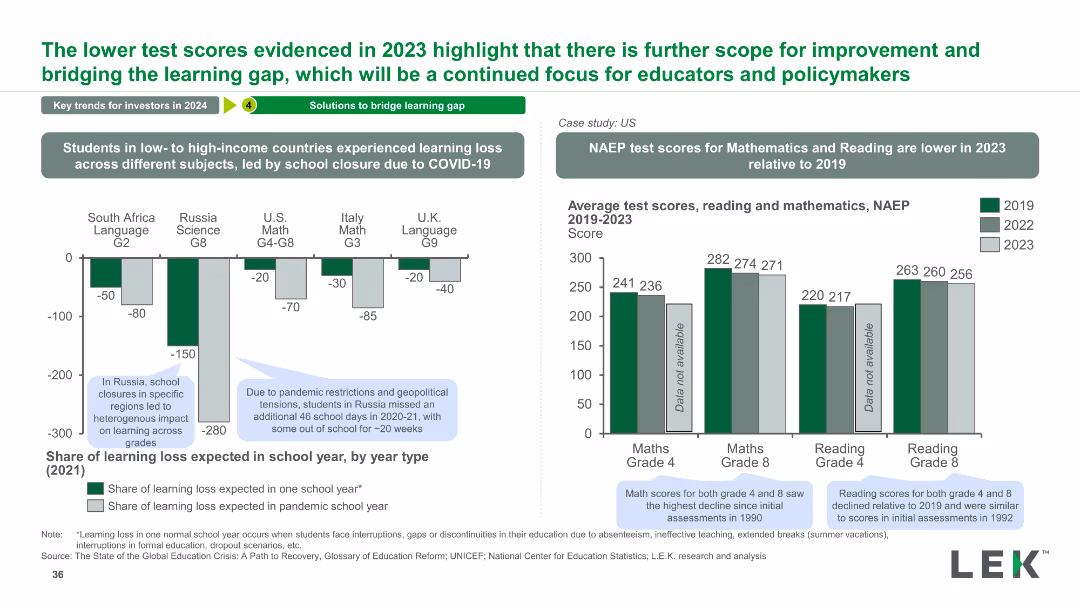
The slide contains a column chart showing learning loss in different countries, and a column chart comparing NAEP test scores for Mathematics and Reading from 2019 to 2023.
Strategic Planning
Education & Training
This slide analyzes the learning gaps caused by COVID-19, presenting data on learning loss across countries and trends in US NAEP test scores for Math and Reading.
Learning, Gap, COVID-19, Test Scores, Education, Analysis, Trends, Data, Recovery, Impact
Multiple Chart
LEK
Saved
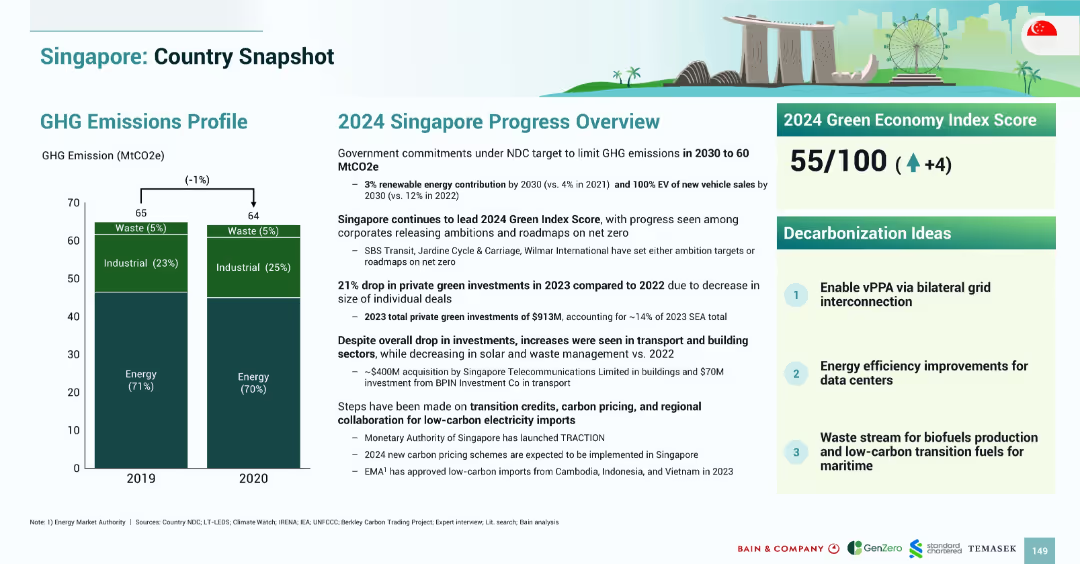
Bar chart on left showing GHG trends; progress summary on right includes text blocks, Green Index Score, and decarbonization ideas in numbered blocks.
Strategic Planning
Government & Public Sector
Singapore aims to cut emissions to 60 MtCO2e by 2030. It leads SEA in Green Index Score (55/100). 2023 saw a drop in private green investments, but building and transport sectors saw gains. Key strategies include vPPA, data center efficiency, and waste-to-fuel transitions.
Singapore, emissions, decarbonization, energy, transport, data centers, vPPA, 2024
Mixed Chart
Bain
Saved
Conveys the prospective impact of space technology on the space economy and human spaceflight, with future-oriented illustrations.
Market Analysis and Trends
Technology & Software
Discusses future disruptions enabled by space technology, including space mining, in-orbit construction, and human spaceflight scalability.
space economy, human spaceflight, space mining, in-orbit construction, power generation
Pillar
McKinsey
Saved
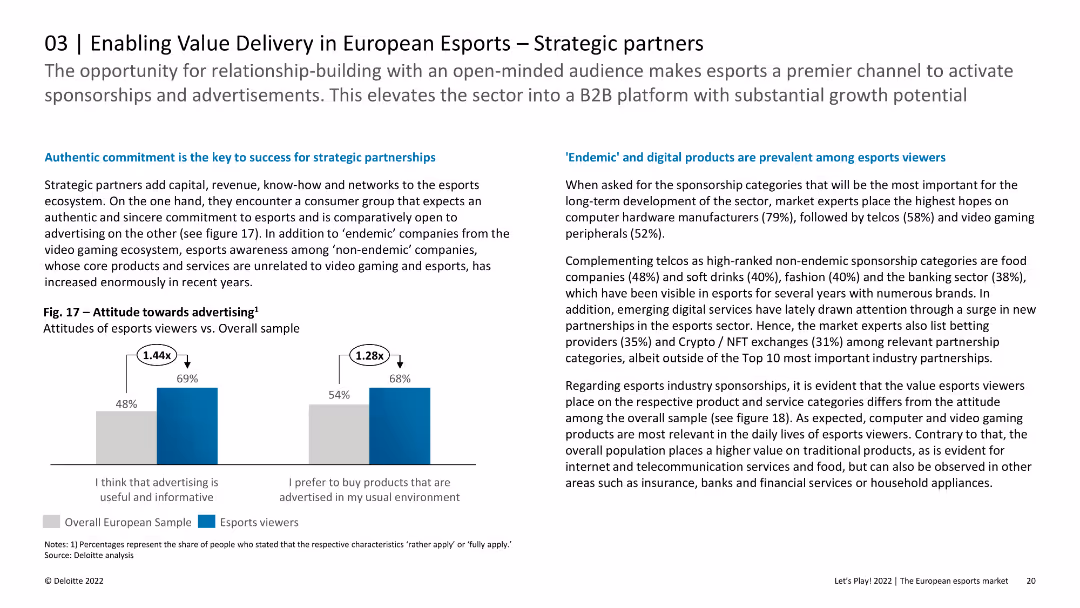
The slide includes column charts showing attitudes towards advertising among esports viewers compared to the overall sample. The layout is clean and focused on data presentation.
Strategic Planning
Media & Entertainment
This slide discusses the importance of strategic partnerships in the esports ecosystem, highlighting the positive attitudes of esports viewers towards advertising. It provides insights into the preferred sponsorship categories and the relevance of different products and services.
Esports, Strategic Partnerships, Advertising, Europe
Mixed Chart
Deloitte
Saved
The slide features pie charts showing total revenues and PBT breakdowns for 2H23, along with a list of medium-term priorities for clients, integration, and productivity. Text highlights ambitions for cost/income ratio and key achievements in client reach and service.
Financial Performance
Financial Services
The slide emphasizes UBS's leading position in Switzerland with strong returns and extensive client reach. It outlines medium-term priorities in client services, integration, and productivity improvements. This slide can be used to highlight market leadership and strategic priorities in the Swiss banking sector.
Switzerland, market leadership, client reach, productivity, integration
Multiple Chart
UBS
Saved
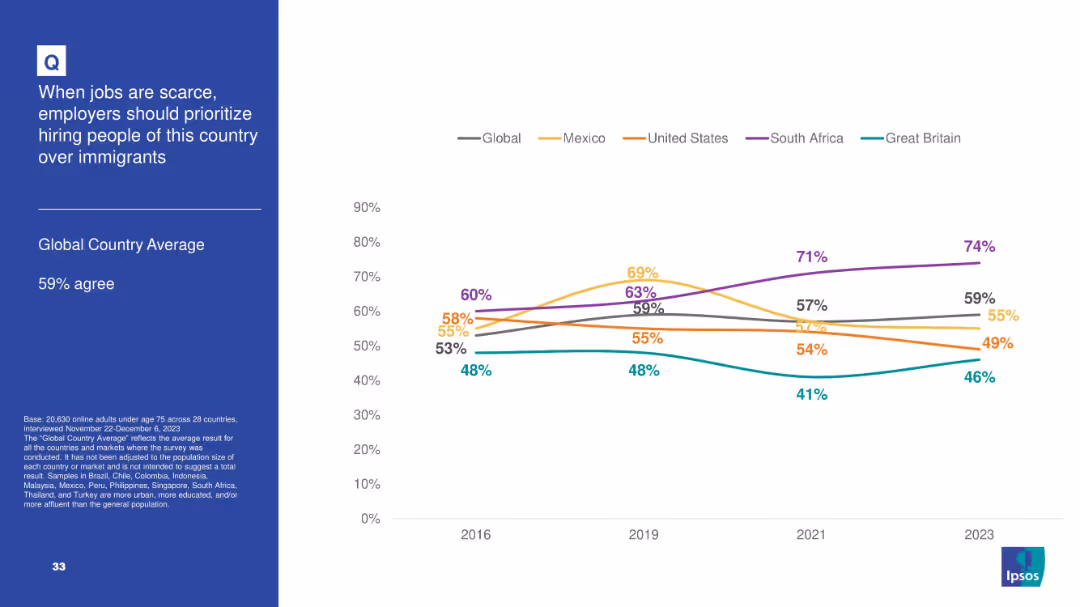
Chart and line graph format tracking sentiment trends over time across select countries; line plot includes global average trend.
Customer and Market Segmentation
Government & Public Sector
This slide reflects nationalist-leaning attitudes, with 59% globally agreeing that citizens should be prioritized over immigrants for jobs during scarcity. The trend line shows consistent support with South Africa peaking at 74% in 2023. The slide suggests growing concern over job competition and immigration policy sentiment.
immigration, jobs, hiring, nationalism, employment policy, survey, Ipsos, trends
Mixed Chart
IPSOS
Saved
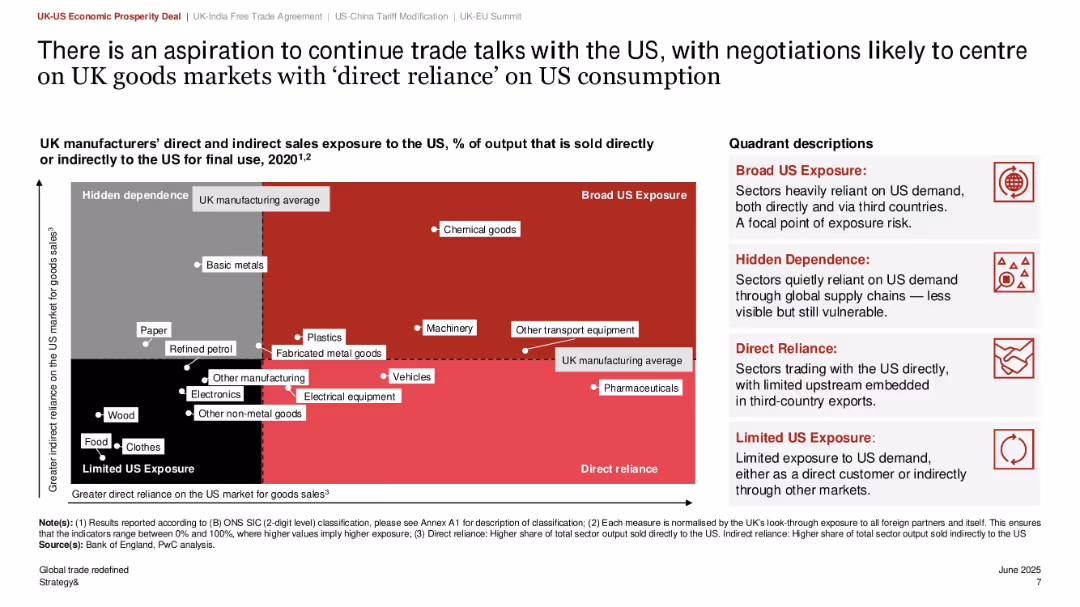
Scatter plot quadrant graph showing direct vs. indirect exposure to US market; color-coded quadrants with callouts; right-side text explaining quadrant meanings
Risk Assessment and Management
Government & Public Sector
This slide categorizes UK manufacturing sectors based on their exposure to the US market, using a matrix of direct and indirect reliance. Sectors such as chemical goods and transport equipment fall in the “Broad US Exposure” quadrant. It aids in identifying vulnerable sectors for targeted negotiations in future trade talks.
US exposure, UK manufacturing, export risk, sector analysis, trade dependency, quadrant matrix, policy planning
Mixed Chart
PwC/Strategy&
Saved
The slide combines a table and two line charts to show revenue and contribution margin trends over several quarters.
Market Analysis and Trends
Technology & Software
It details the performance of the research segment, including revenue, growth rates, contribution margins, and subscription revenue trends.
Research, Revenue, Contribution Margin, Subscription, Non-subscription, Growth
Multiple Chart
Gartner
Saved
Contains two line charts tracking Bank and Insurance stock indexes over time, a series of bullet points outlining future expectations for banks and insurers, and two quotes from financial executives. Layout includes color coding for different elements: blue for banks, green for insurers.
Market Analysis and Trends
Financial Services
This slide analyzes the impact of economic headwinds on the finance and insurance industries, predicting indirect and delayed effects. It includes forecasts about market challenges, with specific insights from industry executives on anticipated credit losses and profitability issues due to dropping investment returns.
finance, insurance, economic impact, market forecast, stock indexes
Mixed Chart
BCG
Saved
Column charts showing RWA, LRD, CET1 capital ratio, and total loss absorbing capacity
Risk Assessment and Management
Financial Services
Highlights actions taken to reinforce balance sheet strength and maintain capital ratios
balance, sheet, capital, reinforcement
Multiple Chart
UBS
Saved
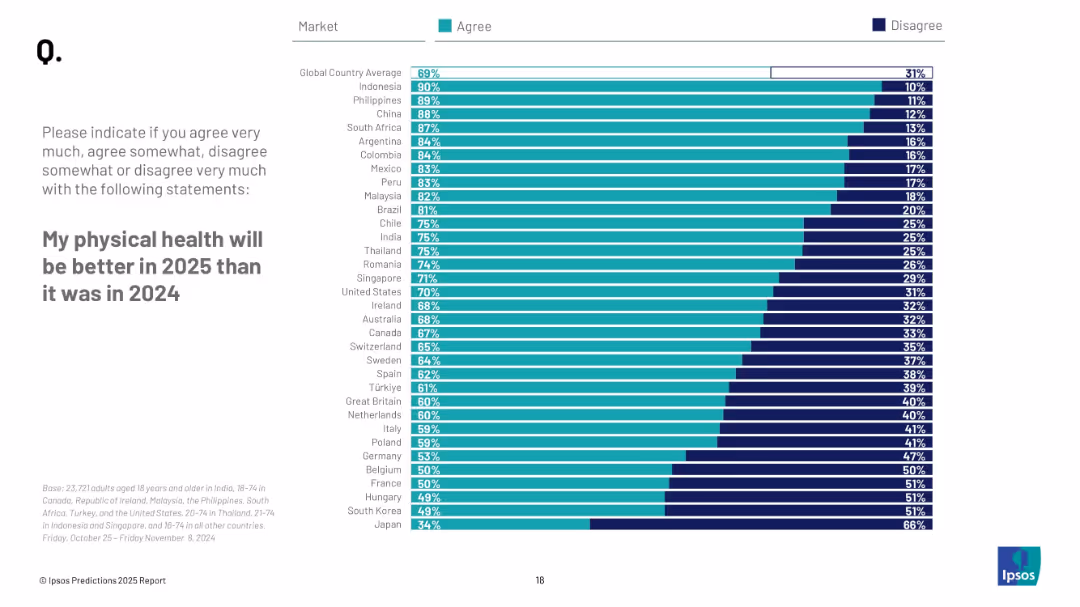
Horizontal bar chart ranked by agreement level; includes "Agree" and "Disagree" bars by country; title and instructions on the left.
Market Analysis and Trends
Healthcare & Pharmaceuticals
Respondents from various countries were asked about their expectations for physical health improvement in 2025. The slide shows agreement and disagreement levels, sorted by country, with global average.
health expectations, physical health, international survey, wellbeing, 2025 prediction, bar chart, Ipsos
Mixed Chart
IPSOS
Saved
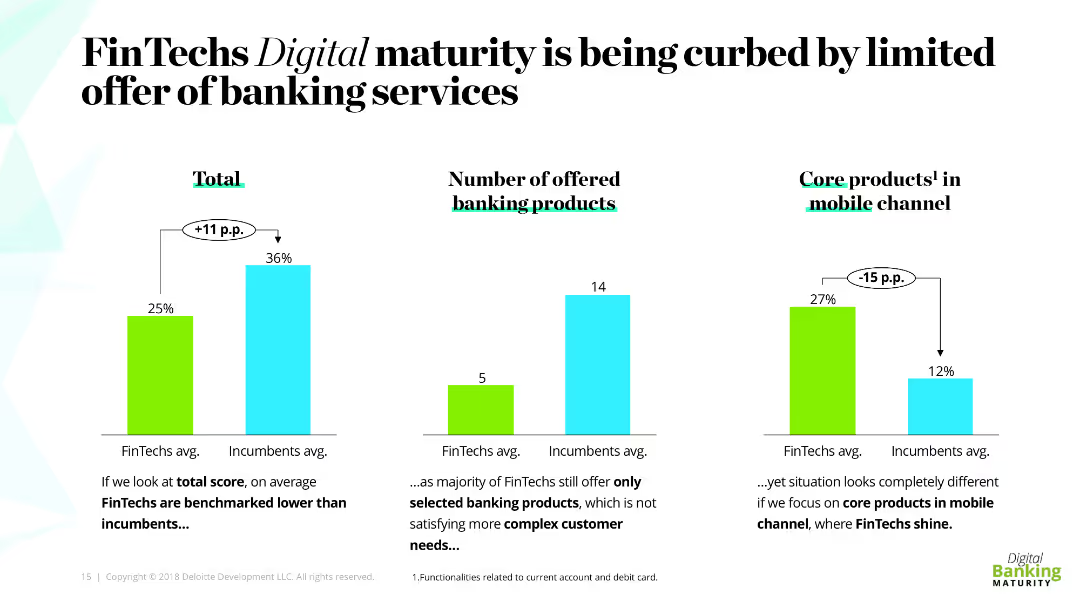
The slide includes three column charts comparing FinTechs and incumbents on total score, number of banking products offered, and core products in the mobile channel. Each chart is accompanied by a brief explanation of the data presented.
Market Analysis and Trends
Financial Services
The slide analyzes the limitations in FinTechs' digital maturity due to a limited range of banking services. It compares FinTechs and incumbents in terms of overall scores, number of banking products offered, and performance in mobile channel services.
FinTechs, incumbents, banking services, digital maturity, comparison
Multiple Chart
Deloitte
Saved
It features a comparative column chart of year-over-year investments in various business areas for CCB.
Strategic Planning
Financial Services
Details the strategic investment plans for 2022-2023 to grow the Consumer and Community Banking franchise with expected ROI.
investments, franchise growth, CCB, ROI, strategic planning, JPMorgan Chase & Co, financial services
Mixed Chart
JP Morgan
Saved
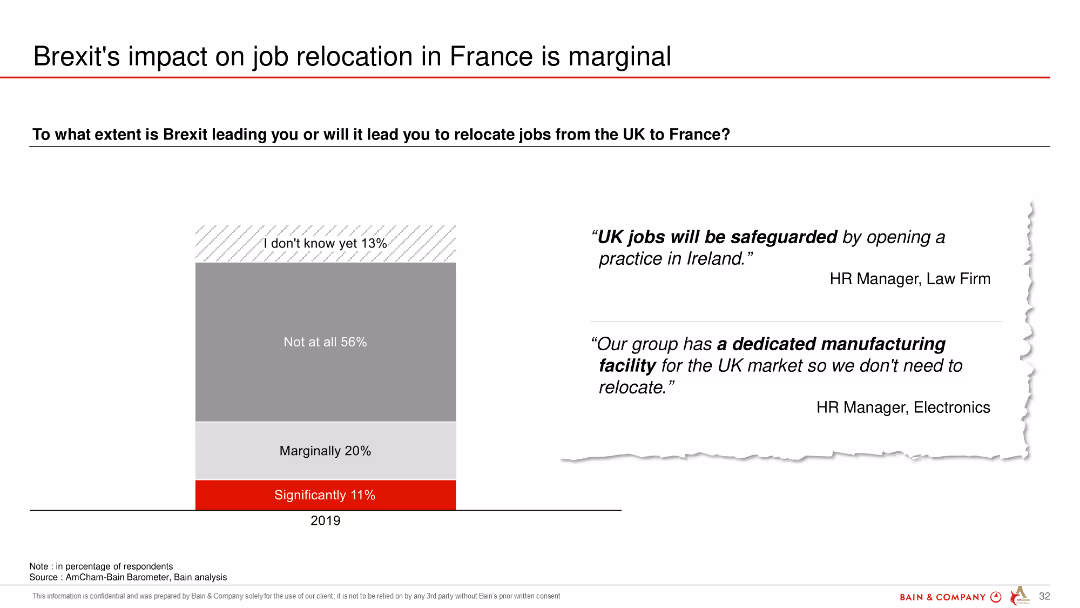
The slide features a column chart showing the extent to which Brexit is expected to lead to job relocations from the UK to France, with a majority indicating no significant impact.
Regulatory and Compliance
Government & Public Sector
The slide illustrates that most respondents do not expect Brexit to lead to significant job relocations from the UK to France, with marginal to no impact.
Brexit, job relocation, UK, France, impact, survey, expectations
Mixed Chart
Bain
Saved
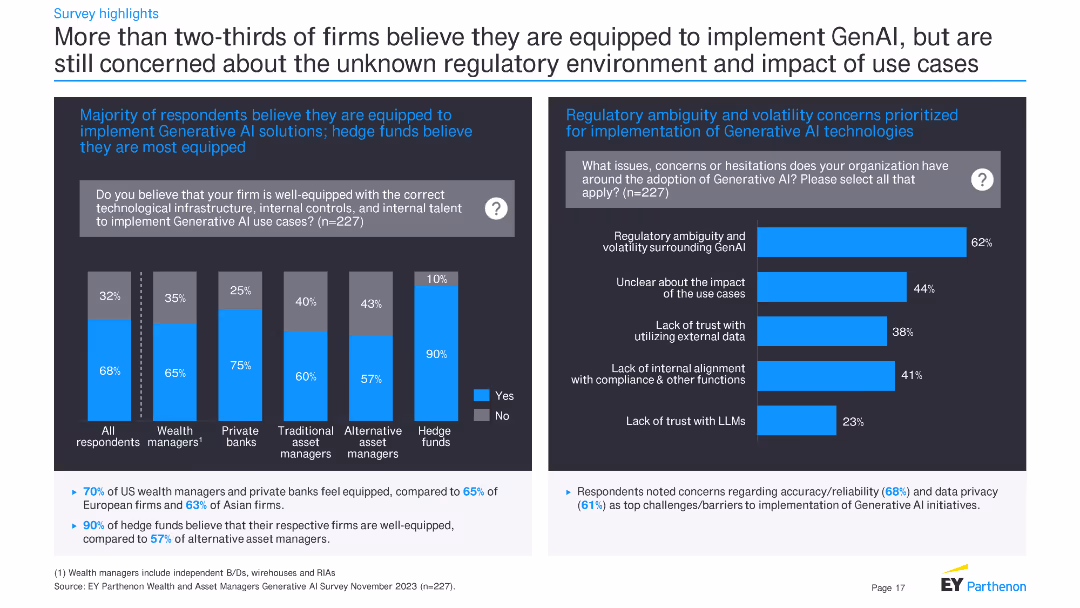
The slide features a column chart on the left and a bar chart on the right. The column chart shows the percentage of firms across different financial sectors that believe they are well-equipped to implement GenAI. The bar chart on the right highlights concerns related to regulatory ambiguity and other issues.
Risk Assessment and Management
Financial Services
The slide indicates that more than two-thirds of firms believe they are equipped to implement Generative AI, with hedge funds being the most confident. It also highlights major concerns like regulatory ambiguity, impact of use cases, and lack of trust with external data.
Generative AI, financial firms, regulatory concerns, implementation, survey results, hedge funds, technological readiness, data trust
Multiple Chart
EY
Saved
Previous
Next
If nothing, comes up, please save your slides first
Create a FREE account to continue browsing
Receive Instant Access to 1,000+ slides from companies like McKinsey, Google, and Goldman Sachs
First Name
Last Name
Email
Password
I agree to all
Terms & Privacy Policy
Thank you! Your submission has been received!
Oops! Something went wrong while submitting the form.
Have an account?
Sign in
Column Chart
Heatmap
Chevron
Org Chart
Infographic
Callouts
Timeline
List
Graphic
Picture
Process Flow
Diagram
Paragraph
Map
Table
Framework
Subtitle
Takeaway Box
Icon
Other Chart
Radar Chart
Waterfall Chart
Mekko Chart
Pie Chart
Scatter Plot
Line Chart
Bar chart
Bullet points


![Having been born in… [COUNTRY]](https://cdn.prod.website-files.com/654e70fb59937215cac87b19/6899bb1ae84fc87b0bfe59ed_Rn5Ew6f6kDr6DPBjBS-f8-NAgveLmqK5mnMrbj4Cv7I.avif)