My Account
My Slides
Search by Category
Templates
View All Templates
Download Template Slides
Leave Feedback
Login
Logout
Get Started
Browse all Slides
Browse all Slides
Create a FREE Account
Instant access to 1,000+ real slides from top companies like McKinsey, BCG, Goldman Sachs, Google and many more!
First Name
Last Name
Email
Password
I agree to all
Terms & Privacy Policy
Thank you! Your submission has been received!
Oops! Something went wrong while submitting the form.
Have an account?
Sign in
Saved Slides
This slide is a content slide with text and several small line graphs. The text identifies key global employment clusters and their potential impacts on employment rates by scenario for different regions, with line graphs illustrating these trends.
Human Resources and Talent Management
Professional Services
It examines the employment landscape changes due to the green transition, identifying key clusters like EU27+UK, China, the US, Middle East, and Australia, and their varying impacts on employment rates by 2050. It stresses the importance of regional adaptations to manage demographic and employment trends effectively.
Employment, Transition, Clusters, Workforce, Green Economy
Multiple Chart
EY
Saved
Features a pie chart illustrating savings by workstream, accompanied by statistics on initiatives and employee engagement.
Organizational Structure and Change
Financial Services
Highlights the impact of corporate initiatives on cost savings, emphasizing employee engagement and fiscal responsibility.
cost savings, initiatives, employee engagement, accountability, pie chart
Single Chart
Barclays
Saved
The slide includes text blocks with points about GCC countries' potential for CCUS, including geological storage capacity and government plans.
Strategic Planning
Energy & Utilities
Discusses the potential for CCUS in GCC countries, citing geological capacity, emission statistics, and governmental commitment to reducing CO2 emissions.
GCC, CCUS, potential, geological storage, government plans, CO2 emissions, strategic planning
Multiple Chart
Kearney
Saved
Consisting of column charts, this slide provides an analysis of private banking and lending revenues, with growth metrics.
Operational Efficiency
Financial Services
Meant for stakeholders interested in the private banking and lending sector, showing revenue growth and providing insights into market expansion strategies, excluding specific product lines for focused analysis.
private banking, lending, revenue growth, strategy, market expansion
Single Chart
Goldman Sachs
Saved
The slide is split into four quadrants, each with a bar or column chart displaying data on greenhouse gas emissions by scope, both market-based and location-based.
Regulatory and Compliance
Technology & Software
Showcases the company's efforts in reducing greenhouse gas emissions, aligning with sustainability goals. Used in ESG reporting and compliance overviews.
greenhouse gas, emissions, sustainability, ESG reporting, market-based, location-based, compliance, reduction efforts
Multiple Chart
McKinsey
Saved
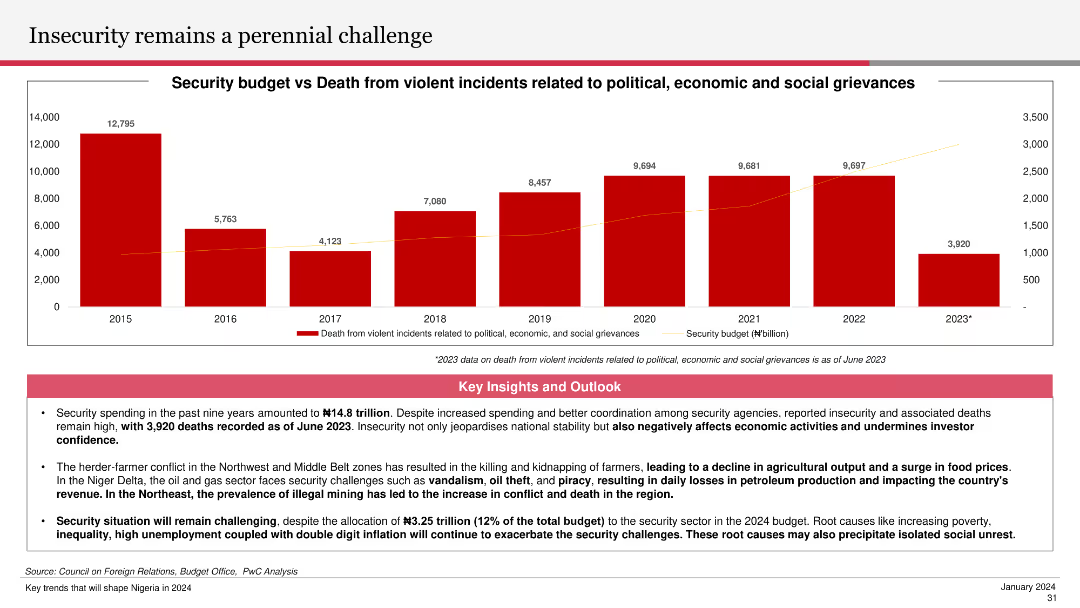
The slide features a column chart showing the security budget versus deaths from violent incidents from 2015 to 2023. Key insights and outlooks below the chart discuss the impact of insecurity on economic activities and investor confidence.
Risk Assessment and Management
Government & Public Sector
The slide highlights the ongoing security challenges and their economic implications, detailing the trend in security budgets and related deaths. It emphasizes the importance of addressing security issues to improve investor confidence and economic stability.
insecurity, security budget, violent incidents, economic impact, investor confidence
Mixed Chart
PwC/Strategy&
Saved
Flow chart showing the evolution of digital asset use cases: Store of value, Medium of exchange, Financial services. Icons and descriptions for each phase.
Strategic Planning
Financial Services
Describes the evolution and future potential of digital asset use cases in financial services. Ideal for strategic discussions on the adoption and integration of digital assets.
Digital Assets, Evolution, Financial Services, Use Cases, Store of Value, Medium of Exchange
Linear Flow
McKinsey
Saved
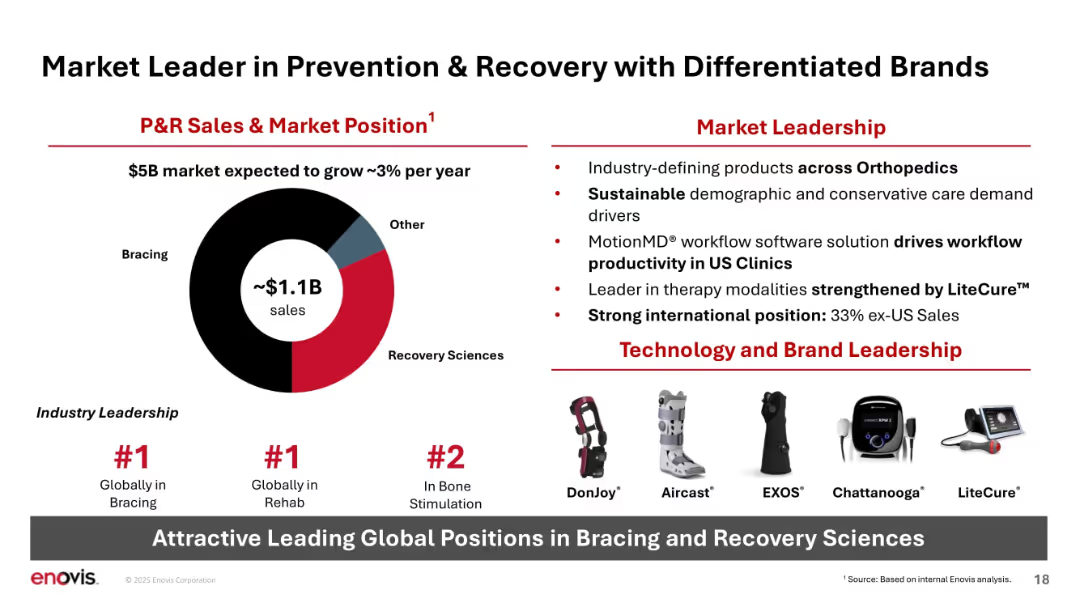
Donut chart, leadership rankings, brand visuals, and bulleted strengths; bold red/black layout.
Product and Service Analysis
Healthcare & Pharmaceuticals
Presents ~$1.1B in P&R sales divided into bracing and recovery sciences. Highlights Enovis’s #1 global position in bracing and rehab, and emphasizes brand strength and technological differentiation across therapy modalities.
P&R, market leadership, bracing, rehab, recovery sciences, brands, technology, global position
Mixed Chart
JP Morgan
Saved
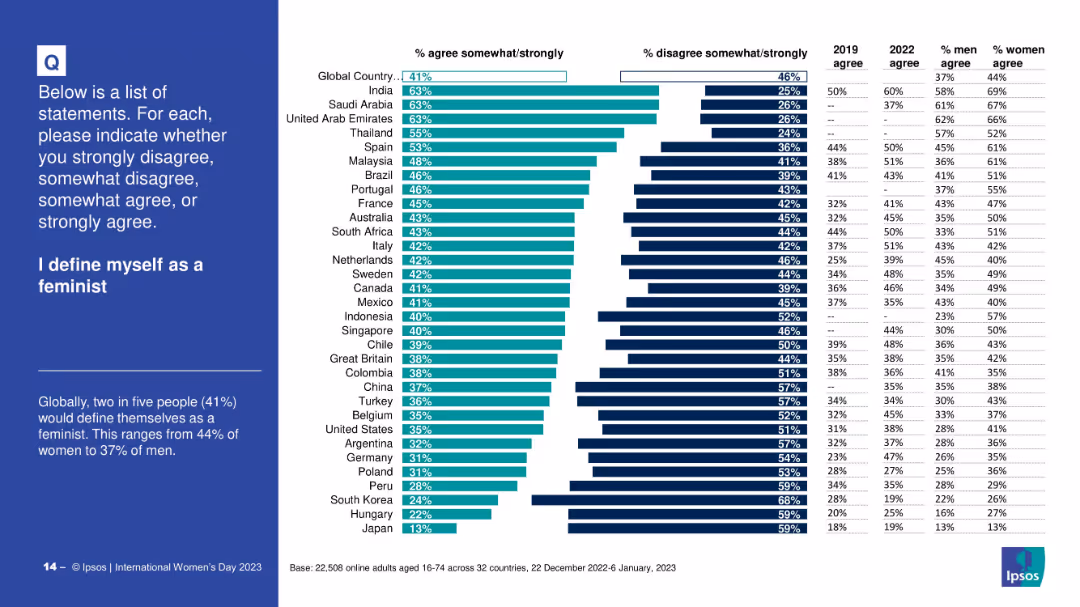
Horizontal bar chart; shows % agreement/disagreement per country; gender-specific agreement percentages; simple and clean layout
Customer and Market Segmentation
Professional Services
This slide reveals the proportion of people globally and by country who identify as feminists. It compares gender agreement levels and includes 2019 and 2022 agreement rates, offering insights into self-identification trends related to feminism.
feminism, identity, self-definition, gender, agreement rates, survey, country-level data, Ipsos
Mixed Chart
IPSOS
Saved
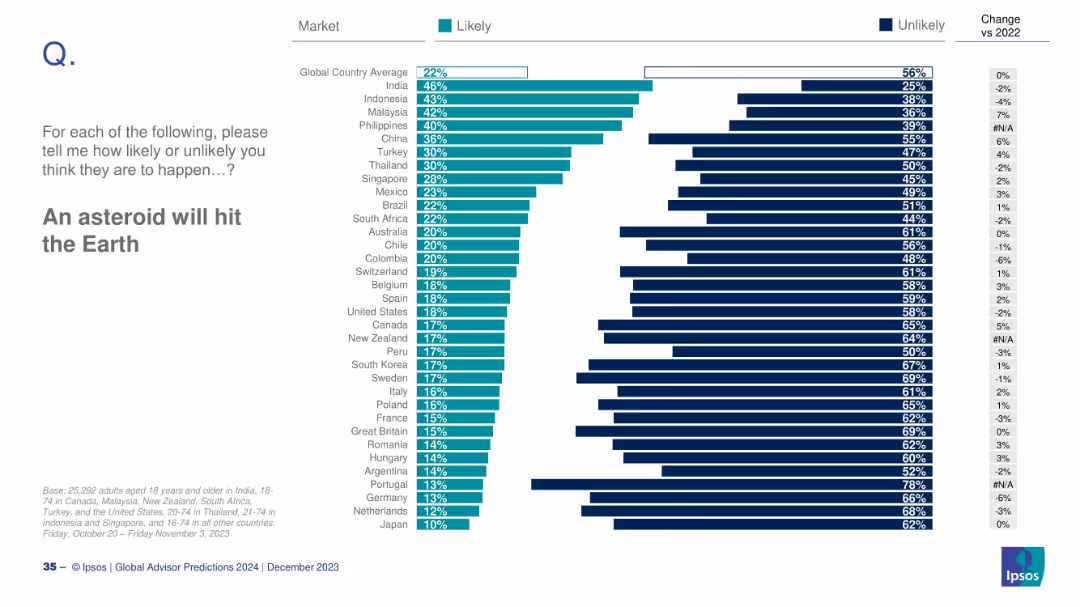
Bar chart ranked by countries on perceived asteroid impact risk; includes changes vs 2022.
Risk Assessment and Management
Government & Public Sector
The slide explores global public belief in the likelihood of an asteroid striking Earth. India shows the highest concern, while Japan shows the least. The global average is 22%, with minimal change since 2022.
asteroid, risk, global disaster, Ipsos, public belief, 2024 prediction
Mixed Chart
IPSOS
Saved
The slide features percentage statistics in a column chart format with explanatory text beside each chart. Color coding is used to differentiate between the likelihood of increasing or maintaining usage.
Strategic Planning
Technology & Software
Focuses on the technological readiness of digital merchants in the Philippines and their anticipated adoption of digital platforms and financial services in the future.
Digital platforms, Financial services, Technological adoption, Future trends
Multiple Chart
Bain
Saved
This slide uses a content layout with a process flow diagram and a detailed table outlining reasons for IV-E ineligibility and related processes. The layout is moderately detailed with a balance of text and visual elements.
Financial Performance
Government & Public Sector
Slide features a flowchart of the fiscal specialist unit process and a table of reasons for IV-E ineligibility with solutions.
Details the fiscal process for identifying funding and overcoming ineligibility issues, providing a flowchart and a table with next steps to address common problems.
Linear Flow
Alvarez & Marsal
Saved
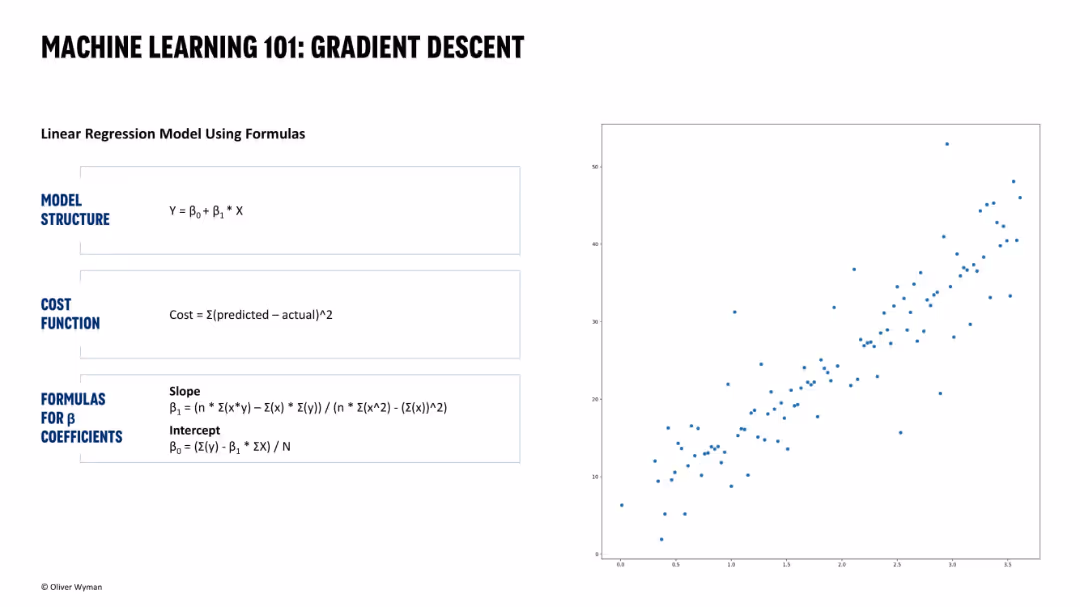
Left half shows linear regression formulas and cost function breakdown; right half displays a raw scatterplot. Simple and clean black-and-blue academic-style layout.
Technology and Digital Transformation
Artificial Intelligence
This introductory slide explains gradient descent using a linear regression example. It defines the model equation, cost function, and formulas for computing coefficients. A raw scatterplot helps visualize the data points the model is intended to fit. This slide is foundational and educative in nature.
gradient descent, machine learning, regression, cost function, linear model, scatterplot, formula
Single Chart
Oliver Wyman
Saved
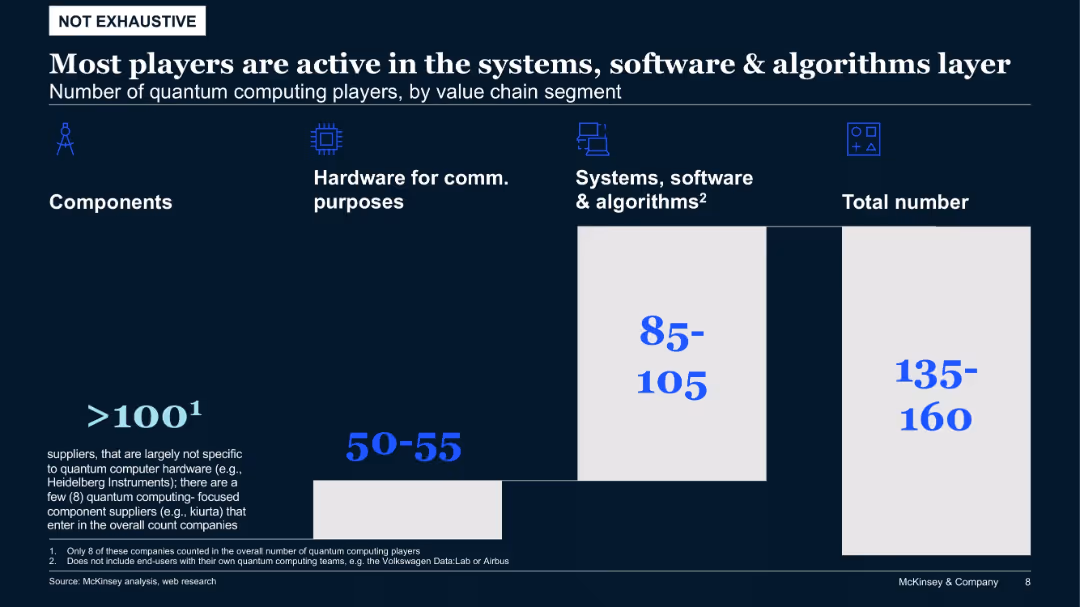
Bar-style chart comparing number of quantum players by value chain segment, with emphasis on software, hardware, and components
Product and Service Analysis
Artificial Intelligence
The majority of quantum computing players operate in the software and algorithms domain. Fewer focus on hardware and even fewer on components. The slide helps identify dominant value chain segments within the quantum computing industry.
quantum computing, value chain, software, hardware, algorithms, component suppliers
Single Chart
McKinsey
Saved
The slide includes a table and text discussing environmental health and safety metrics such as EMR, TRIR, DART, and severity rates, alongside a descriptive analysis.
Regulatory and Compliance
Environmental Services & Sustainability
This slide outlines Booz Allen's environmental health and safety (EHS) program, detailing metrics like EMR, TRIR, DART, and severity rates to highlight workplace safety improvements.
Booz Allen, EHS, safety metrics, EMR, TRIR, DART
Mixed Chart
Booz Allen Hamilton
Saved
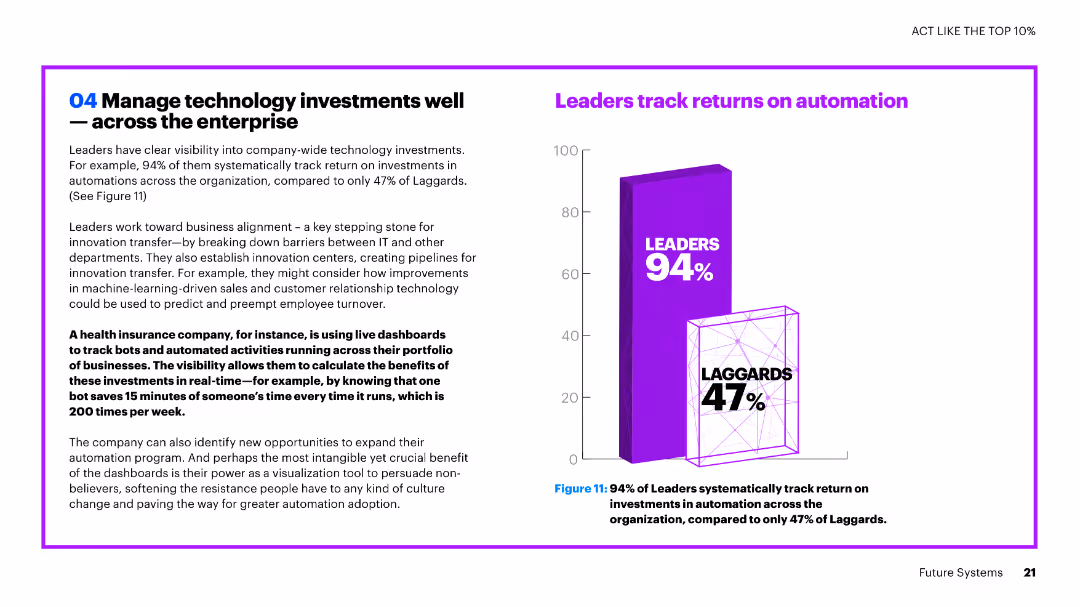
The slide contains text and a vertical column chart. The chart compares the percentage of leaders and laggards in tracking returns on automation investments.
Investment Analysis
Financial Services
The slide emphasizes the importance of tracking technology investments, highlighting that a high percentage of leaders track returns on automation investments compared to laggards.
technology investments, automation, leaders, laggards, tracking, returns, financial services, comparison
Mixed Chart
Accenture
Saved
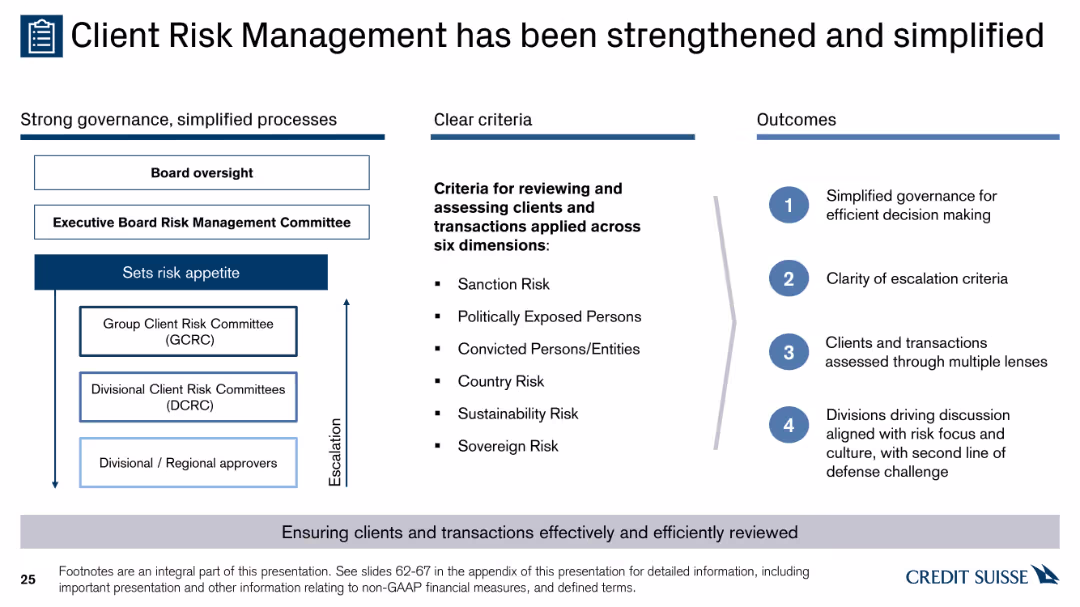
A diagram with three columns showing governance structure, criteria for reviewing clients and transactions, and outcomes. Contains text, bullet points, and arrows for escalation.
Risk Assessment and Management
Financial Services
The slide explains the enhanced and simplified client risk management process, detailing governance structures, risk criteria, and the expected outcomes for effective decision making.
governance, risk, criteria, outcomes, escalation
Header Horizontal
Credit Suisse
Saved
The slide is divided into two sections: the left features icons with text descriptions, and the right lists four points in a vertical format, each with a heading and description. The layout is organized and informative.
Market Analysis and Trends
Healthcare & Pharmaceuticals
The slide discusses strategic priorities in healthcare, including syndicated studies, commercial strategy, launch solutions, and clinical research, aimed at driving growth in the industry.
healthcare, strategy, growth, studies, clinical research
Boxed
IPSOS
Saved
Contains timelines and icons depicting hydrogen electrolysis capacity targets, infrastructure roadmaps, and targeted end-use sectors in a segmented layout.
Strategic Planning
Energy & Utilities
Discusses the Netherlands' hydrogen strategy focusing on developing infrastructure and scaling hydrogen use in various sectors by 2050, with specific targets for electrolysis capacity and transport applications.
Dutch, Hydrogen, Strategy, Infrastructure, Targets
Mixed Chart
McKinsey
Saved
This slide features a stacked column chart showing the CPI annual change contribution by category from 2019 to 2023. The chart uses different colors for services, energy, goods, and food, and it's presented over a white background with the title at the top.
Financial Performance
Financial Services
An analytical slide detailing contributions to the Consumer Price Index (CPI) by category, focusing on changes in inflation. It is suitable for discussions on economic health and policy decisions.
CPI, Inflation, Energy, Goods, Services, Food, Economic Analysis, Column Chart, Price Index, July
Single Chart
McKinsey
Saved
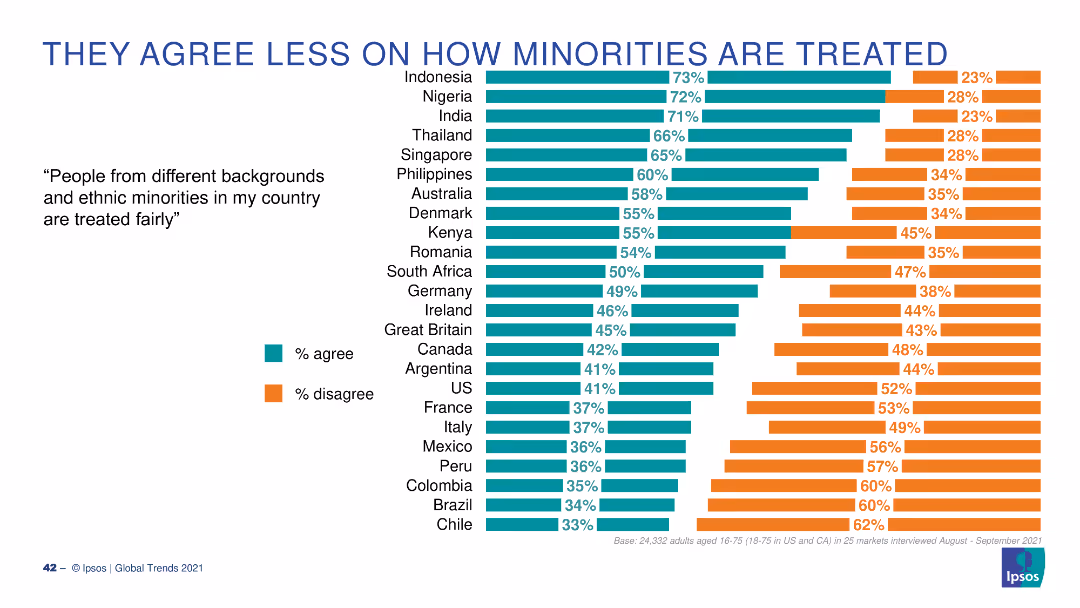
A bar chart with horizontal bars illustrating the percentage of people who agree or disagree that ethnic minorities are treated fairly in their country, across various countries.
Market Analysis and Trends
Government & Public Sector
This slide presents global survey data on the perception of fair treatment of ethnic minorities, showing significant differences in agreement levels across countries.
minorities, treatment, fairness, global, survey
Multiple Chart
IPSOS
Saved
Features a stacked area chart showing the proportion of new COVID-19 cases by region over time, highlighting shifts from January to July 2020.
Market Analysis and Trends
Healthcare & Pharmaceuticals
Tracks the change in the distribution of new COVID-19 cases globally, illustrating the shifts from predominantly European to North American, Latin American, and Asian regions, providing a timeline of the pandemic spread.
COVID-19, cases, global, trends, 2020
Single Chart
McKinsey
Saved
Slide showing a timeline with a series of column charts depicting the number of deals and their value in the Vietnamese internet sector, annotated with year labels.
Investment Analysis
Technology & Software
Offers an investment overview of Vietnam's internet sector, detailing the number of deals and their values over time. It serves to analyze investment trends and assess the sector's growth, valuable for stakeholders and investors considering the Vietnamese market.
investment, internet sector, Vietnam, deals, growth trend, market analysis
Single Chart
Bain
Saved
Includes maps and column charts detailing school connectivity and population distribution across Indonesian regions. Color gradations indicate connectivity levels and population densities, with annotations providing regional data and trends.
Market Analysis and Trends
Education & Training
Details the disparity in school connectivity across Indonesia, with a focus on Sumatra's lag in internet access despite high connectivity in more populated regions like Java. Discusses the implications for educational equity and digital access.
school connectivity, internet access, regional disparity, Sumatra, Java
Multiple Chart
BCG
Saved
Contains a timeline and bar graphs showing investment amounts for top FoodTech deals in Europe over three years, with flag icons for company countries.
Investment Analysis
Agriculture & Food Production
Provides details on significant 2020 FoodTech deals in Europe, such as investments in Karma and Oatly. Highlights a shift from food delivery to upstream value chains like AgTech and Food Science, with a focus on sector investment trends.
FoodTech, Europe, 2020, Investment Trends, Top Deals, AgTech, Food Science
Multiple Chart
Accenture
Saved
Previous
Next
If nothing, comes up, please save your slides first
Create a FREE account to continue browsing
Receive Instant Access to 1,000+ slides from companies like McKinsey, Google, and Goldman Sachs
First Name
Last Name
Email
Password
I agree to all
Terms & Privacy Policy
Thank you! Your submission has been received!
Oops! Something went wrong while submitting the form.
Have an account?
Sign in
Column Chart
Heatmap
Chevron
Org Chart
Infographic
Callouts
Timeline
List
Graphic
Picture
Process Flow
Diagram
Paragraph
Map
Table
Framework
Subtitle
Takeaway Box
Icon
Other Chart
Radar Chart
Waterfall Chart
Mekko Chart
Pie Chart
Scatter Plot
Line Chart
Bar chart
Bullet points