My Account
My Slides
Search by Category
Templates
View All Templates
Download Template Slides
Leave Feedback
Login
Logout
Get Started
Browse all Slides
Browse all Slides
Create a FREE Account
Instant access to 1,000+ real slides from top companies like McKinsey, BCG, Goldman Sachs, Google and many more!
First Name
Last Name
Email
Password
I agree to all
Terms & Privacy Policy
Thank you! Your submission has been received!
Oops! Something went wrong while submitting the form.
Have an account?
Sign in
Saved Slides
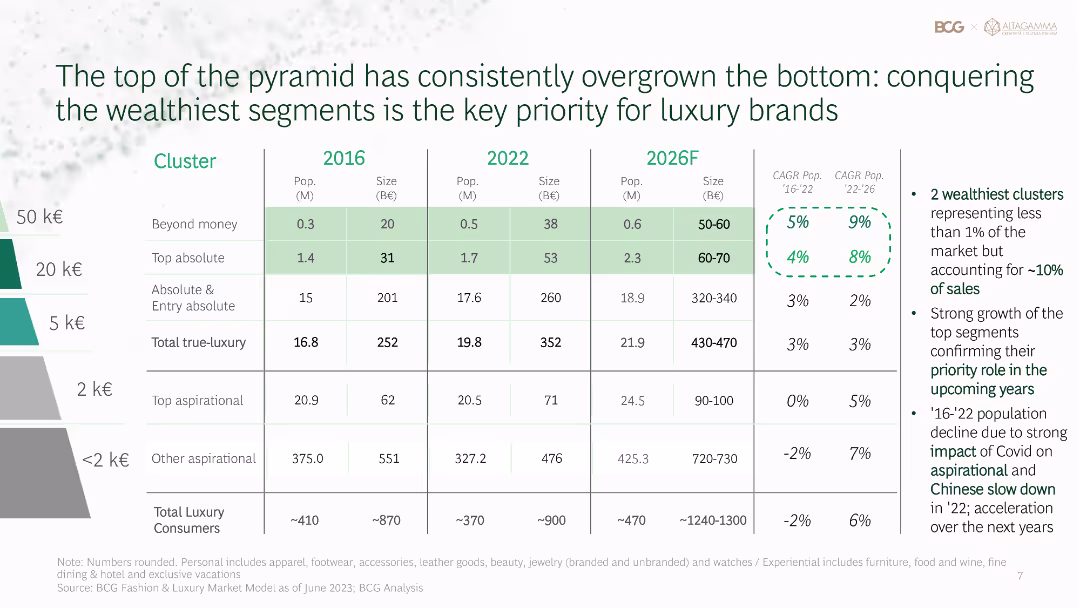
Table showing the segmentation of the luxury market by wealth clusters, with data on population, market size, and growth rates for different years and projections.
Market Analysis and Trends
Financial Services
Analyzes the segmentation of the luxury market, showing the growth of the wealthiest segments and the projected market size and population for 2026.
luxury market, wealth segments, market size, population, growth rates
Table
BCG
Saved
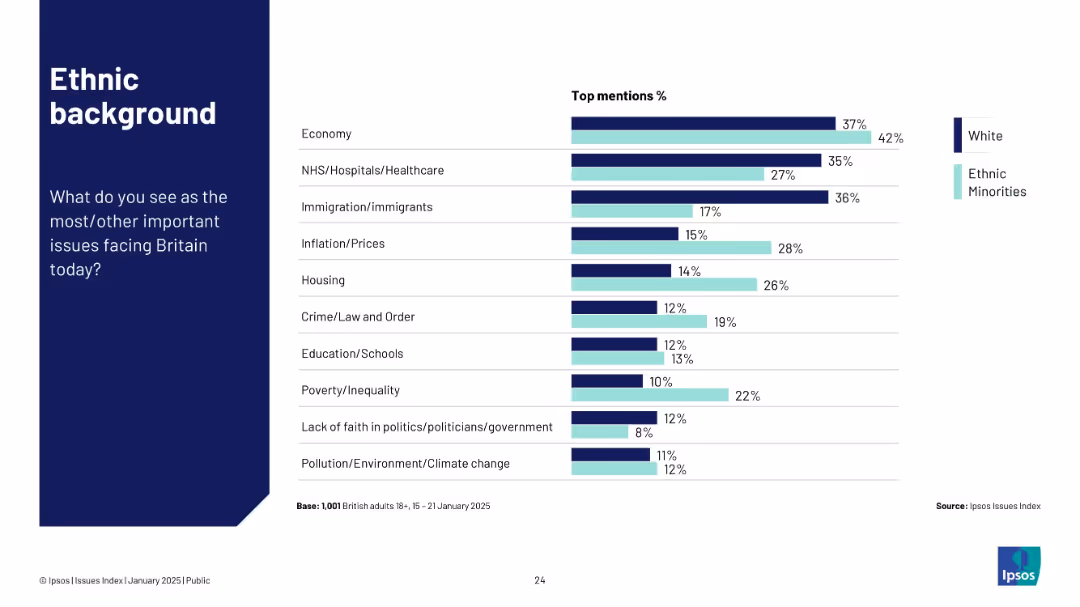
Horizontal bar chart comparing White and Ethnic Minority groups on top national issues.
Customer and Market Segmentation
Government & Public Sector
This slide compares ethnic backgrounds on top concerns in the UK. Ethnic minorities place higher emphasis on housing, inflation, and crime than White respondents. Economy remains a key issue across both groups.
ethnicity, public opinion, inflation, housing, crime, Ipsos
Mixed Chart
IPSOS
Saved
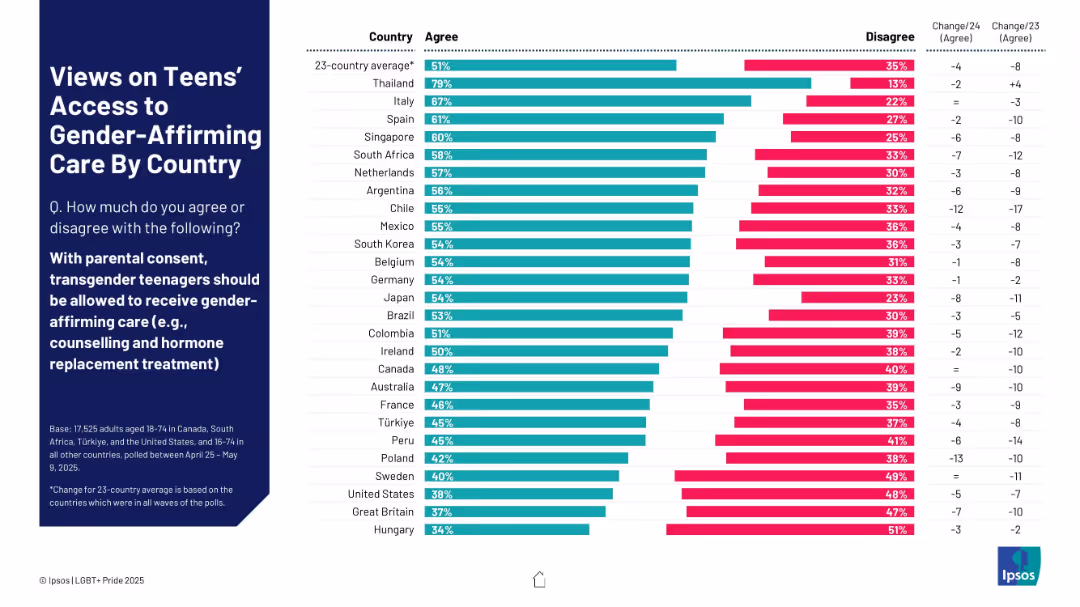
Horizontal bar chart by country; agree/disagree percentages with trend deltas
Regulatory and Compliance
Government & Public Sector
The slide explores global opinions on whether transgender teens should access gender-affirming care with parental consent. Thailand leads with 79% agreement, while Hungary ranks lowest at 34%. Opposition is substantial in several Western countries, with notable trend declines from 2023 to 2025.
gender-affirming care, transgender youth, healthcare, public opinion, parental consent, Ipsos, countries
Mixed Chart
IPSOS
Saved
Text outlining secured funding characteristics next to a column chart showing total collateralized financings in billions over several quarters. The slide uses check marks for key attributes such as diversification and liquidity stress testing.
Operational Efficiency
Financial Services
Highlights the characteristics and strategic approach to secured funding, including the importance of diversified counterparty risk and term composition. It shows the consistency in total collateralized financings, emphasizing robust risk management through stress testing.
secured funding, diversification, risk management, collateralized financings, column chart
Mixed Chart
Goldman Sachs
Saved
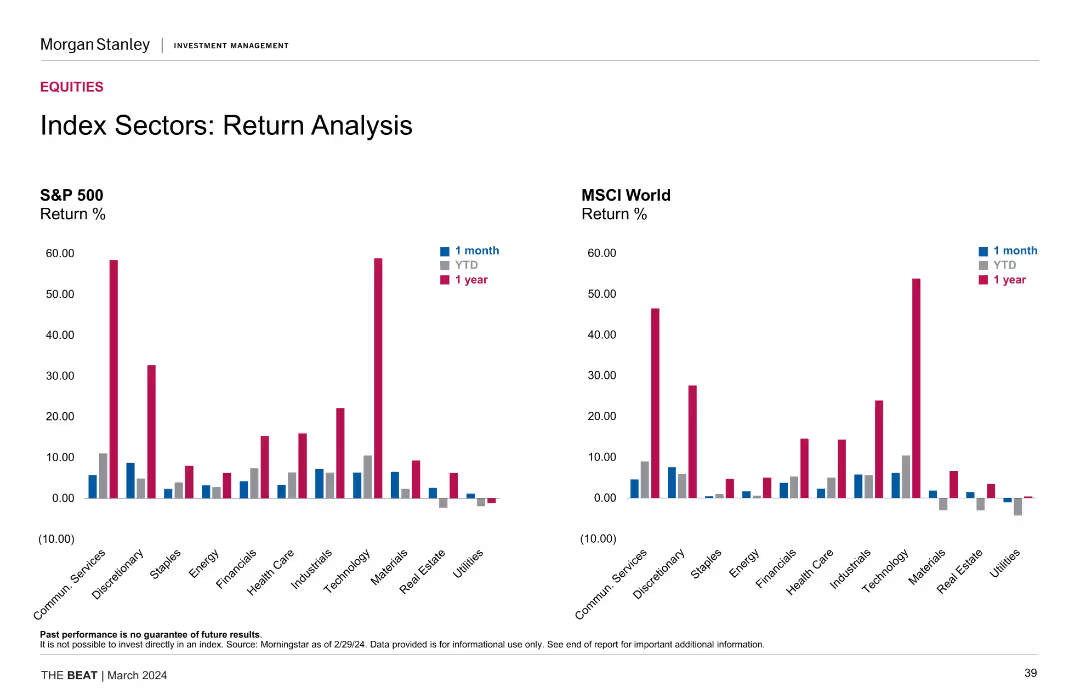
This slide showcases two sets of column charts comparing the 1-month, YTD, and 1-year returns of the S&P 500 and MSCI World indices across various sectors. Each chart uses distinct colors to differentiate between the time periods.
Financial Performance
Financial Services
The slide compares the performance of different sectors within the S&P 500 and MSCI World indices, showing returns over 1-month, YTD, and 1-year periods, helping in understanding sector-specific performance trends.
sector analysis, return analysis, S&P 500, MSCI World, performance comparison, financial metrics, sector returns
Multiple Chart
Morgan Stanley
Saved
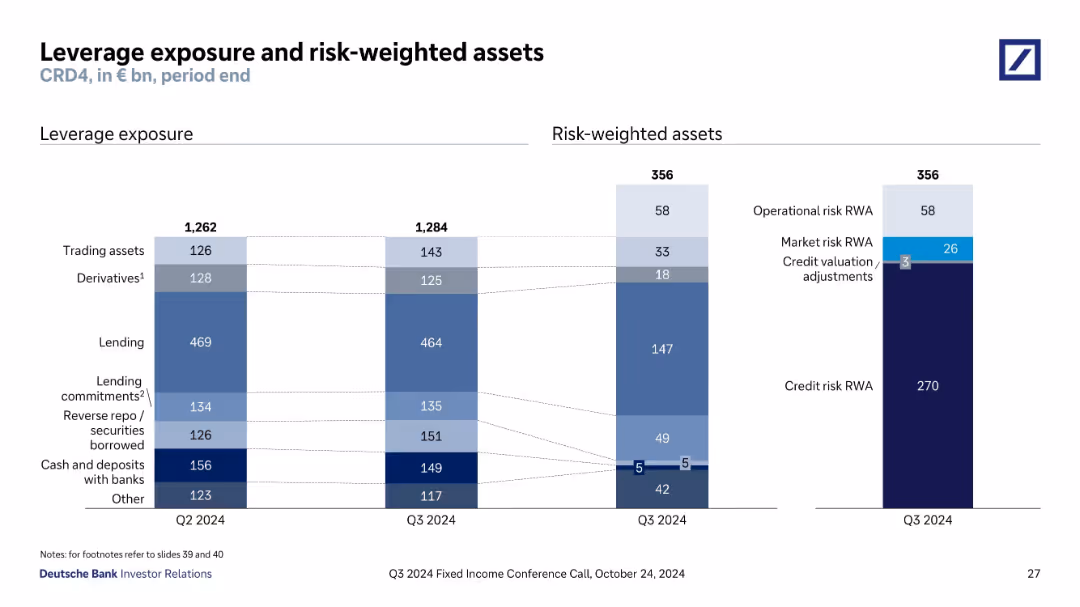
Split bar charts showing leverage exposure and risk-weighted assets across categories; clean layout, muted color palette; side-by-side comparison of Q2 and Q3 2024
Risk Assessment and Management
Financial Services
The slide breaks down Deutsche Bank’s leverage exposure and risk-weighted assets by asset class as of Q2 and Q3 2024, including lending, trading, and derivatives. It highlights shifts between quarters and categorizes risks (credit, market, operational).
leverage exposure, risk-weighted assets, derivatives, lending, credit risk, market risk, operational risk, Q3 2024, Deutsche Bank, financial risk
Multiple Chart
Deutsche Bank
Saved
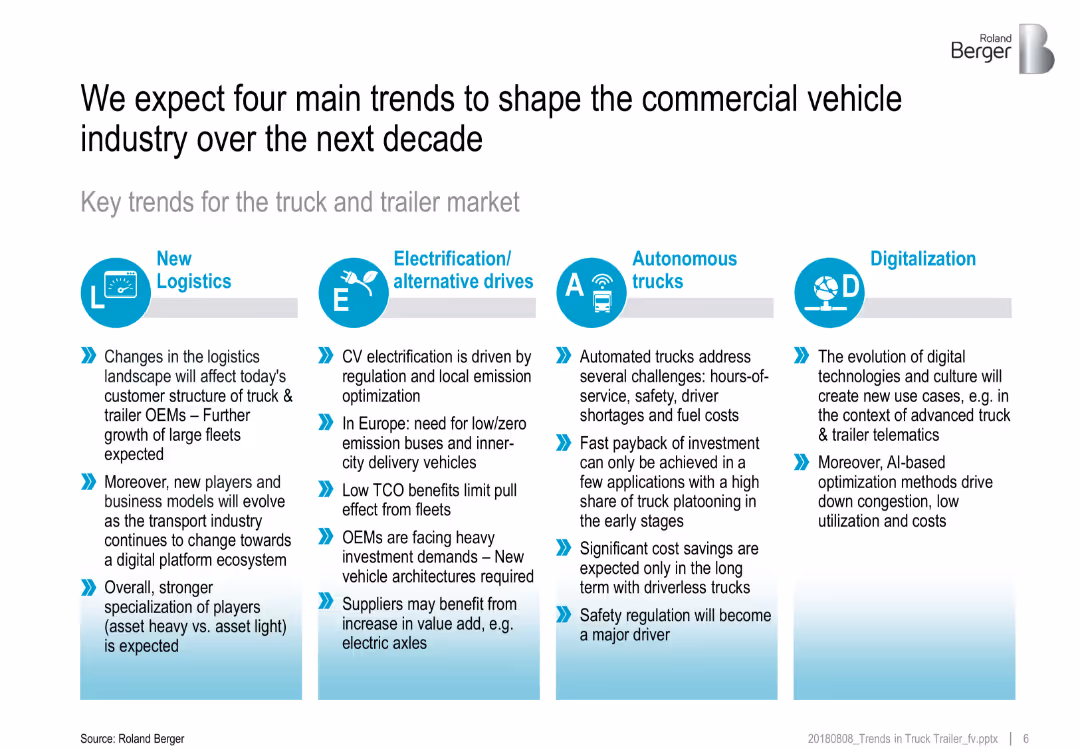
Four-column layout, each trend in a box with icon and bullets below; visually segmented with light blue gradients
Strategic Planning
Transportation & Logistics
This slide identifies four transformative trends in the truck/trailer industry: New Logistics, Electrification, Autonomous Trucks, and Digitalization. Each trend is explained with its drivers and implications, indicating industry-wide shifts toward smarter and more sustainable operations.
truck market, logistics, electrification, autonomous trucks, digitalization, industry trends, future of transport
Pillar
Roland Berger
Saved
The slide features a bar chart representing investment values across sectors with a key data point highlighted in green. It maintains visual simplicity while conveying quantitative information.
Investment Analysis
Financial Services
An analysis of Q1 2020 investments into emerging internet and tech firms, beneficial for financial and investment strategy discussions, especially within the tech industry.
investments, financial strategy, tech industry, Q1 2020, emerging firms
Single Chart
Bain
Saved
The slide includes column charts and a line chart illustrating the sensitivity of group revenues to interest rates and CHF yield curve shifts.
Financial Performance
Financial Services
This slide discusses the cumulative group revenues sensitivity of CHF ~0.9 bn by 2025 vs. 2022 and the impact of higher forward rate expectations.
revenues, interest rates, forward rate, yield curve, funding costs
Multiple Chart
Credit Suisse
Saved
A line chart displays systemic stress indicators for the US, Euro Area, and UK, with a commentary section on the right. The y-axis represents stress levels, and the x-axis shows years.
Risk Assessment and Management
Financial Services
The slide reviews systemic financial stress in major economies, noting reduced stress levels since March 2023 peak and discussing potential financial pressures going into 2024.
Financial stress, economic downturn, systemic stress, financial indicators, market trends
Mixed Chart
Accenture
Saved
Stacked line chart depicting quarterly podcast ad revenues from 2015 to 2020.
Financial Performance
Media & Entertainment
Analyzes seasonal trends and growth in podcast advertising revenues.
podcast, ad revenue, quarterly trends, revenue distribution
Single Chart
PwC/Strategy&
Saved
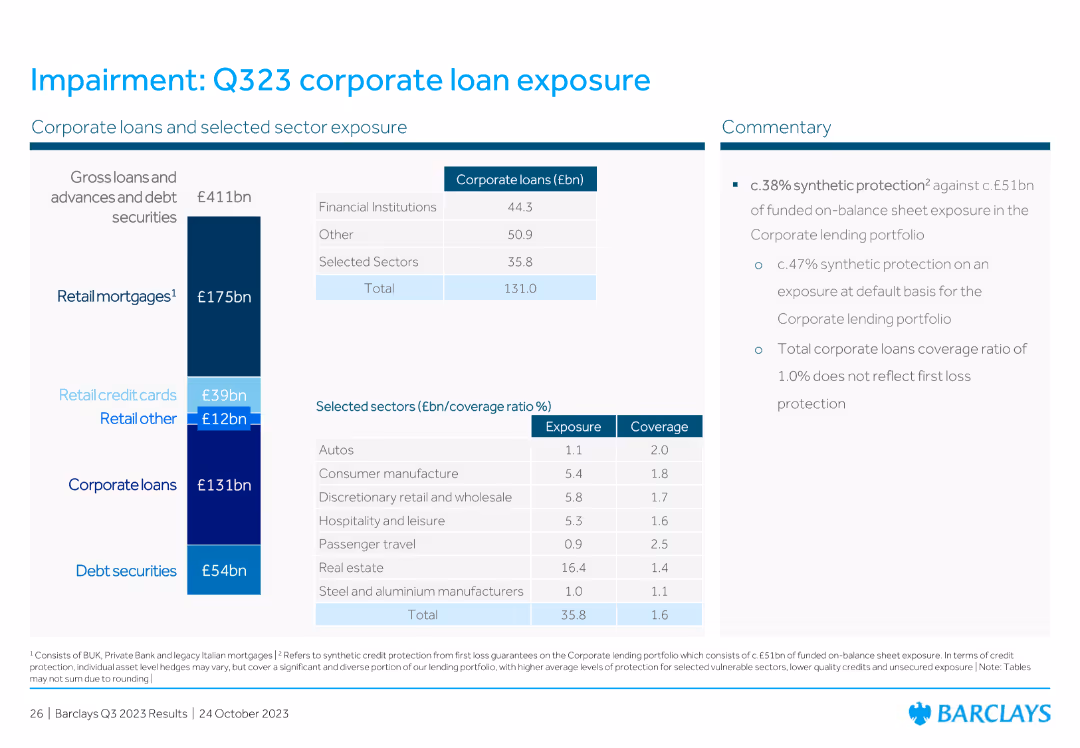
Includes a vertical bar chart detailing corporate loans and sector exposure, accompanied by a commentary section. The slide is neatly organized with clear data presentation.
Risk Assessment and Management
Financial Services
This slide highlights corporate loan exposure as of Q323, with specific sector breakdowns and synthetic protection measures. It offers a detailed view of financial stability and risk management.
corporate loans, sector exposure, synthetic protection, financial stability, risk management, Q323, commentary
Mixed Chart
Barclays
Saved
The slide includes a column chart tracking CET1 ratio development over time, with additional text boxes explaining different factors influencing the CET1 ratio.
Financial Performance
Financial Services
This slide projects the group’s CET1 ratio aiming for a target of more than 13.5% by 2025, explaining the various financial actions and changes that will influence this target.
CET1 ratio, financial targets, performance metrics, capital planning, investment strategy
Single Chart
Credit Suisse
Saved
Displays a column chart of Net Promoter Score (NPS) for France from 2013-2018, highlighting detractors, passives, and promoters, with key business insights.
Corporate Finance and Valuation
Financial Services
Evaluates France's Net Promoter Score (NPS) as an investment destination, detailing the perspectives of various business stakeholders on its market potential.
NPS, France, investment destination, business perspectives, market analysis
Mixed Chart
Bain
Saved
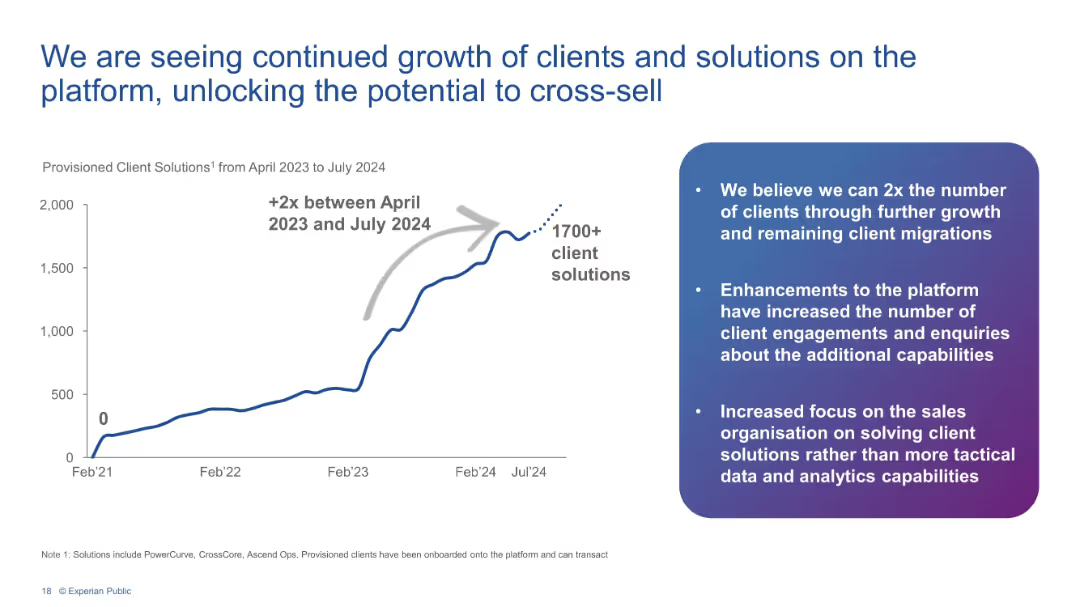
Line chart showing 2x growth in client solutions from Apr 2023 to Jul 2024 with bulleted insights.
Performance Metrics and KPIs
Financial Services
Depicts a sharp increase in provisioned client solutions to over 1700, doubling since April 2023. Accompanying text explains platform enhancements, client engagement growth, and cross-sell opportunities.
client growth, platform, Experian, KPIs, cross-sell, analytics, solutions, engagement
Mixed Chart
Barclays
Saved
This slide features a header, body text, and four circular percentage indicators. Each indicator highlights consumer willingness to use technology-enhanced care methods such as genetic testing, wearable sensors, non-urgent care at retail locations, and personalized medications.
Technology and Digital Transformation
Healthcare & Pharmaceuticals
The slide discusses the openness of Irish consumers to adopt technology-enhanced care for personalized healthcare experiences. It emphasizes the willingness to use genetic testing, wearable sensors, and non-urgent care in retail settings.
healthcare, personalized care, technology, Ireland, genetic testing
Mixed Chart
EY
Saved
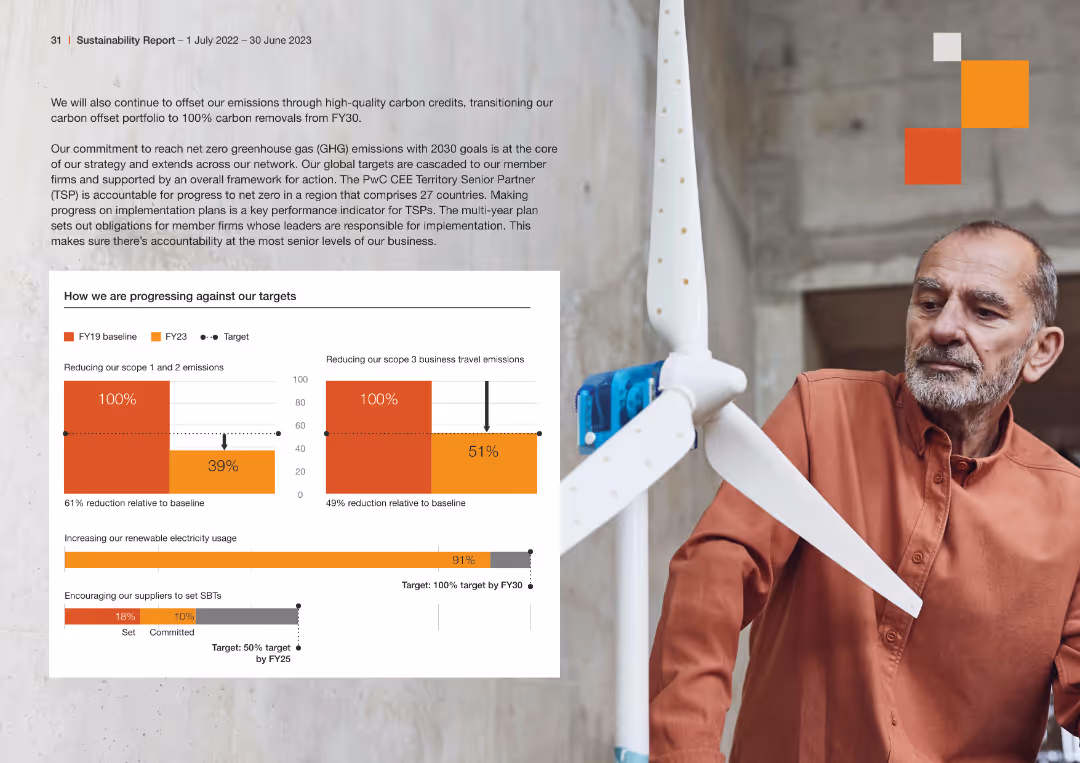
Bar charts showing progress against targets for reducing scope 1, 2, and 3 emissions, increasing renewable electricity usage
Regulatory and Compliance
Environmental Services & Sustainability
The slide outlines the progress made in FY23 towards reducing carbon emissions and increasing renewable energy usage, comparing it against baseline targets, highlighting significant reductions and ongoing commitments
carbon emissions, progress, renewable energy, regulatory compliance, FY23
Multiple Chart
PwC/Strategy&
Saved
The slide includes a column chart showing the number of CCUS projects by region and status (operational, in development, completed, cancelled).
Market Analysis and Trends
Energy & Utilities
Analyzes the status of global CCUS projects by region, focusing on OECD countries and noting a high number of project cancellations and terminations.
OECD, CCUS, project status, regional analysis, cancellations, development, operational, terminated, trends
Mixed Chart
Kearney
Saved
Slide displays a bar chart with blue bars, listing percentages of VC interest in Web3 areas. Accompanied by quotes on the right side against a gray backdrop. The chart is a column chart, not a bar chart.
Investment Analysis
Technology & Software
Focuses on the growing interest in Web3 sectors among VCs, showing the percentage of VCs investing in areas like privacy, DeFi, and blockchain, with expectations for the future.
Web3, venture capital, investment, privacy, DeFi, blockchain, DAOs, Metaverse, crypto, NFTs
Single Chart
Bain
Saved
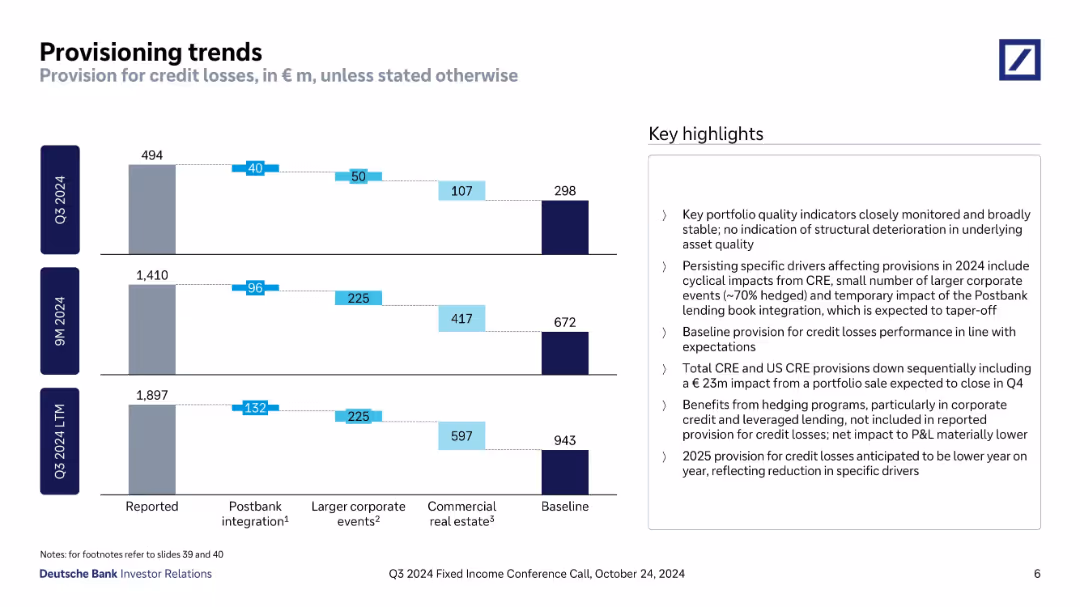
Vertical bar chart decomposing credit loss provisions for Q3 2024, 9M 2024, and Q3 LTM into Postbank, corporate events, and CRE. Sidebar with detailed insights.
Risk Assessment and Management
Financial Services
Breaks down total provisioning into components such as Postbank integration and real estate. Highlights stable asset quality, tapering impact from specific events, and anticipates lower provisions in 2025 due to waning special drivers.
credit provision, Postbank, CRE, provisioning trend, risk management, 9M 2024, baseline provisions
Mixed Chart
Deutsche Bank
Saved
Features a series of column charts in varying shades of green, showing the utilization of first party data across maturity stages. The layout is effective in conveying comparative data.
Market Analysis and Trends
Media & Entertainment
Highlights the importance of leveraging first party data in marketing campaigns across different maturity stages. This slide is useful for analyzing data utilization trends and planning data-driven marketing strategies.
first party data, marketing campaigns, data utilization, maturity stages, data-driven marketing, column chart, comparative analysis, trend analysis
Single Chart
BCG
Saved
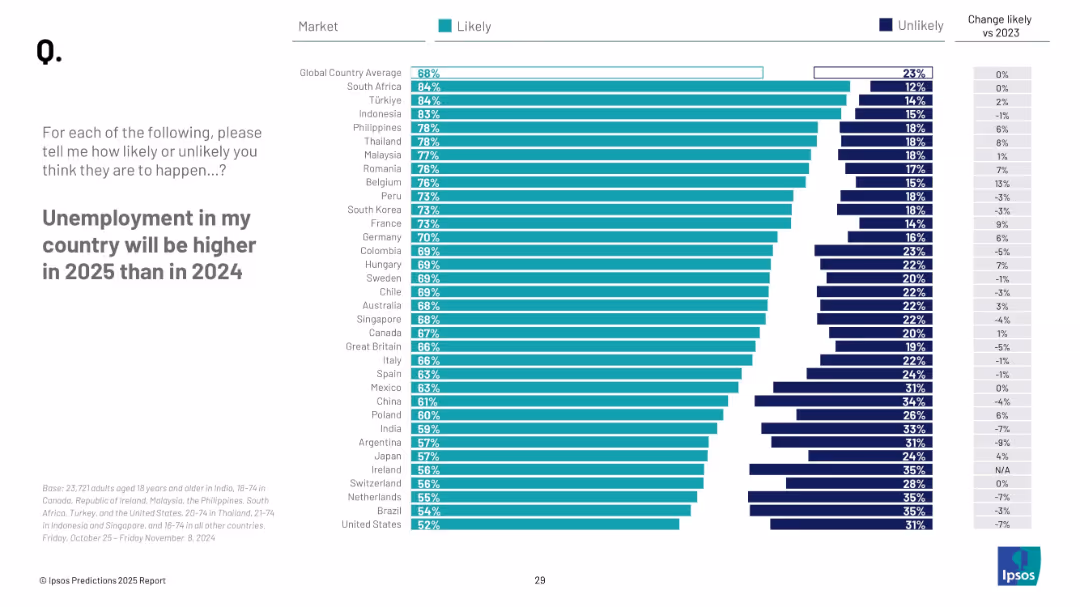
Horizontal bar chart with turquoise (likely) and navy (unlikely) values. Includes country-specific data, global average, and a column indicating change from 2023. Minimalist layout with clean fonts and white background.
Performance Metrics and KPIs
Government & Public Sector
This slide shows the percentage of people in different countries who believe unemployment will increase in 2025. South Africa, Türkiye, and Indonesia top the list. It also includes comparisons to 2023 figures, indicating changes in sentiment.
unemployment, 2025, public opinion, likelihood, Ipsos, labor market
Mixed Chart
IPSOS
Saved
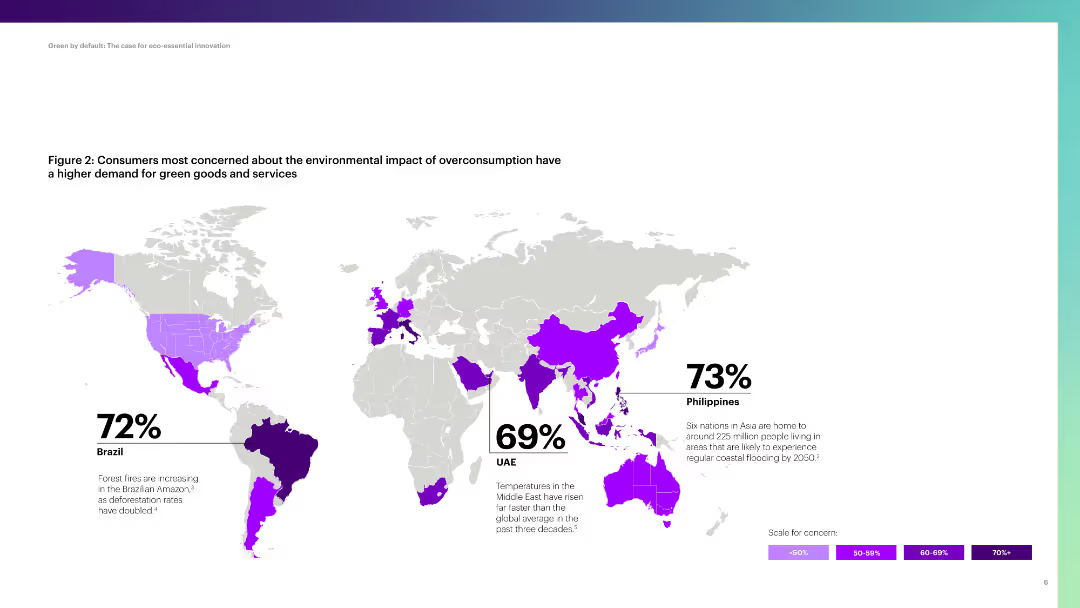
World map highlighting countries with high concern about overconsumption and demand for green goods, with Brazil, UAE, and Philippines featured.
Customer and Market Segmentation
Environmental Services & Sustainability
The slide shows global consumer concerns about overconsumption and the demand for green products, focusing on key countries.
overconsumption, green goods, demand, Brazil, UAE, Philippines, sustainability
Graphic
Accenture
Saved
Slide with column chart comparing investment banking net revenues, alongside a table detailing financial metrics such as net revenues, earnings, and equity. The graphs use blue and white bars, and the layout is clean and data-focused.
Investment Analysis
Financial Services
Summarizes the financial results and highlights of investment banking activities, suitable for investor briefings or financial strategy meetings. It provides insights into areas like equity, debt underwriting, and financial advisory services.
Investment Banking, Net Revenue, Financial Advisory
Mixed Chart
Goldman Sachs
Saved
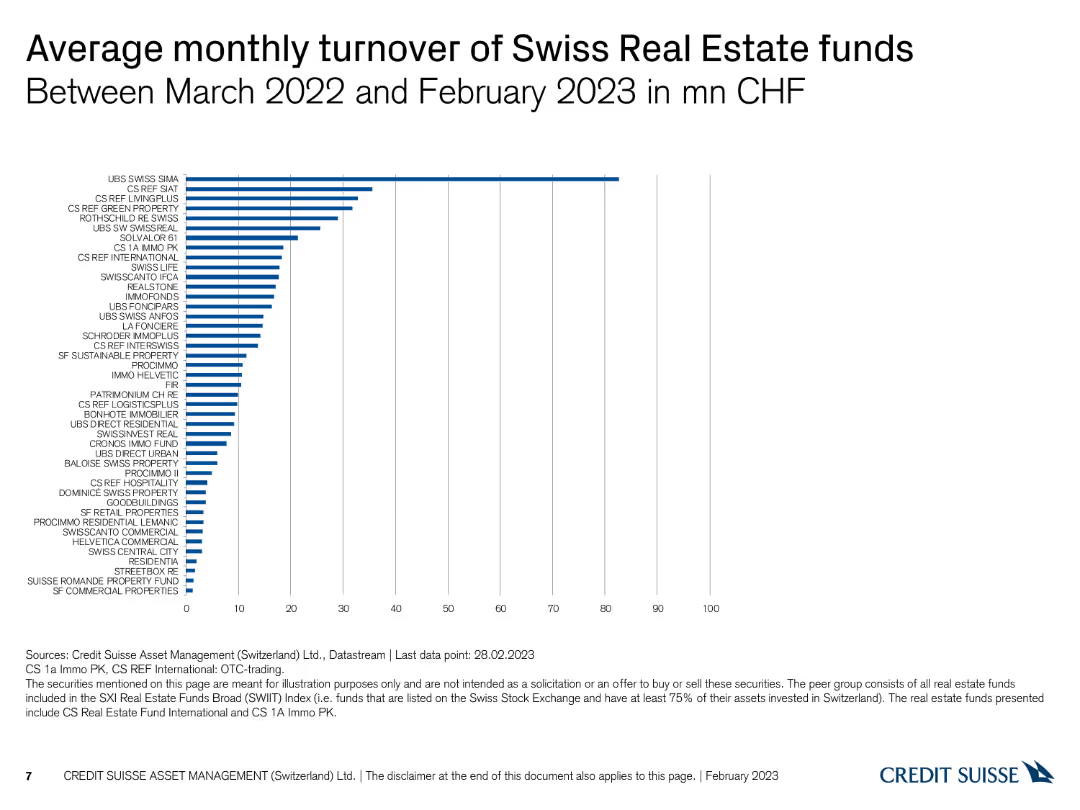
The slide includes a column chart displaying the average monthly turnover of Swiss real estate funds in million CHF.
Financial Performance
Real Estate & Construction
This slide reports the average monthly turnover of various Swiss real estate funds from March 2022 to February 2023, measured in million CHF.
Swiss real estate, turnover, monthly turnover, column chart, CHF
Single Chart
Credit Suisse
Saved
Previous
Next
If nothing, comes up, please save your slides first
Create a FREE account to continue browsing
Receive Instant Access to 1,000+ slides from companies like McKinsey, Google, and Goldman Sachs
First Name
Last Name
Email
Password
I agree to all
Terms & Privacy Policy
Thank you! Your submission has been received!
Oops! Something went wrong while submitting the form.
Have an account?
Sign in
Column Chart
Heatmap
Chevron
Org Chart
Infographic
Callouts
Timeline
List
Graphic
Picture
Process Flow
Diagram
Paragraph
Map
Table
Framework
Subtitle
Takeaway Box
Icon
Other Chart
Radar Chart
Waterfall Chart
Mekko Chart
Pie Chart
Scatter Plot
Line Chart
Bar chart
Bullet points