My Account
My Slides
Search by Category
Templates
View All Templates
Download Template Slides
Leave Feedback
Login
Logout
Get Started
Browse all Slides
Browse all Slides
Create a FREE Account
Instant access to 1,000+ real slides from top companies like McKinsey, BCG, Goldman Sachs, Google and many more!
First Name
Last Name
Email
Password
I agree to all
Terms & Privacy Policy
Thank you! Your submission has been received!
Oops! Something went wrong while submitting the form.
Have an account?
Sign in
Saved Slides
Comparative bar charts displaying GDP growth forecasts against baseline for 2020 and 2021, offering a global perspective with specific focus on major economies.
Financial Performance
Financial Services
Offers insights into the projected global economic downturn in 2020 and recovery prospects for 2021, based on GDP growth forecasts from various sources.
GDP growth, economic forecasts, 2020 downturn, 2021 recovery, global economy, financial analysis, investment planning
Multiple Chart
BCG
Saved
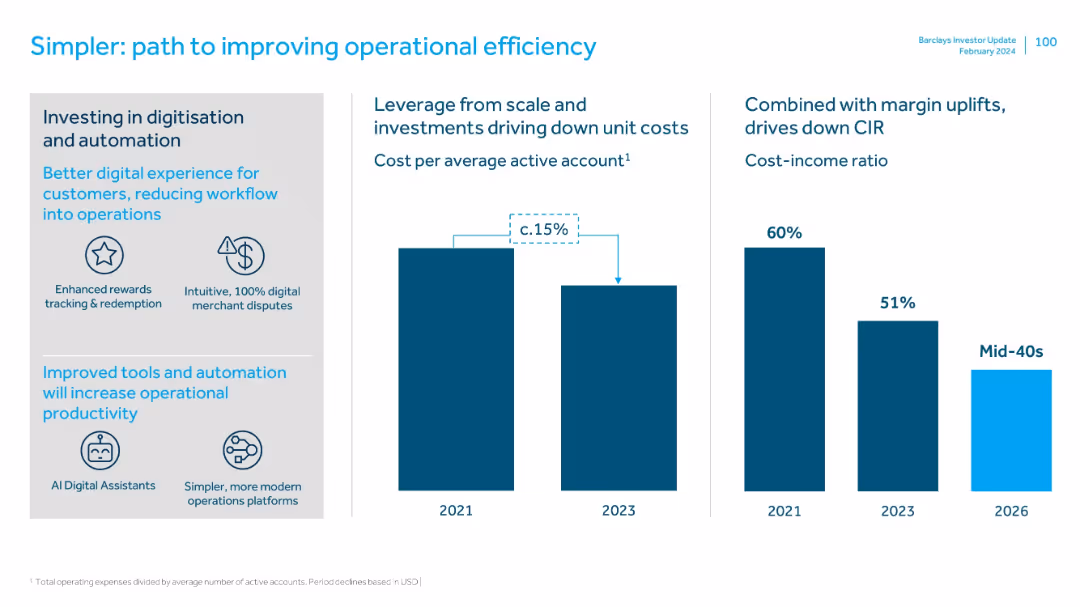
Three-panel layout: investment areas on left, cost impact in center, CIR reduction on right. Uses icons and bar charts.
Operational Efficiency
Financial Services
Describes investments in digitization and automation that are reducing unit costs and operational inefficiencies. Shows cost savings and CIR reduction from 2021 to a projected mid-40s% by 2026.
digitization, automation, cost savings, CIR, operational efficiency, AI tools, scaling
Multiple Chart
Barclays
Saved
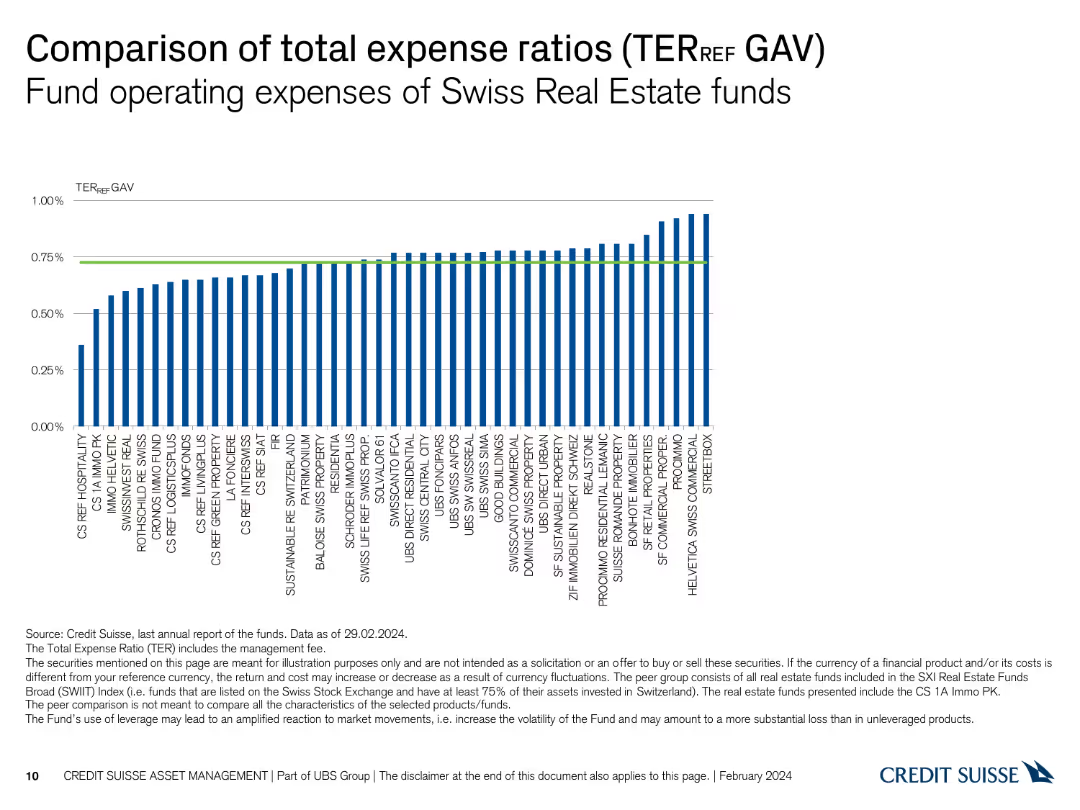
Column chart comparing total expense ratios (TER) for various Swiss real estate funds.
Financial Performance
Real Estate & Construction
Compares the total expense ratios (TER) for different Swiss real estate funds, showing operational expenses.
real estate, expense ratios, TER, operational expenses, comparison
Single Chart
Credit Suisse
Saved
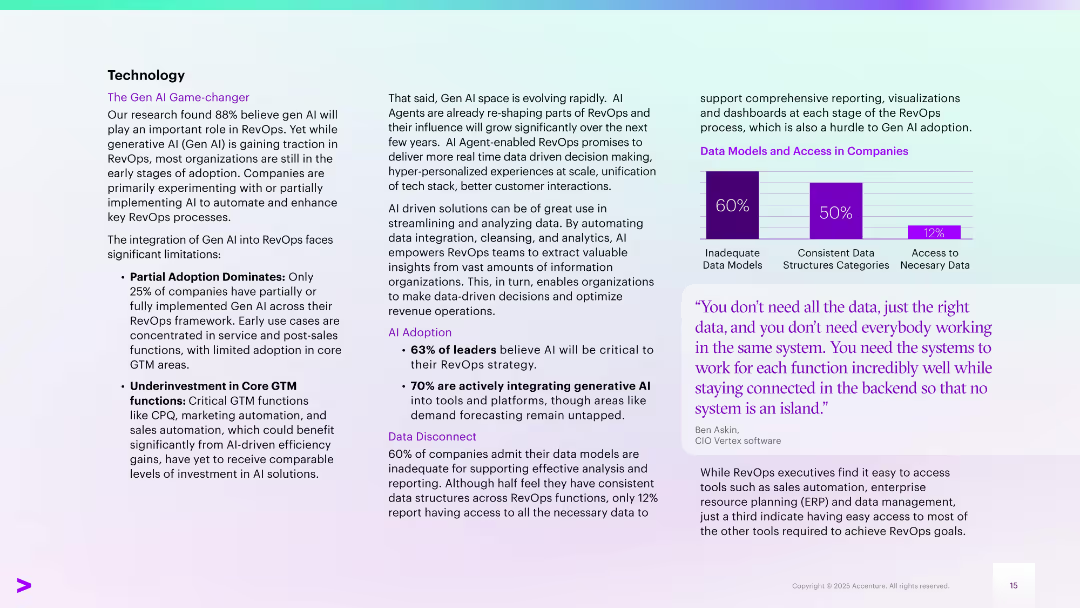
Two-column layout with bullet points on the left and highlighted stats and charts on the right. Includes a purple bar chart and a quote box. Uses purple and teal gradients.
Technology and Digital Transformation
Technology & Software
Discusses Gen AI adoption in RevOps, noting early-stage use, limited adoption in core GTM areas, and investment gaps. Highlights the growing role of AI agents and data integration issues. Features statistics on AI adoption and access to data, with a quote emphasizing the importance of system integration.
Gen AI, RevOps, automation, data models, AI adoption, GTM, integration
Mixed Chart
Accenture
Saved
Split layout with text and bullet points detailing vaccine efficacy scenarios, complemented by quotes and regulatory considerations.
Regulatory and Compliance
Healthcare & Pharmaceuticals
Discusses the implications of different COVID-19 vaccine efficacy rates on public health strategy and vaccine adoption policies.
efficacy, vaccine, COVID-19, health policy
Header Vertical
BCG
Saved
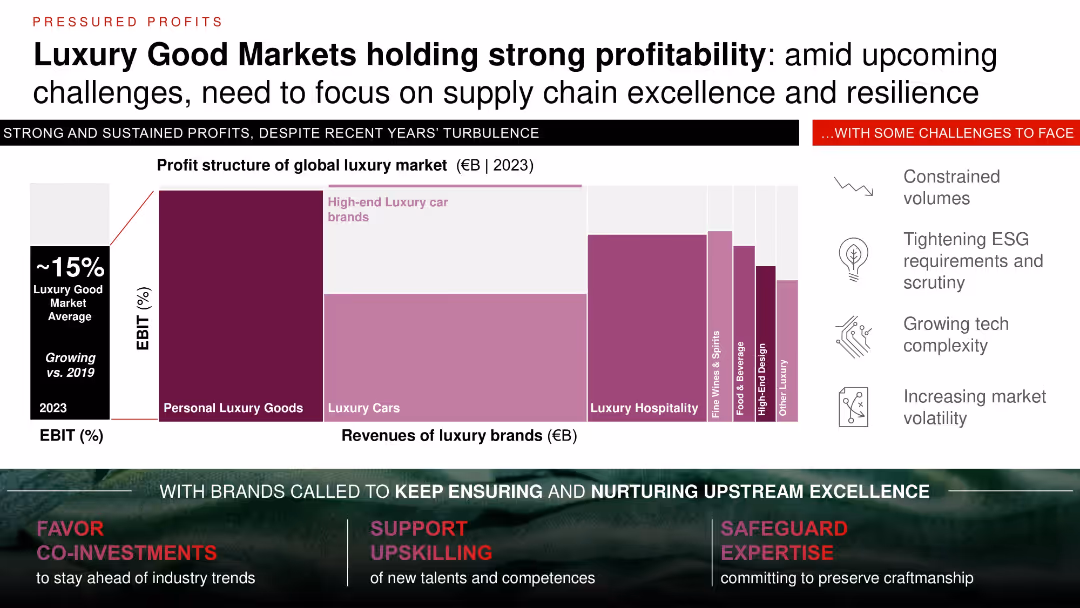
Waterfall bar chart and stacked segment comparison with icons outlining challenges; white background with dark red/maroon accent colors.
Industry Overview
Consumer Goods
Despite economic turbulence, luxury goods maintain ~15% EBIT, driven by high-end segments like cars and personal goods. Challenges include ESG regulations, tech complexity, and volatility. Emphasizes continued investment in supply chain resilience and upstream excellence to sustain performance.
luxury market, profitability, supply chain, ESG, resilience, EBIT, upstream, challenges
Mixed Chart
Bain
Saved
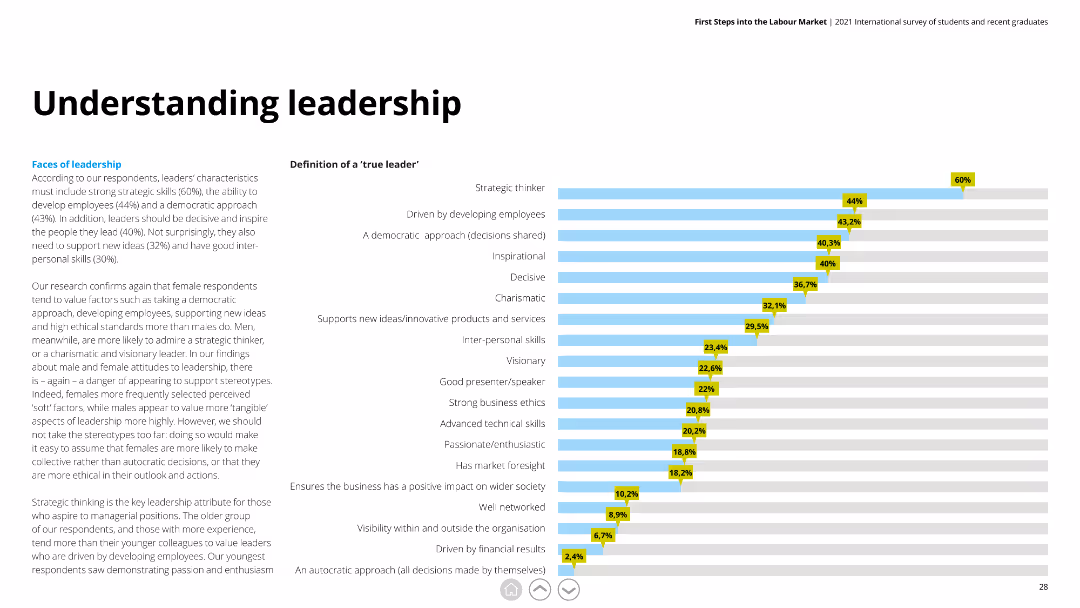
Horizontal bar chart showing traits of a 'true leader' with percentages, accompanied by detailed text discussing gender differences in leadership preferences.
Human Resources and Talent Management
Education & Training
This slide examines essential leadership traits according to respondents, highlighting strategic thinking and employee development as top characteristics.
leadership, strategic thinking, employee development, gender differences, traits
Mixed Chart
Deloitte
Saved
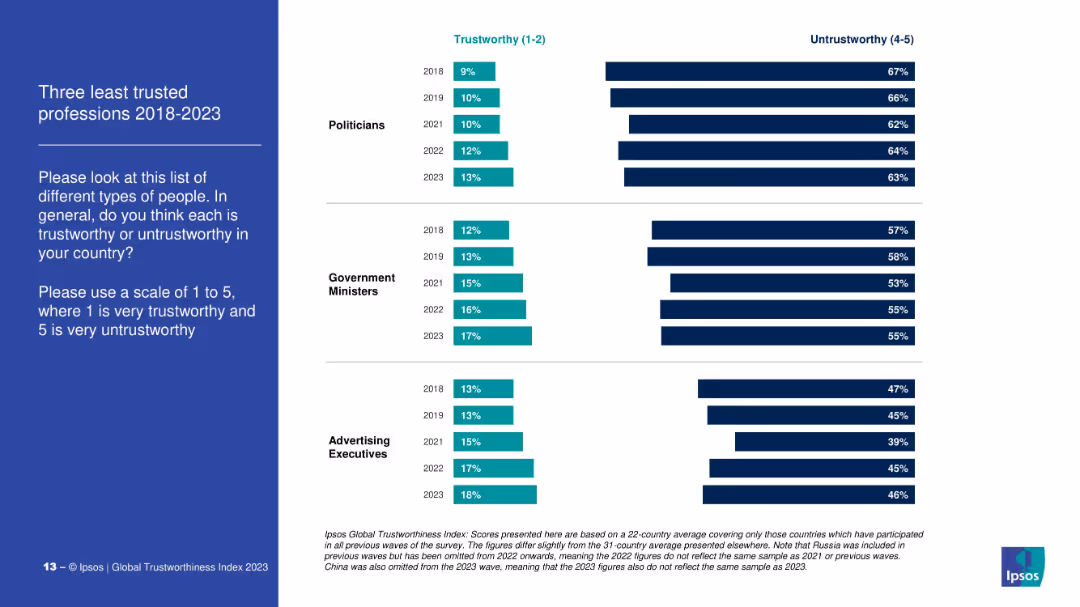
Dual bar chart comparing % of people who consider three professions (politicians, gov’t ministers, ad execs) trustworthy vs. untrustworthy from 2018 to 2023.
Market Analysis and Trends
Government & Public Sector
This slide examines public perception of the least trusted professions, contrasting the proportion of people rating them as trustworthy (1–2) and untrustworthy (4–5). Politicians are consistently ranked the lowest across all years.
distrust, politicians, government, advertising, perception, Ipsos, trust ranking, public opinion
Mixed Chart
IPSOS
Saved
Contains two main tables and a highlights section. The tables present financial data including revenue and net income, with percentage changes highlighted.
Financial Performance
Financial Services
Provides a snapshot of financial performance metrics for Q3 2023, comparing quarter-over-quarter and year-over-year data. Key metrics include net income, EPS, and RoTE, offering insights into financial health and operational success.
Financial, Performance, Revenue, Net Income, EPS
Mixed Chart
Citigroup
Saved
Includes a column chart with blue and yellow columns, labeled with percentages and SEA country flags at the bottom.
Market Analysis and Trends
Technology & Software
Shows the proportion of new digital service consumers in SEA countries, highlighting how COVID-19 has affected digital adoption.
digital service, consumers, SEA, COVID-19, adoption
Single Chart
Bain
Saved
The slide is organized around a circular diagram that links various operational initiatives under the umbrella of "Seadrill Solutions." Accompanying this are images of drilling equipment and operational diagrams, providing a visual representation of the services mentioned. Text blocks list key strategies like Managed Pressure Drilling and Integrated Performance Management. The layout is dynamic yet clear, with a color scheme that supports readability and draws attention to key areas.
Operational Efficiency
Energy & Utilities
The slide outlines Seadrill's strategies for improving its competitive edge through various integrated services and innovations in drilling. Each strategy is briefly explained, and its significance to Seadrill's operations is highlighted. This slide is likely used in strategic meetings or operational reviews to discuss ways to enhance efficiency, reduce costs, and improve safety in operations. It serves to inform and potentially persuade stakeholders of the merits of ongoing and future initiatives aimed at operational excellence.
competitive, Seadrill, strategies, operations, drilling, efficiency, innovation, services, diagram, performance management
Vertical Flow
Barclays
Saved
Features a combination of textual content and simple graphics to illustrate Barclays' strategies for deepening client relationships and expanding services.
Client Case Studies
Financial Services
Focuses on Barclays' strategies for revenue growth through enhanced client relations, detailing initiatives like hiring in key regions, expanding digital and sustainable offerings, and investing in data capabilities.
client relationships, growth, digital, sustainability
Linear Flow
Barclays
Saved
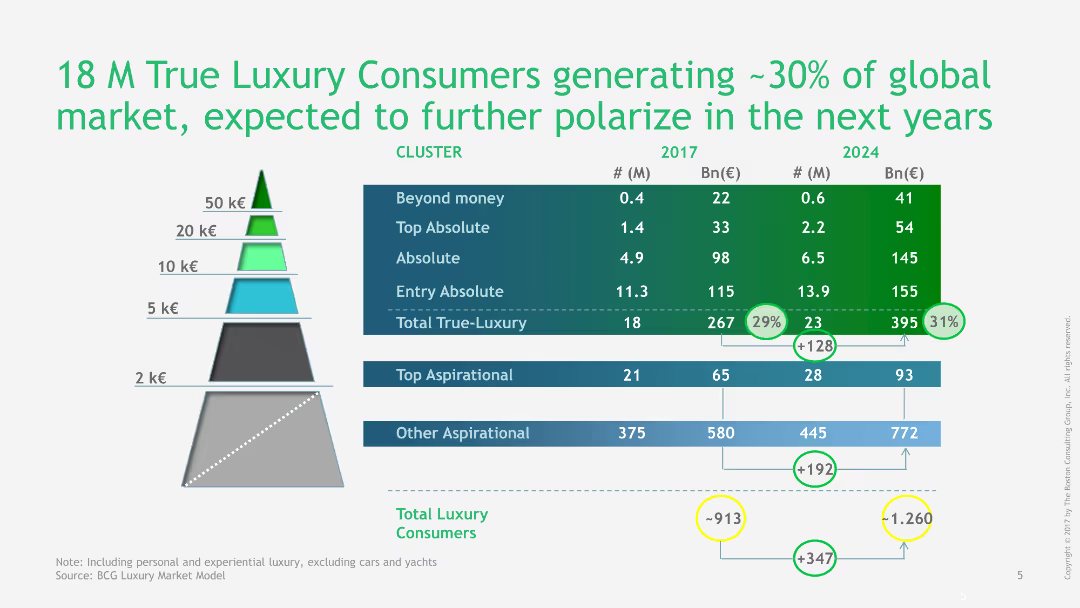
Pyramid chart showing the segmentation of true luxury consumers and their market contribution in 2017 and projected for 2024, with detailed figures.
Market Analysis and Trends
Consumer Goods
This slide provides a detailed segmentation of true luxury consumers, showing their contribution to the global market in 2017 and projections for 2024.
luxury, consumers, market segmentation, global market, projections, 2017, 2024, pyramid chart, detailed figures, market analysis
Table
BCG
Saved
The slide contains two visual elements: a column chart on the left showing global forward P/E ratios across different regions, and a line chart on the right showing relative equity valuations compared to the US.
Market Analysis and Trends
Financial Services
The slide compares global forward P/E ratios and relative equity valuations, showing trends and comparisons of various regions over time.
P/E ratios, global, equity valuations, US, regions, market analysis, trends
Multiple Chart
JP Morgan
Saved
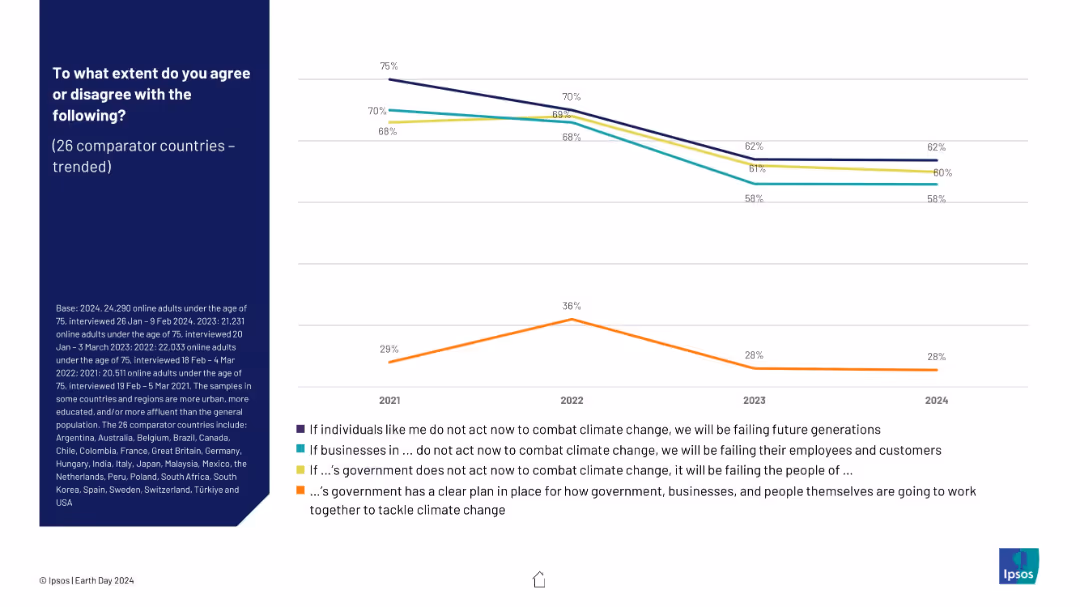
Line chart showing multi-year trend data (2021–2024) on agreement with climate change statements. Color-coded lines for each statement. Left panel explains survey context.
Market Analysis and Trends
Environmental Services & Sustainability
This slide shows four-year trends in global attitudes toward climate action by individuals, businesses, and governments. Notably, agreement has declined for most statements, especially the belief that individuals must act to protect future generations.
climate change, global trends, public opinion, individual responsibility, businesses, government plans, Ipsos survey, Earth Day
Mixed Chart
IPSOS
Saved
Three column charts comparing net new money/assets and net new deposits across different quarters and businesses.
Market Analysis and Trends
Financial Services
The slide compares wealth management and Swiss business flows, showing positive contributions from Credit Suisse quarter-to-date.
wealth, management, deposits, UBS, Credit Suisse
Multiple Chart
UBS
Saved
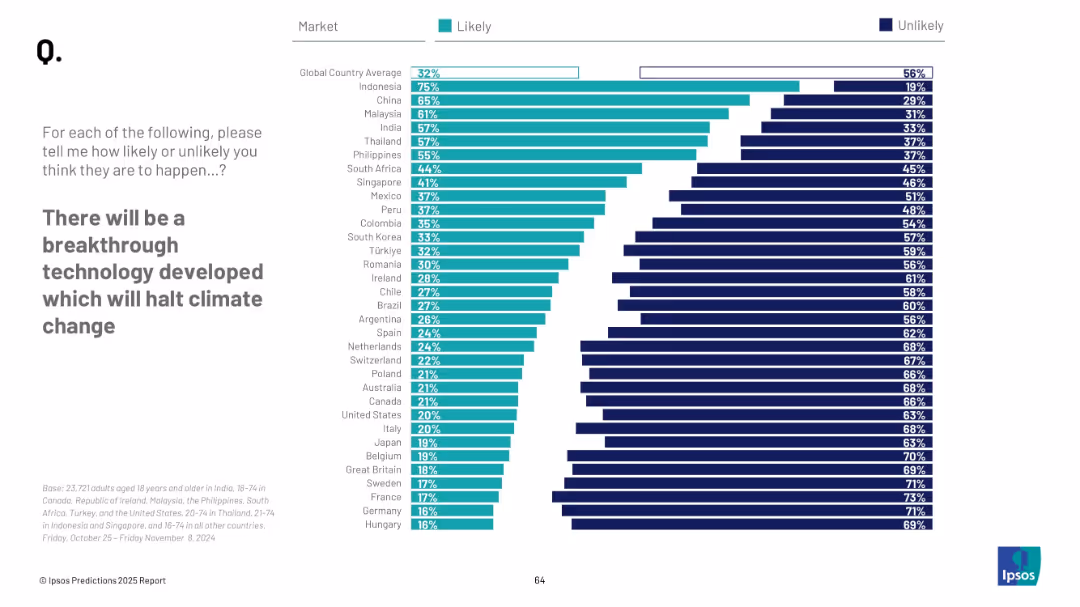
Bar chart with countries ranked by perceived likelihood of climate tech breakthrough; dark/light contrasting bars; global average highlighted at top.
Technology and Digital Transformation
Artificial Intelligence
This slide presents optimism levels across nations about the development of breakthrough technologies to stop climate change. Indonesia shows the highest hope, while Hungary and Germany are most skeptical. The global average is relatively low, showing overall caution.
climate tech, breakthrough, optimism, innovation, perception, Ipsos, AI, sustainability, country sentiment, global average
Mixed Chart
IPSOS
Saved
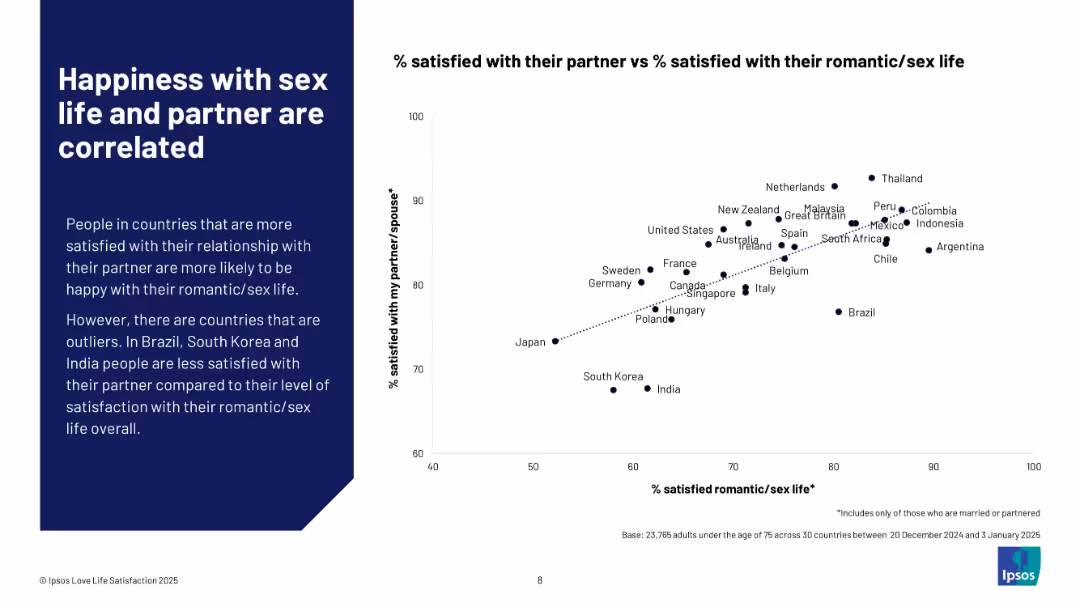
Left side explanatory text with a scatter plot on the right correlating satisfaction with partner vs romantic/sex life.
Human Resources and Talent Management
Professional Services
This slide visually correlates satisfaction with romantic/sex life and partner relationships. A scatter plot shows a strong positive trend across countries, with a few outliers like Brazil, South Korea, and India. It underscores the interconnectedness of relationship and sexual satisfaction.
correlation, partner satisfaction, romantic life, emotional well-being, Ipsos, scatter plot, relationship quality, international trends
Mixed Chart
IPSOS
Saved
This slide shows a title, two column charts displaying trial lengths for FCoA and FCC, and a pie chart depicting reserved judgments delivery time. It uses red and orange hues with clear labels and a note on trial length comparison.
Regulatory and Compliance
Government & Public Sector
It breaks down the trial lengths for matters heard in FCoA and FCC, the percentage of reserved judgments delivered within three months, and highlights the significant difference in trial lengths between the two courts.
FCoA, FCC, trial lengths, reserved judgments, case management, legal proceedings
Multiple Chart
PwC/Strategy&
Saved
Features a column chart for nonfarm payroll gains, a line chart for labor force participation, and a heatmap for key labor market indicators.
Market Analysis and Trends
Financial Services
The slide analyzes the slowing momentum in the labor market by examining payroll gains, labor force participation, and various labor market indicators.
labor market, payroll gains, labor force participation, market indicators, economic slowdown
Multiple Chart
JP Morgan
Saved
Features column chart and a checklist of key highlights. The charts depict the strategic asset growth in bank entities over several years, showing a trend of increasing asset percentages. The slide uses a clear, simple layout for the display of quantitative growth data.
Strategic Planning
Financial Services
This slide illustrates the strategic growth of assets within bank entities over time, highlighting the firm's objectives such as diversifying business and optimizing capital position. This slide is typically used in strategic planning sessions to discuss growth objectives and performance against benchmarks.
Asset Growth, Strategic Planning, Bank Entities, Performance, Capital Optimization
Mixed Chart
Goldman Sachs
Saved
Contains two pie charts, one showing the distribution of organization sizes and the other showing the sectors of the respondent organizations, with distinct colors for each category.
Market Analysis and Trends
Professional Services
Provides demographic data of the survey respondents, including organization size ranging from less than 50 employees to more than 500, and sectors such as financial services, manufacturing, and healthcare. The slide helps in understanding the diversity and background of the survey participants.
Survey, Demographics, Respondents, Organization size, Sectors
Multiple Chart
PwC/Strategy&
Saved
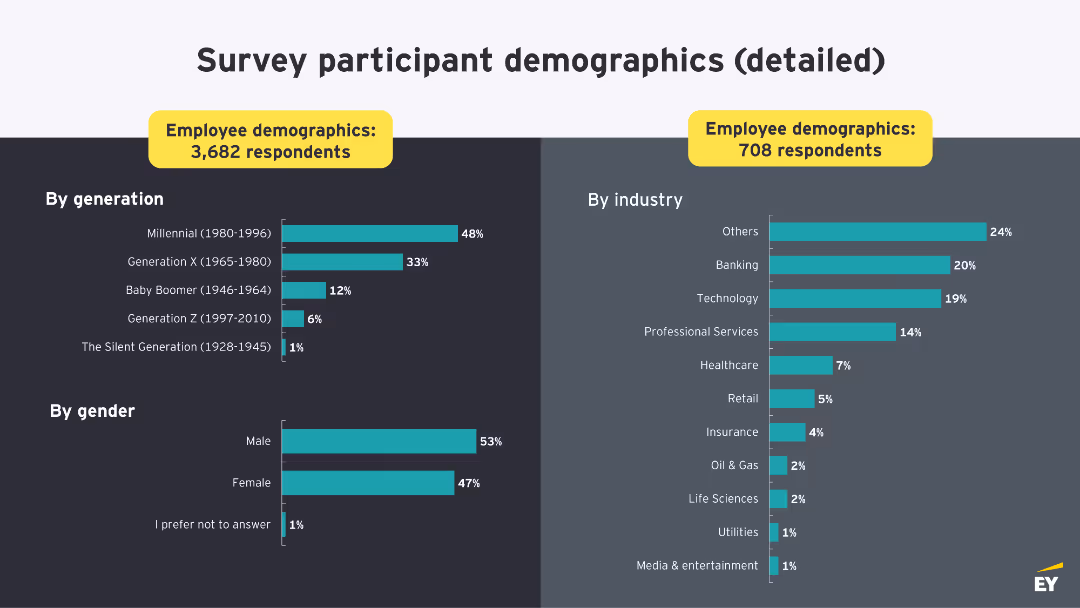
A column chart showing the demographics of survey respondents by generation and gender, and another column chart showing the respondents by industry.
Market Analysis and Trends
Professional Services
This slide provides detailed demographics of survey participants, including generation, gender, and industry, to give context to the survey data presented in the report.
Demographics, Survey, Respondents, Generation, Industry
Multiple Chart
EY
Saved
The slide includes two donut charts and text blocks. The left side displays the importance of flexibility in work location, and the right side shows flexibility in work hours.
Human Resources and Talent Management
Professional Services
Highlights the importance of flexibility in work location and hours for employees, based on survey results. Includes key statistics.
flexibility, work location, work hours, survey, employee preferences
Multiple Chart
EY
Saved
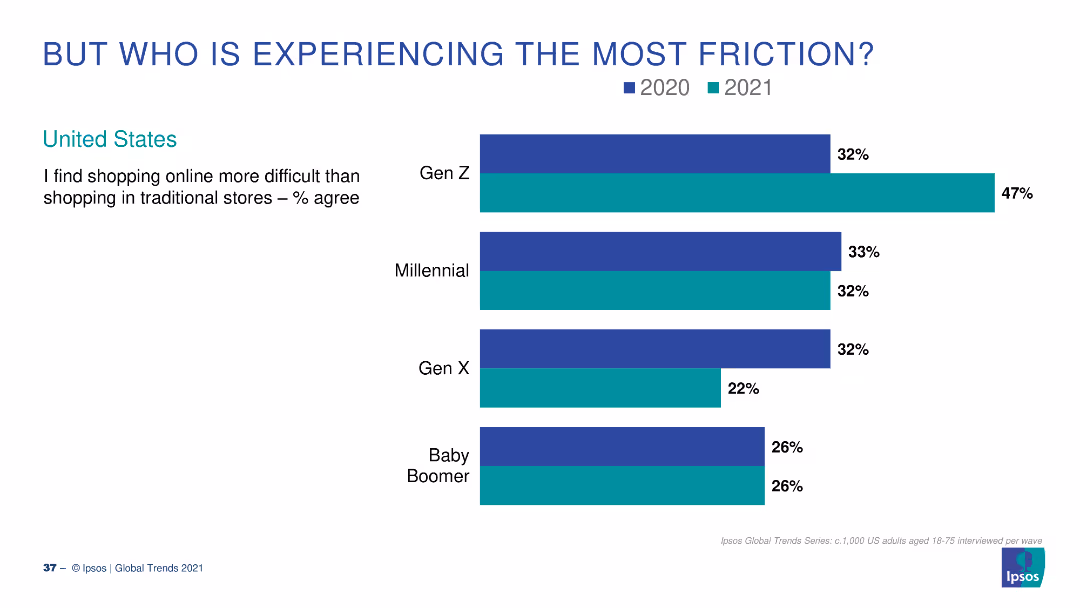
A column chart showing percentages of different generational groups in the US who find online shopping more difficult than traditional shopping for the years 2020 and 2021.
Market Analysis and Trends
Retail & E-commerce
This slide compares the percentage of various generational groups in the US who found online shopping more difficult in 2020 and 2021, focusing on Gen Z, Millennials, Gen X, and Baby Boomers.
generations, online shopping, friction, US, survey
Single Chart
IPSOS
Saved
Previous
Next
If nothing, comes up, please save your slides first
Create a FREE account to continue browsing
Receive Instant Access to 1,000+ slides from companies like McKinsey, Google, and Goldman Sachs
First Name
Last Name
Email
Password
I agree to all
Terms & Privacy Policy
Thank you! Your submission has been received!
Oops! Something went wrong while submitting the form.
Have an account?
Sign in
Column Chart
Heatmap
Chevron
Org Chart
Infographic
Callouts
Timeline
List
Graphic
Picture
Process Flow
Diagram
Paragraph
Map
Table
Framework
Subtitle
Takeaway Box
Icon
Other Chart
Radar Chart
Waterfall Chart
Mekko Chart
Pie Chart
Scatter Plot
Line Chart
Bar chart
Bullet points