My Account
My Slides
Search by Category
Templates
View All Templates
Download Template Slides
Leave Feedback
Login
Logout
Get Started
Browse all Slides
Browse all Slides
Create a FREE Account
Instant access to 1,000+ real slides from top companies like McKinsey, BCG, Goldman Sachs, Google and many more!
First Name
Last Name
Email
Password
I agree to all
Terms & Privacy Policy
Thank you! Your submission has been received!
Oops! Something went wrong while submitting the form.
Have an account?
Sign in
Saved Slides
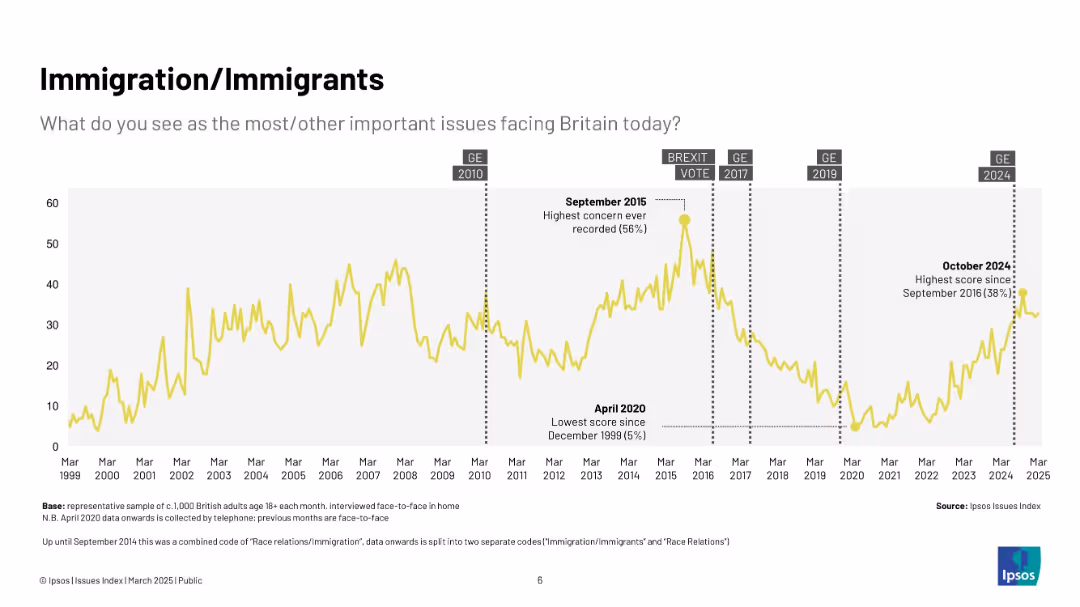
Yellow line chart (1999–2025) showing concern about immigration over time; highlights key dates like Brexit vote and 2015 peak.
Market Analysis and Trends
Government & Public Sector
Displays long-term trends in public concern around immigration in the UK, with major spikes during political debates and crises, notably Brexit and the 2015 refugee crisis.
immigration, Ipsos, Brexit, refugees, public concern, UK, politics, timeline
Single Chart
IPSOS
Saved
The slide contains pie charts showing the distribution of assets within the firm across different channels, using shades of blue and text annotations.
Operational Efficiency
Financial Services
Meant to illustrate how a firm manages and distributes its assets, highlighting the operational structure of asset management and wealth management.
Asset Distribution, Operational Structure, Asset Management, Wealth Management, Fee-Earning, Total Assets
Multiple Chart
Goldman Sachs
Saved
A UK map highlights different regions with associated GVA and employment figures in a legible format. Side text provides additional context and notes.
Market Analysis and Trends
Government & Public Sector
This slide details the regional economic impact of the Tempest programme, showcasing direct and indirect GVA and employment contributions across the UK.
regional impact, Tempest programme, GVA, employment, UK regions, economic contribution
Single Chart
PwC/Strategy&
Saved
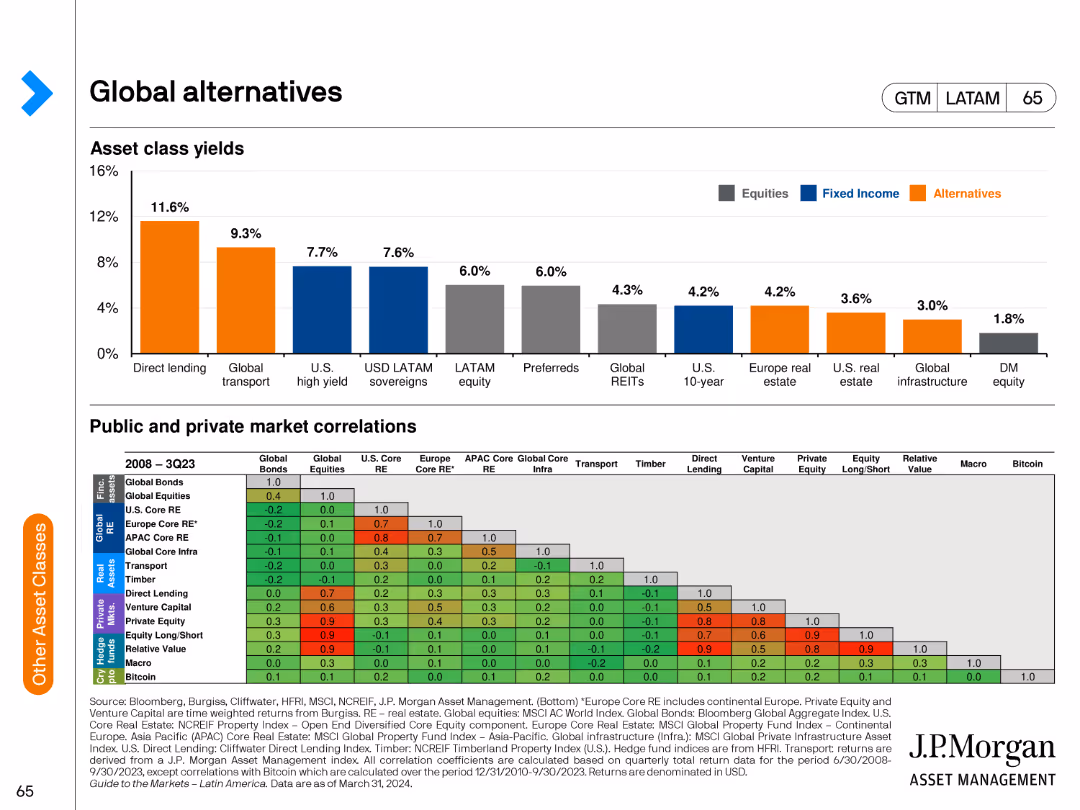
The slide features a column chart depicting asset class yields and a table showing public and private market correlations. It is moderately complex.
Market Analysis and Trends
Financial Services
The slide presents yields across various asset classes and correlations between public and private markets. It is used to analyze investment performance in global alternatives.
asset class yields, market correlations, equities, fixed income, alternatives, global investment, financial analysis, performance trends
Multiple Chart
JP Morgan
Saved
It uses line charts to depict CEO expectations on economic growth, with a key and explanatory notes.
Market Analysis and Trends
Professional Services
Illustrates CEO perspectives on global economic growth, with a focus on the changes in optimism and confidence over recent years.
CEO, Economic Growth, Survey, Trends
Single Chart
PwC/Strategy&
Saved
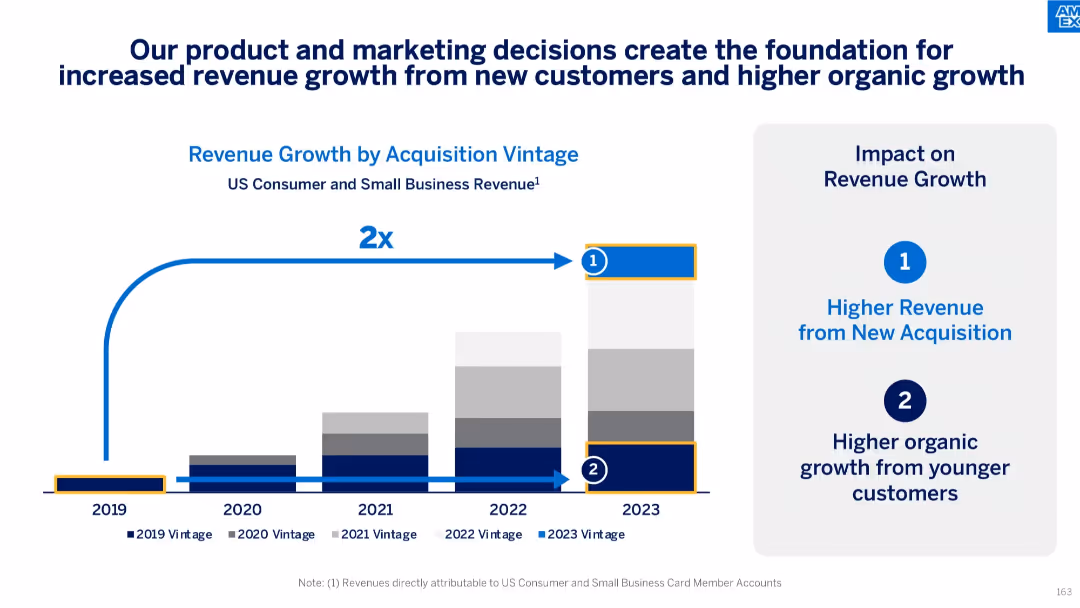
Stacked bar chart (2019–2023) with callouts for vintage revenue growth; two blue callout icons summarizing revenue sources
Strategic Planning
Financial Services
This slide outlines the doubling of revenue from 2019 to 2023, driven by strategic product and marketing efforts. It attributes growth to both new customer acquisitions and increased spending from younger customer cohorts, emphasizing sustainable organic growth.
revenue growth, customer acquisition, marketing impact, organic growth, vintage analysis, small business, consumer revenue
Mixed Chart
McKinsey
Saved
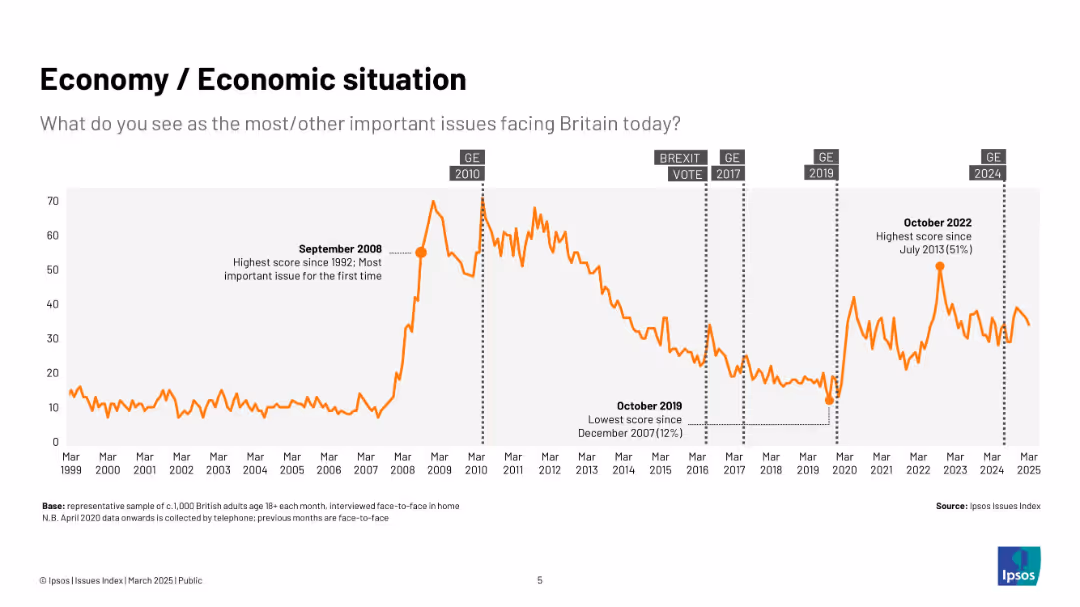
Single orange line graph (1999–2025) with annotations for key peaks and troughs (e.g. 2008 crash, 2022 peak); major events labeled.
Market Analysis and Trends
Government & Public Sector
Focuses on the public's perception of the economy as a top issue, highlighting spikes during major economic or political events. Shows historical high (2008) and recent peak (2022).
economy, Ipsos, public concern, financial crisis, political events, UK, trends
Single Chart
IPSOS
Saved
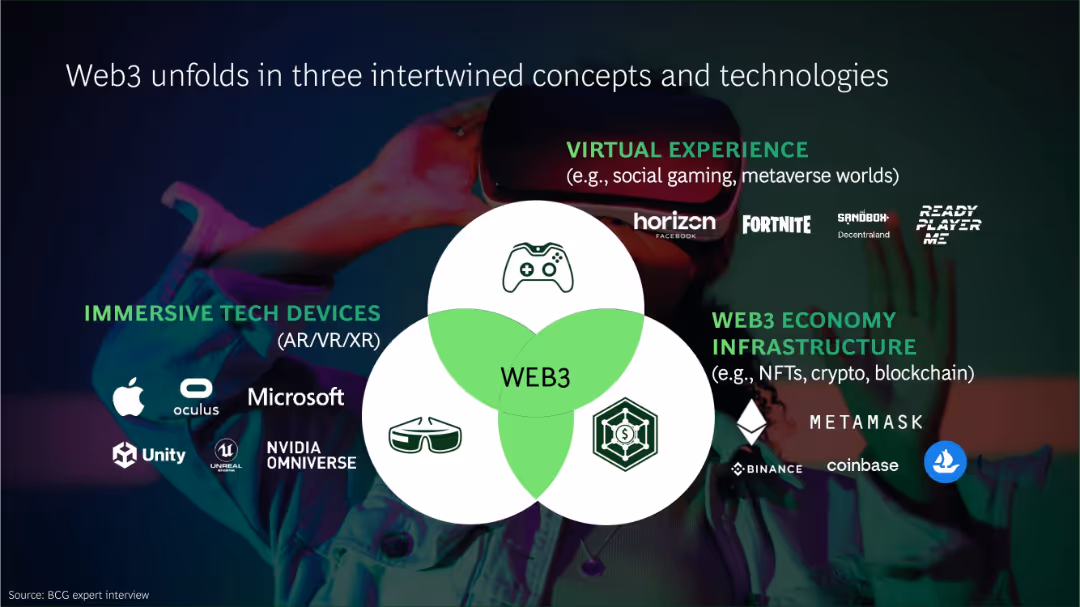
Venn diagram with three labeled segments surrounded by logos and icons of relevant platforms and companies
Technology and Digital Transformation
Technology & Software
Web3 is described as a convergence of immersive tech devices (AR/VR/XR), virtual experiences (e.g., gaming), and blockchain infrastructure. Major platforms and players like Meta, Microsoft, and Binance are highlighted. The slide emphasizes interconnected tech driving next-gen digital experiences.
Web3, blockchain, immersive tech, AR/VR, metaverse, virtual experience, NFTs, crypto
Framework
BCG
Saved
World map with highlighted countries and text boxes detailing Ipsos' strengths and global presence.
Competitive Landscape
Professional Services
Showcases Ipsos' competitive advantages, including global market leadership, extensive public sector research, and multidisciplinary teams. Highlights geographic and institutional reach.
Competitive Advantage, Global Presence, Research, Ipsos
Graphic
IPSOS
Saved
The slide displays a table listing different CO2-based products, their compounds, and the current status of deployment, categorized into commercial, lab-scale, and demonstration stages. It uses color coding for each category.
Product and Service Analysis
Energy & Utilities
The slide provides a detailed overview of various CO2-based chemical products, their current development stages, and potential applications, highlighting the maturity levels of different pathways.
CO2-based products, chemical compounds, deployment status, maturity stages
Table
Kearney
Saved
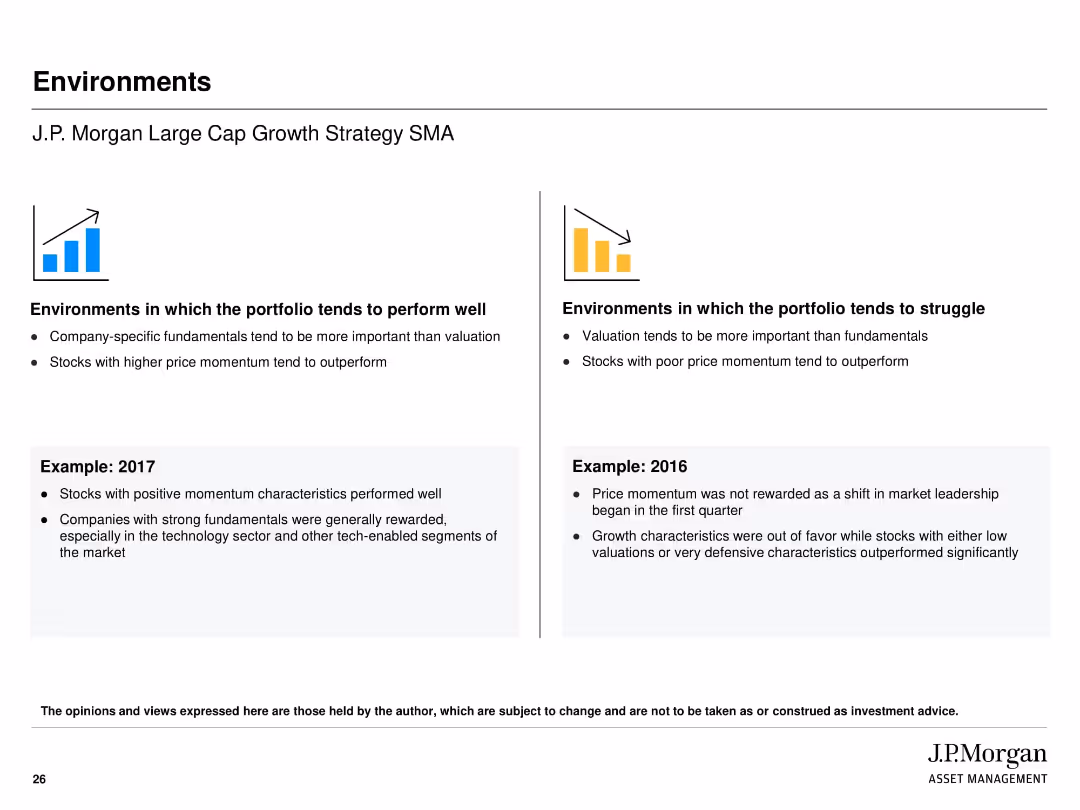
Two-column comparison layout showing "perform well" vs "struggle" environments; includes iconography and historical examples
Strategic Planning
Financial Services
Outlines the types of market environments where the strategy typically performs well or struggles. Highlights company-specific fundamentals and momentum as performance drivers. Includes real-world examples from 2016 and 2017 to illustrate favorable and unfavorable market conditions.
performance drivers, momentum, valuation, market environment, strategy, J.P. Morgan, growth
Header Horizontal
JP Morgan
Saved
Contains two line charts. The left chart depicts policy rate trends of the Fed, ECB, and BoJ from January 2020 to April 2024. The right chart shows the return-on-equity of US, European, and Japanese banks from 2010 to 2024.
Market Analysis and Trends
Financial Services
Discusses how global economic resilience and higher inflation expectations affect central bank policies, influencing the profitability of banks, particularly in the US, Europe, and Japan.
Banks, Fed, ECB, BoJ, Return-on-Equity, Policy Rates, Inflation, Market Analysis
Multiple Chart
Morgan Stanley
Saved
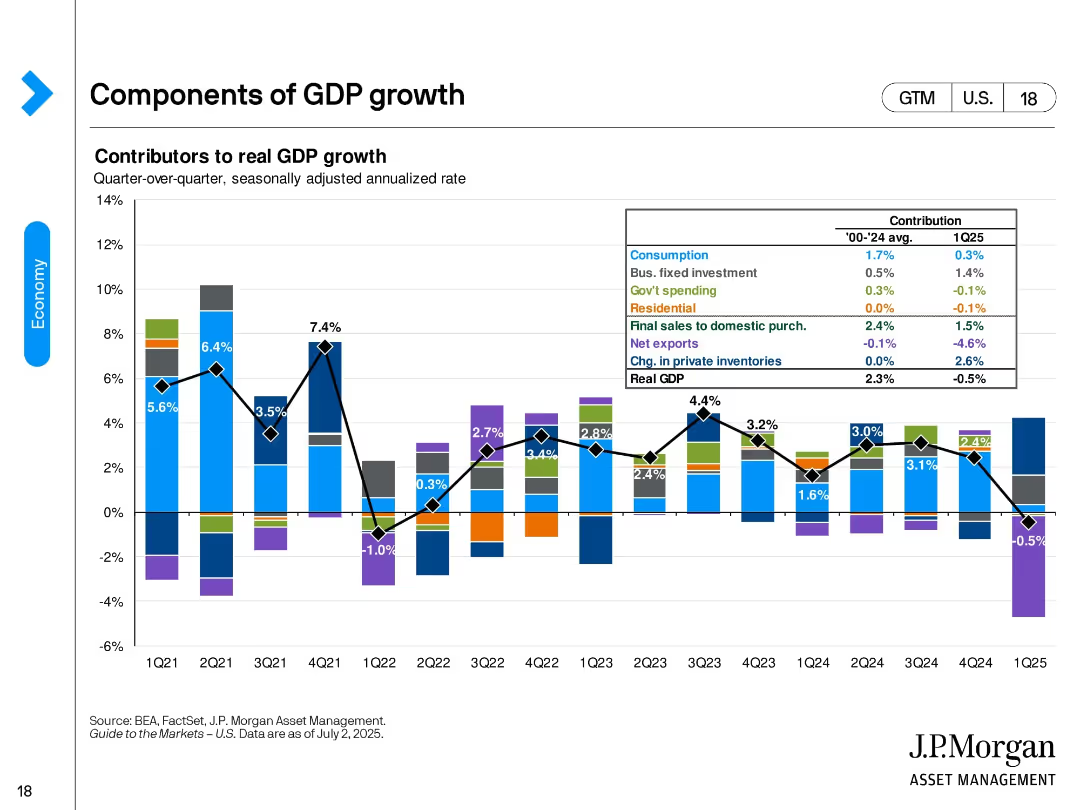
Bar chart with overlaid line chart. Each bar segment is color-coded to show contribution by GDP component per quarter, from Q1 2021 to Q1 2025. A box summary in top-right shows average contributions and Q1 2025 values.
Market Analysis and Trends
Financial Services
This slide dissects the components contributing to quarterly GDP growth, highlighting changes in consumption, investment, net exports, and inventories. It shows a -0.5% decline in real GDP in Q1 2025, largely driven by a -4.6% drag from net exports.
GDP growth, investment, net exports, consumption, inventories, quarterly trends, Q1 2025, economic contribution, real GDP
Single Chart
JP Morgan
Saved
This slide presents three data points with icons: mobile app logins, users of a payment service, and percentage of check deposits via a digital platform. Each data point is accompanied by an increase percentage and compared to previous years. The slide layout is balanced, with clear delineation between each metric and the usage statistics shown in large bold numbers for emphasis.
Operational Efficiency
Financial Services
It highlights key performance metrics in digital services offered by Chase, such as mobile banking logins, peer-to-peer payments, and digital check deposits. The slide is intended to convey the effectiveness of digital investments and customer adoption rates for digital banking services.
mobile banking, digital platforms, user growth, customer adoption
Table
JP Morgan
Saved
Features detailed tables and column charts comparing financial advisory, underwriting, and lending data. Layout is dense, utilizing a blue, gray, and white color palette.
Market Analysis and Trends
Financial Services
The slide details investment banking financial results with YoY comparisons and highlights, used for analyzing market trends and banking performance.
Investment, Banking, Financial, Results, Analysis, Market, Trends, Performance, Comparison, Advisory
Mixed Chart
Goldman Sachs
Saved
The slide presents three strategies using icons and short text blocks: "Find out what workers want", "Build great managers", and "Invest in making work better". Each section is separated by vertical lines and uses simple icons to visually represent the strategy, like speech bubbles, a manager, and technology tools.
Human Resources and Talent Management
Professional Services
This slide provides strategies for companies to retain and engage deskless workers by understanding their needs, building managerial skills, and improving workplace technology and flexibility. Ideal for HR strategy sessions focusing on enhancing worker satisfaction and retention in industries with high deskless worker populations.
retention, strategy, deskless workers, management, workplace improvement, HR policies
Pillar
BCG
Saved
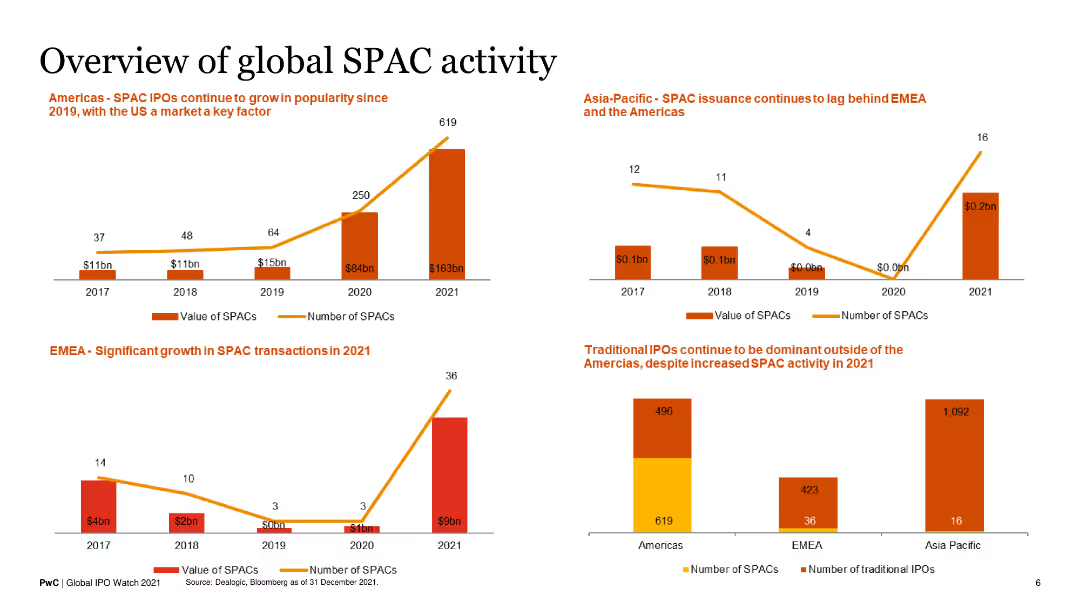
This slide contains four column charts, each showing the number and value of SPACs and traditional IPOs in different regions (Americas, EMEA, Asia-Pacific) from 2017 to 2021.
Market Analysis and Trends
Financial Services
The slide provides a comparative overview of SPAC and IPO activities across various regions, highlighting significant growth in the Americas.
SPACs, IPOs, financial markets, regional analysis, growth trends
Multiple Chart
PwC/Strategy&
Saved
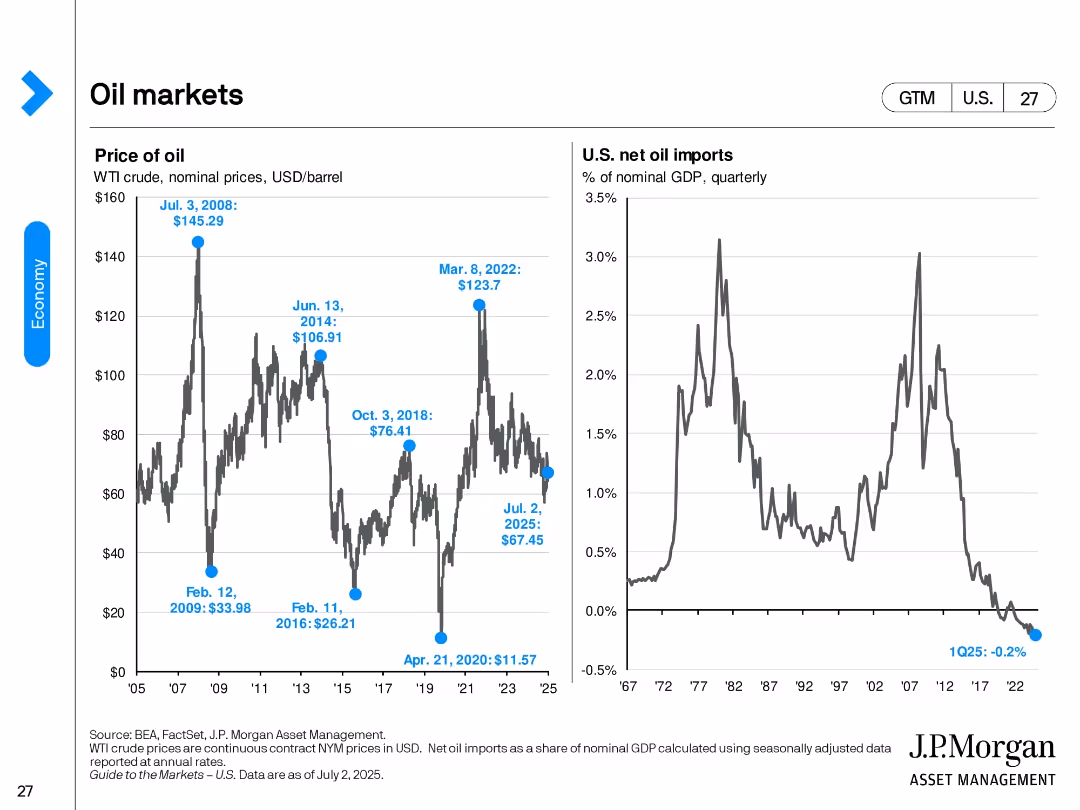
Two side-by-side line charts showing WTI oil price history and U.S. net oil imports as % of GDP; key data points annotated.
Market Analysis and Trends
Energy & Utilities
This slide tracks historical WTI crude oil prices and U.S. net oil imports as a share of GDP. It shows key peaks and troughs, with recent prices and import levels, highlighting the U.S.'s shift to net oil exporter status.
oil prices, WTI, GDP, imports, energy, trade balance, commodity, trend analysis, crude oil
Multiple Chart
JP Morgan
Saved
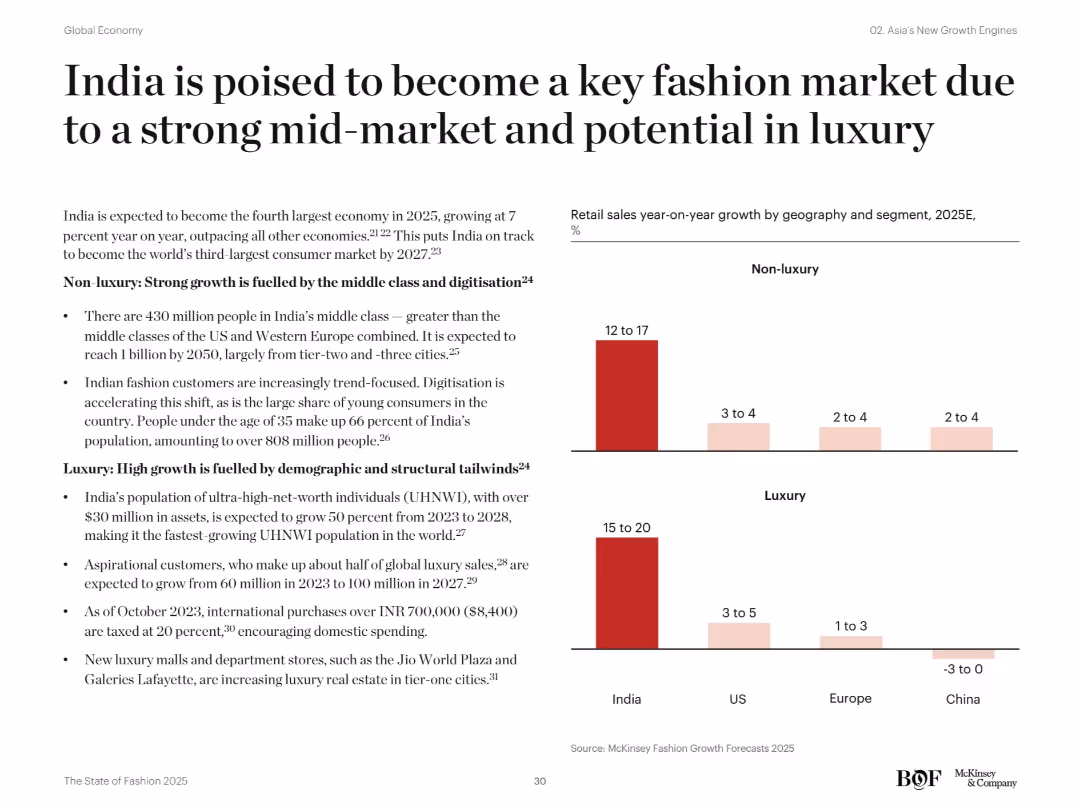
Side-by-side bar charts show projected retail growth in non-luxury and luxury segments by geography for 2025. Accompanying text provides demographic drivers.
Market Analysis and Trends
Consumer Goods
India is forecast to be a leading fashion market by 2025, fueled by a massive middle class and rapid digital adoption. Luxury growth is driven by UHNWIs and aspirational consumers. India is set to surpass Western markets in growth across both segments.
India, fashion market, middle class, UHNWIs, non-luxury, luxury, growth forecast, retail, digitization, demographics
Mixed Chart
McKinsey
Saved
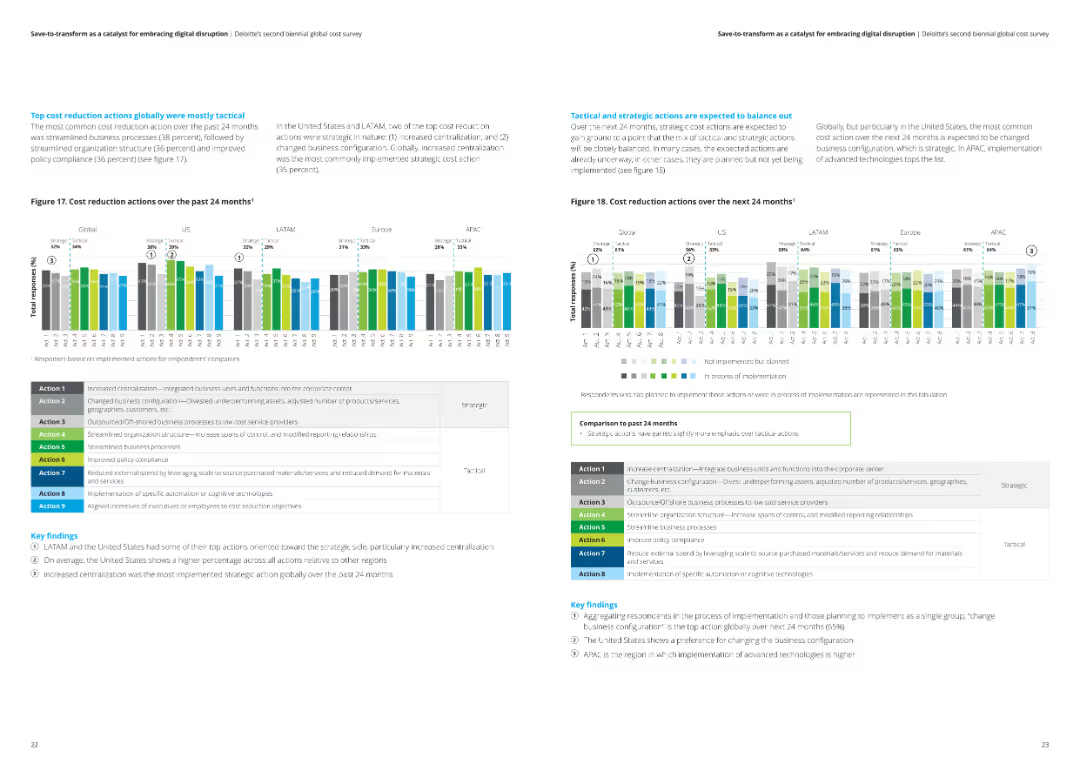
The slide features two column charts showing cost reduction actions over the past and next 24 months across different regions. Key findings are included in text boxes.
Operational Efficiency
Financial Services
The slide details tactical and strategic cost reduction actions taken in various regions over the past 24 months and projected for the next 24 months.
Cost reduction, tactical actions, strategic actions, analysis, financial services
Multiple Chart
Deloitte
Saved
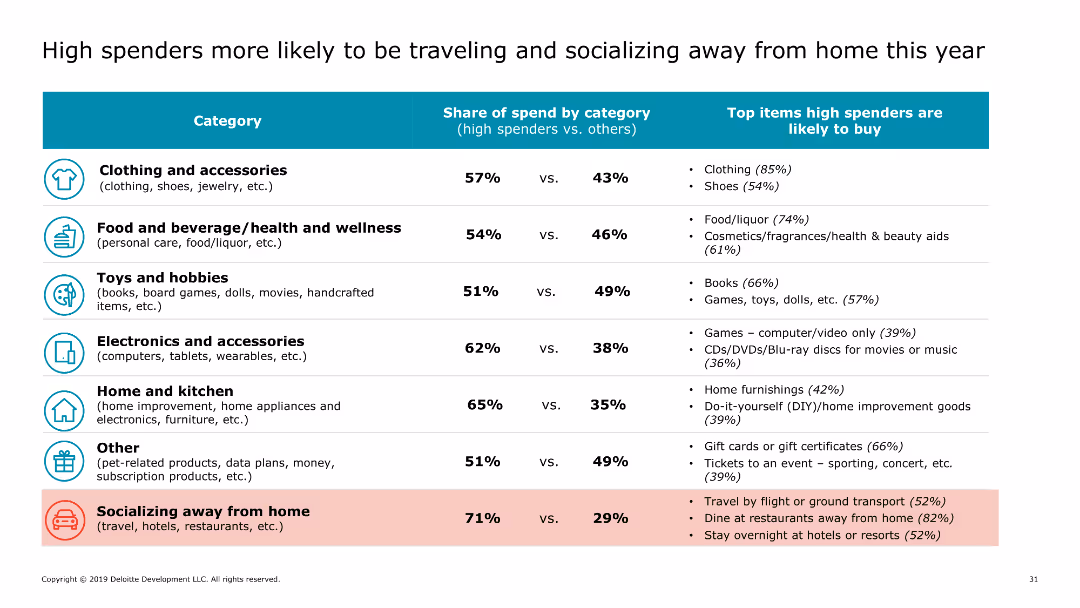
The slide features a table comparing the share of spend by category between high spenders and others. Categories include clothing and accessories, food and beverage, toys and hobbies, electronics, and socializing away from home.
Market Analysis and Trends
Retail & E-commerce
This slide provides a detailed breakdown of spending categories for high spenders versus other consumers, showing that high spenders allocate more budget to travel and social activities during the holiday season.
high spenders, holiday spending, spending categories, consumer behavior, travel spending
Table
Deloitte
Saved
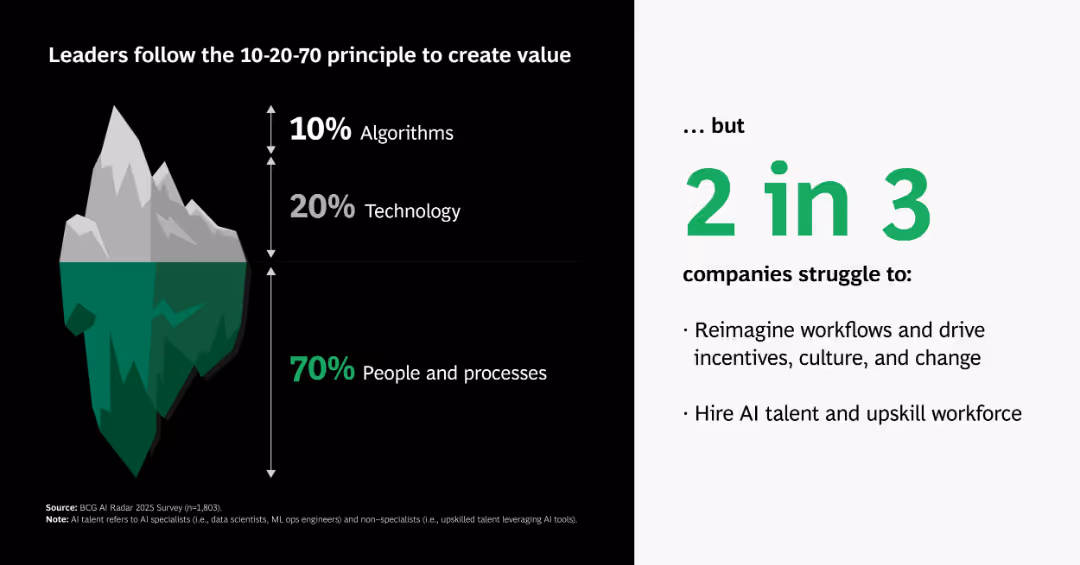
Iceberg visual metaphor breaking down AI value sources into algorithms, tech, and people/processes; supporting text on right.
Organizational Structure and Change
Artificial Intelligence
Explains that true AI value comes 70% from people and processes, 20% from technology, and only 10% from algorithms—contrasting perception with operational reality.
AI iceberg, 10-20-70, people, processes, tech, algorithms, value creation, organizational change
Boxed
BCG
Saved
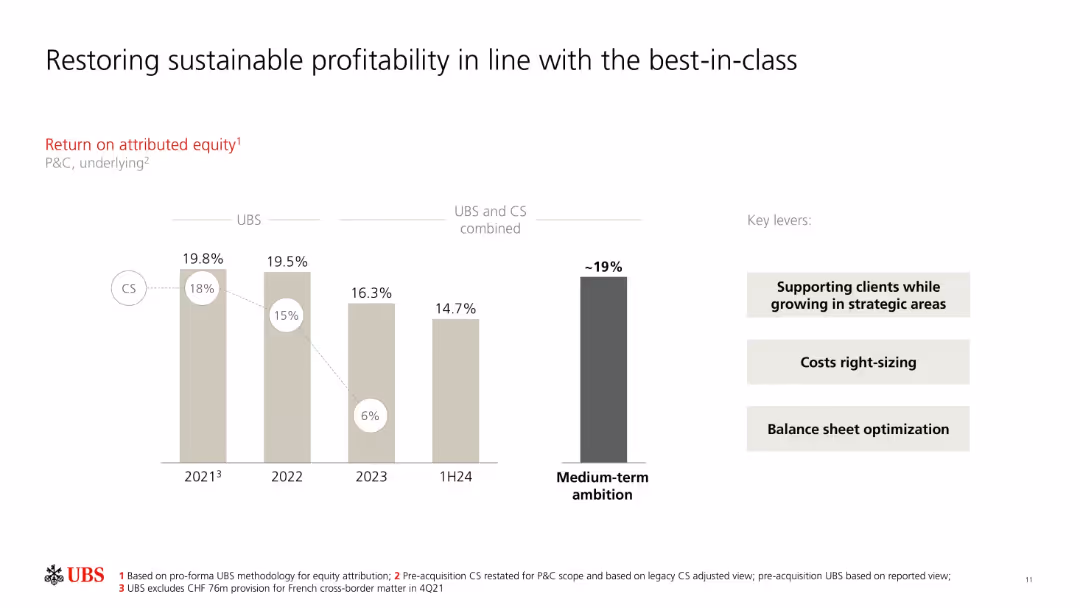
Vertical bar chart with profit margins from 2021–1H24 and UBS’s future goal; side boxes for levers.
Financial Performance
Financial Services
The slide traces UBS and CS's return on attributed equity over time, culminating in a 14.7% combined performance for 1H24, with a medium-term target of ~19%. It highlights key levers including strategic growth, cost management, and balance sheet optimization.
return on equity, UBS, CS, profitability, targets, performance, strategy, optimization, medium-term goal
Single Chart
UBS
Saved
Features a pie chart showing the 2020 market share of brake and fuel lines, with TI Fluid Systems highlighted as the market leader. Accompanying text provides additional context on market positioning and relationships with OEMs.
Market Analysis and Trends
Industrial & Manufacturing
This slide analyzes the market share for brake and fuel lines, showcasing TI Fluid Systems' leading position and their sustained dominance over a decade, attributed to strong global OEM relationships.
market share, OEM, automotive, 2020, pie chart
Mixed Chart
Deutsche Bank
Saved
This slide uses a timeline format with a multi-colored wave graph showing the progression of COVID-19 through phases labeled "Flatten," "Fight," and "Future." It describes anticipated actions in each phase, like social distancing and vaccine development, aimed at controlling the pandemic's impact.
Strategic Planning
Healthcare & Pharmaceuticals
Analyzes the expected phases of COVID-19 recovery focusing on different strategic responses from government and healthcare systems to mitigate the pandemic's impact. Highlights the importance of coordinated responses in limiting cases and supporting economic recovery.
COVID-19, recovery, healthcare, government, pandemic, phases, vaccine
Linear Flow
BCG
Saved
Previous
Next
If nothing, comes up, please save your slides first
Create a FREE account to continue browsing
Receive Instant Access to 1,000+ slides from companies like McKinsey, Google, and Goldman Sachs
First Name
Last Name
Email
Password
I agree to all
Terms & Privacy Policy
Thank you! Your submission has been received!
Oops! Something went wrong while submitting the form.
Have an account?
Sign in
Column Chart
Heatmap
Chevron
Org Chart
Infographic
Callouts
Timeline
List
Graphic
Picture
Process Flow
Diagram
Paragraph
Map
Table
Framework
Subtitle
Takeaway Box
Icon
Other Chart
Radar Chart
Waterfall Chart
Mekko Chart
Pie Chart
Scatter Plot
Line Chart
Bar chart
Bullet points