My Account
My Slides
Search by Category
Templates
View All Templates
Download Template Slides
Leave Feedback
Login
Logout
Get Started
Browse all Slides
Browse all Slides
Create a FREE Account
Instant access to 1,000+ real slides from top companies like McKinsey, BCG, Goldman Sachs, Google and many more!
First Name
Last Name
Email
Password
I agree to all
Terms & Privacy Policy
Thank you! Your submission has been received!
Oops! Something went wrong while submitting the form.
Have an account?
Sign in
Saved Slides
The slide features a column chart with measures like returns charges, account blocks, and monetary incentives that would deter consumers from making returns.
Risk Assessment and Management
Retail & E-commerce
Details measures that could reduce the frequency of online returns, based on survey responses, including financial and policy-based deterrents like returns charges and account blocks.
Returns charges, Account block, Monetary incentive, Survey measures, Deterrents
Mixed Chart
Roland Berger
Saved
A column chart shows the trend of rail ridership over the years, highlighting specific years with significant changes, providing a clear visual of ridership trends.
Industry Overview
Transportation & Logistics
Focuses on the significant decline in rail ridership over several years, offering insights into potential causes and implications for the transportation industry.
rail ridership, decline, transportation industry, trend analysis
Single Chart
BCG
Saved
This slide showcases bar graphs comparing manufacturing PMI before, during, and after COVID-19, with a color gradient for performance levels.
Market Analysis and Trends
Industrial & Manufacturing
Analyzes the manufacturing PMI to illustrate the economic impact of COVID-19 on different countries and recovery momentum.
PMI, manufacturing, economic impact, COVID-19, recovery
Multiple Chart
BCG
Saved
This slide has pie charts showing radio usage at home versus away from home, along with bar graphs indicating locations of out-of-home listening.
Market Analysis and Trends
Media & Entertainment
The slide depicts consumer radio usage patterns, highlighting the significant amount of radio listening that occurs away from home, especially in cars, supported by relevant statistics.
radio usage, out-of-home, pie charts, bar graphs, listening locations
Multiple Chart
Nielsen
Saved
Clean, structured layout with donut charts and circular percentage visuals; dark blue background.
Technology and Digital Transformation
Artificial Intelligence
Addresses CEO concerns around GenAI deployment such as ethics, security, and employee resistance. Highlights leadership confidence in handling GenAI strategy and ethical navigation.
GenAI, ethics, compliance, integration, leadership, resistance, KPMG
Single Chart
KPMG
Saved
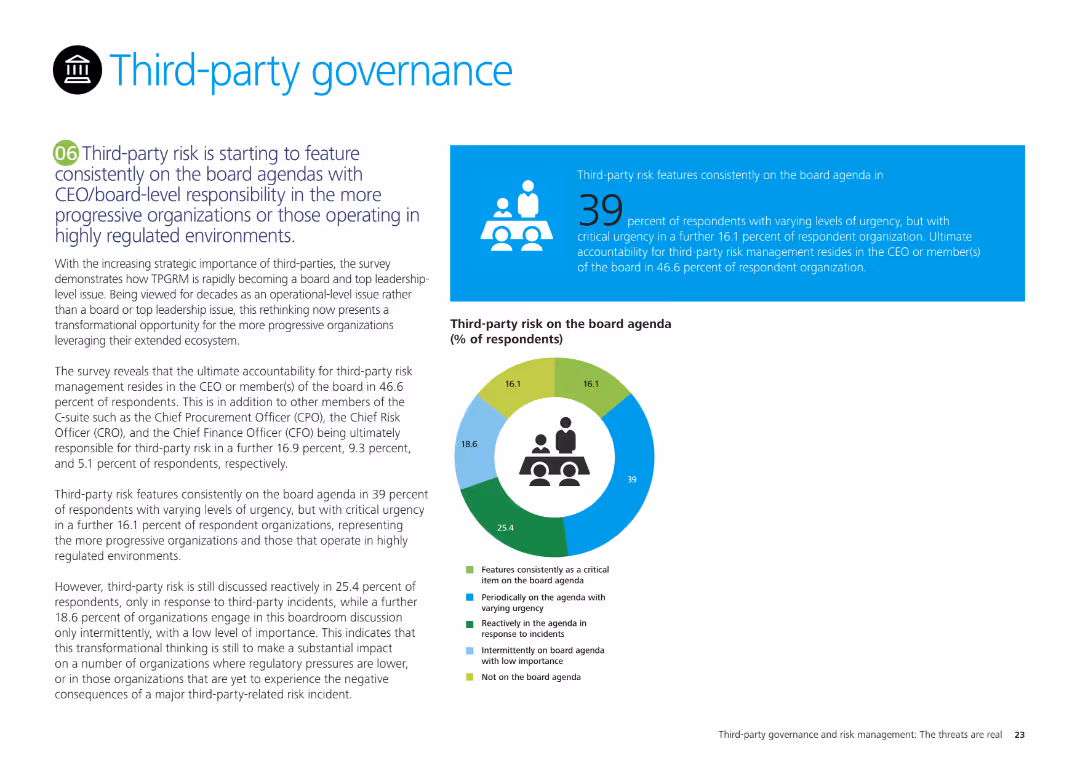
The slide features a pie chart showing the percentage of third-party risk on board agendas and a text box discussing third-party governance trends.
Regulatory and Compliance
Professional Services
It highlights the growing importance of third-party risk in board agendas, detailing survey results on the frequency and urgency of third-party risk discussions at the board level.
Third-party governance, board agendas, risk management, survey results, compliance
Mixed Chart
Deloitte
Saved
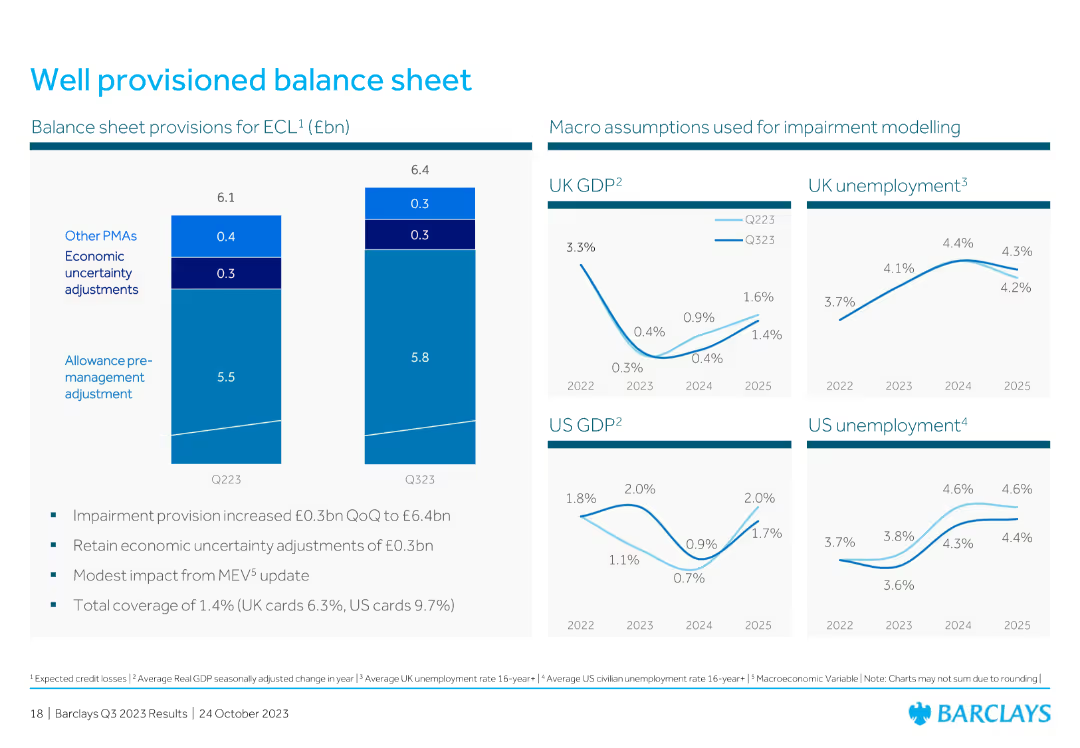
This slide features two vertical column charts and four line charts, all displaying financial data. The layout is clean and organized, with a focus on data visualization.
Financial Performance
Financial Services
The slide provides an overview of the balance sheet provisions for ECL and macro assumptions used for impairment modeling. Key metrics include UK and US GDP, and unemployment rates.
balance sheet, GDP, unemployment, provisions, financial data, impairment, macro assumptions, charts, modeling
Multiple Chart
Barclays
Saved
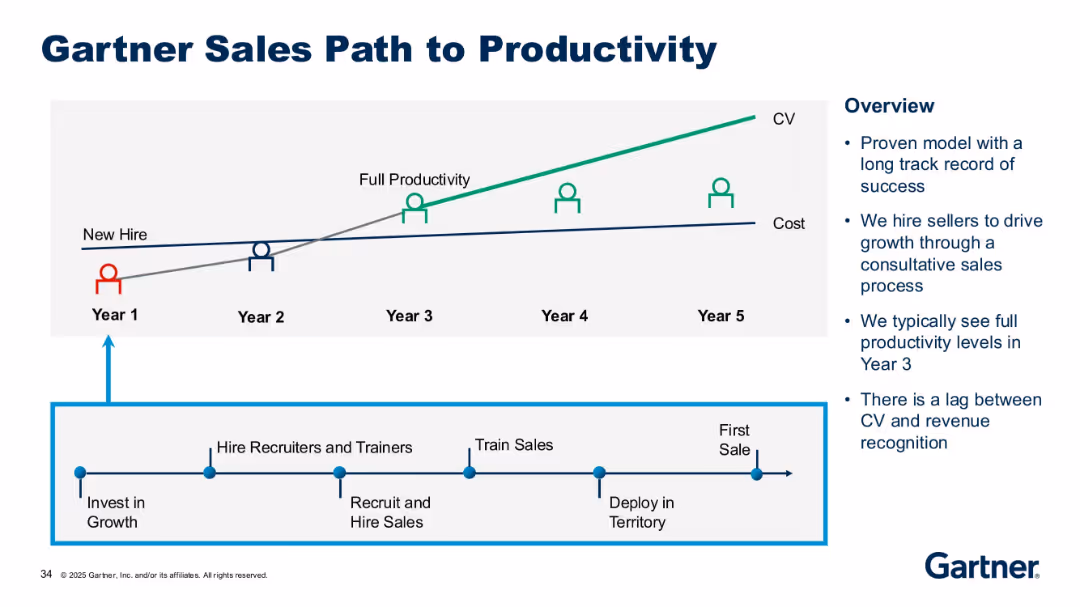
Diagram with timeline, icons of people, and dual line graph (CV vs. Cost). Sidebar with key points.
Operational Efficiency
Professional Services
This slide outlines the multi-year path from new hire to full productivity, typically achieved in Year 3. It includes stages like recruiting, training, and deployment, emphasizing the lag between CV generation and revenue recognition.
sales productivity, new hire, cost, CV, sales model, training, timeline, growth strategy, revenue lag
Mixed Chart
Gartner
Saved
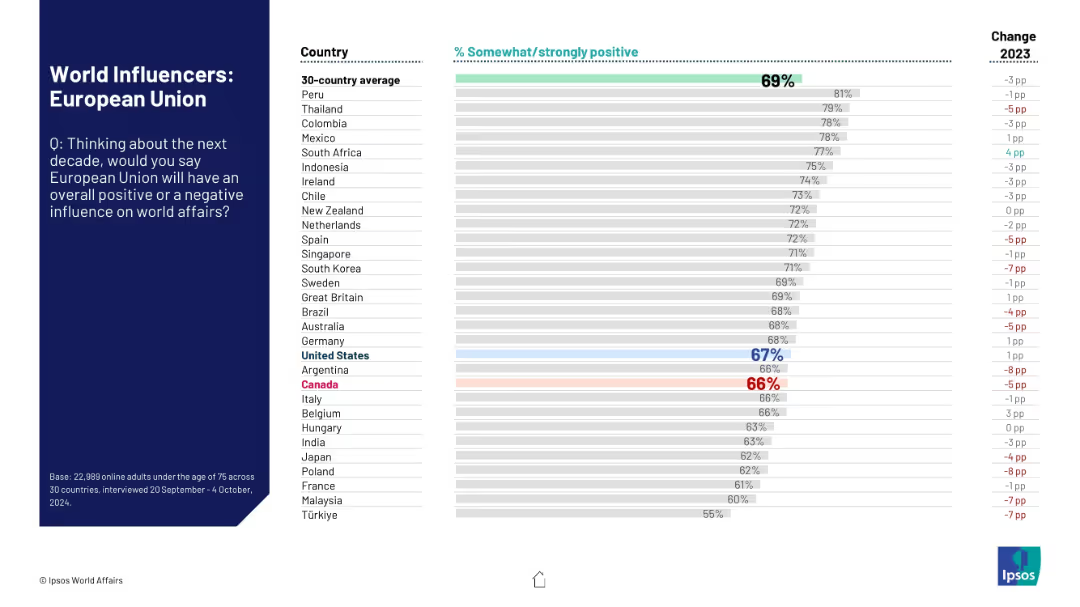
Bar chart of 30 countries' public opinion on whether the EU will have a positive influence in world affairs over the next decade.
Strategic Planning
Government & Public Sector
This slide ranks global views on the European Union’s projected influence in world affairs. It shows overall positive sentiment and highlights changes in perception from 2023, with the EU placed alongside national actors.
European Union, global affairs, influence ranking, international relations, public sentiment, Ipsos data, geopolitical perception
Mixed Chart
IPSOS
Saved
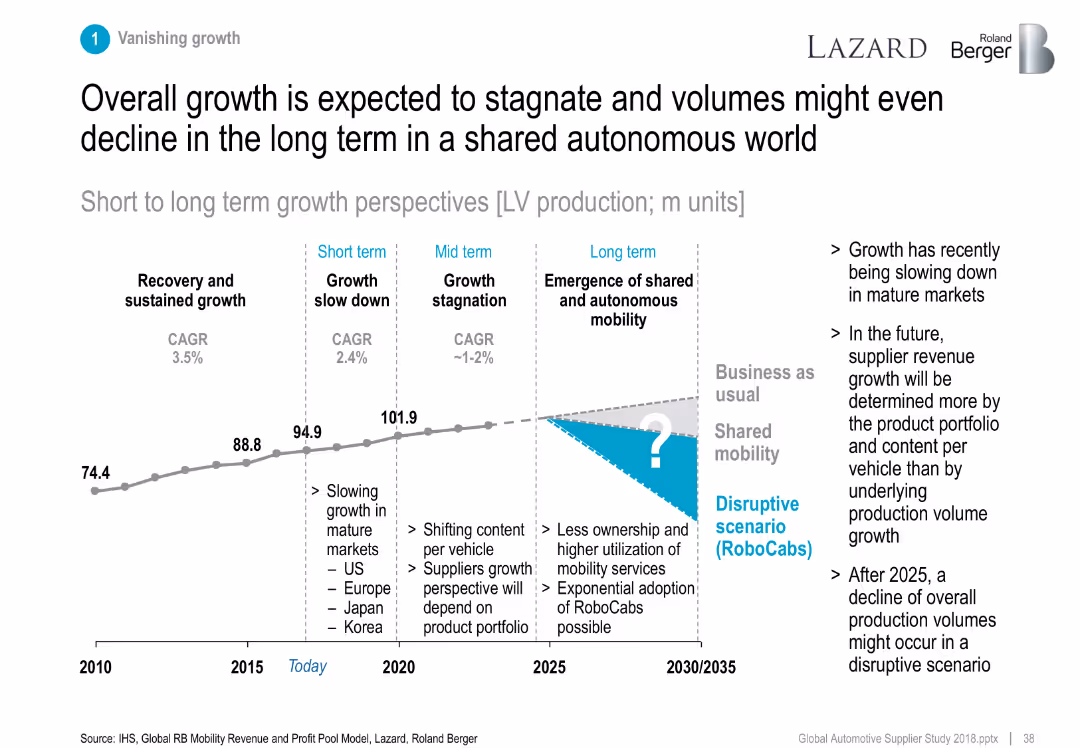
Line graph showing LV production growth phases from 2010 to 2035.
Strategic Planning
Industrial & Manufacturing
Projects light vehicle production growth phases, noting a shift to shared mobility and potential volume decline in the long term (post-2025).
growth outlook, shared mobility, RoboCabs, LV production, forecast
Mixed Chart
Roland Berger
Saved
The slide comprises three charts: a column chart for real GDP, and two line charts for consumption and investment, and international trade data.
Market Analysis and Trends
Financial Services
This slide reviews Chile's economic situation, focusing on real GDP changes, consumption and investment trends, and international trade as of 4Q23.
Chile, economic snapshot, GDP, consumption, investment, trade
Multiple Chart
JP Morgan
Saved
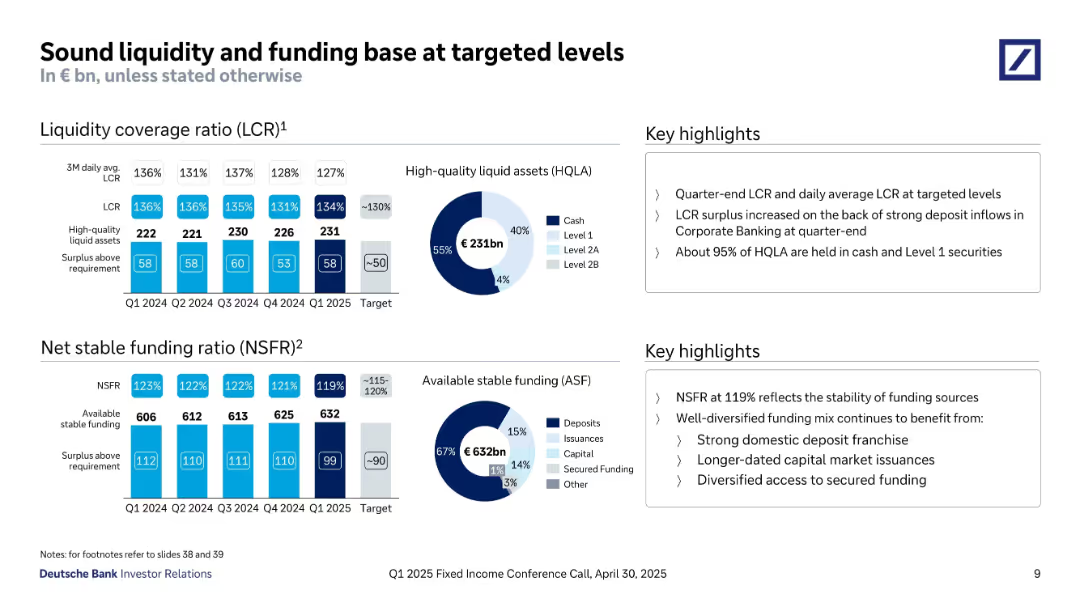
Two major sections with bar charts (LCR & NSFR), donut charts (liquidity and funding composition), and textual highlights on the right.
Risk Assessment and Management
Financial Services
The slide outlines Deutsche Bank’s liquidity and funding ratios in Q1 2025. LCR stands at 127%, NSFR at 119%, both within target ranges. It emphasizes stable high-quality liquid assets and strong deposit-based funding structure.
Liquidity, LCR, NSFR, Funding, Stability, HQLA, Surplus, Risk Management, Targeted Levels, Q1 2025
Multiple Chart
Deutsche Bank
Saved
The slide has a dark theme and presents two main sections, one with financial economics statistics and another with a layered area chart depicting revenue paths.
Investment Analysis
Financial Services
This slide informs about the economic viability of point-of-sale lending, with emphasis on on-balance sheet growth, merchant discount rates, and projected revenues.
economics, on-balance sheet, merchant lending, discount rates, APR, credit losses, revenue path, projections
Mixed Chart
Goldman Sachs
Saved
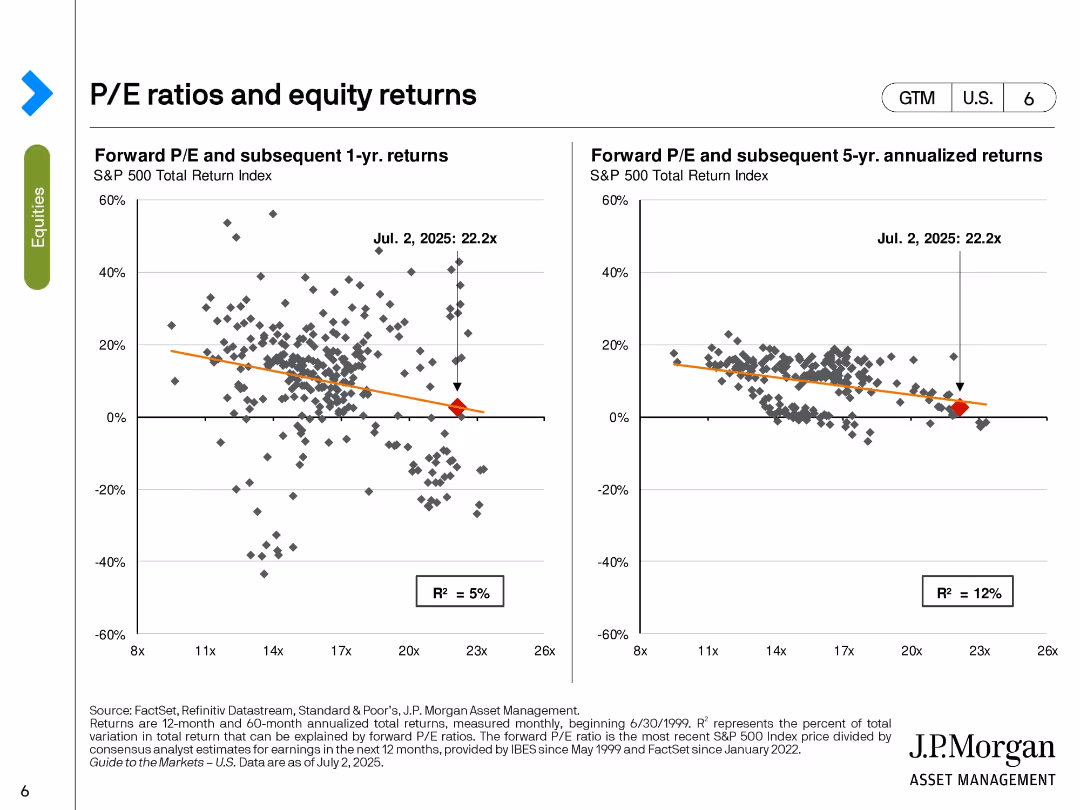
Two scatter plots with trendlines; left shows 1-year returns, right shows 5-year annualized returns, based on forward P/E ratio.
Investment Analysis
Financial Services
This slide analyzes the relationship between forward P/E ratios and subsequent equity returns. It demonstrates weak correlations, with R² values of 5% (1-year) and 12% (5-year), suggesting limited predictive power of P/E for short- and mid-term returns. Current P/E is marked at 22.2x.
P/E ratio, returns, scatter plot, S&P 500, equity analysis, forward valuation, performance forecasting, R-squared, investment strategy
Multiple Chart
JP Morgan
Saved
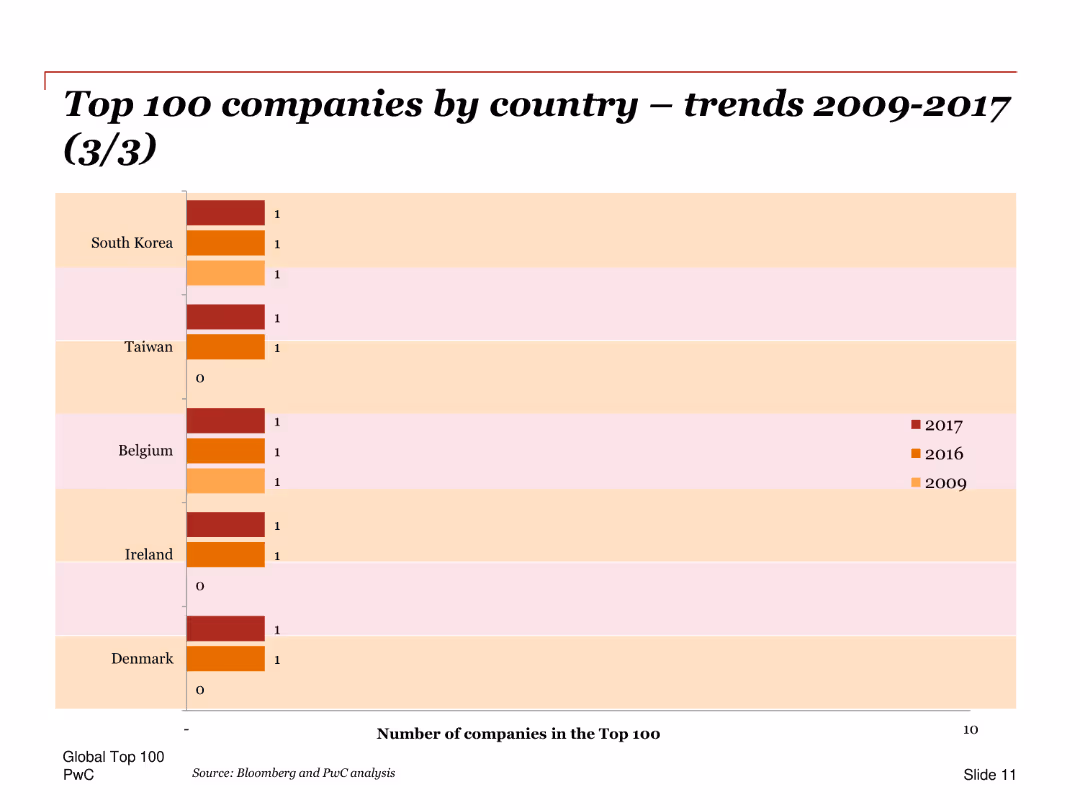
A bar chart showing the number of top 100 companies from South Korea, Taiwan, Belgium, Ireland, and Denmark for the years 2009, 2016, and 2017. The bars are horizontal, indicating the companies’ counts per year per country.
Market Analysis and Trends
Financial Services
This slide highlights the changes in the number of top 100 companies from South Korea, Taiwan, Belgium, Ireland, and Denmark over the years 2009, 2016, and 2017. It provides a comparative analysis of these countries’ standings in the top 100 companies list.
Top 100, companies, trends, countries, years, distribution, bar chart, financial analysis
Single Chart
PwC/Strategy&
Saved
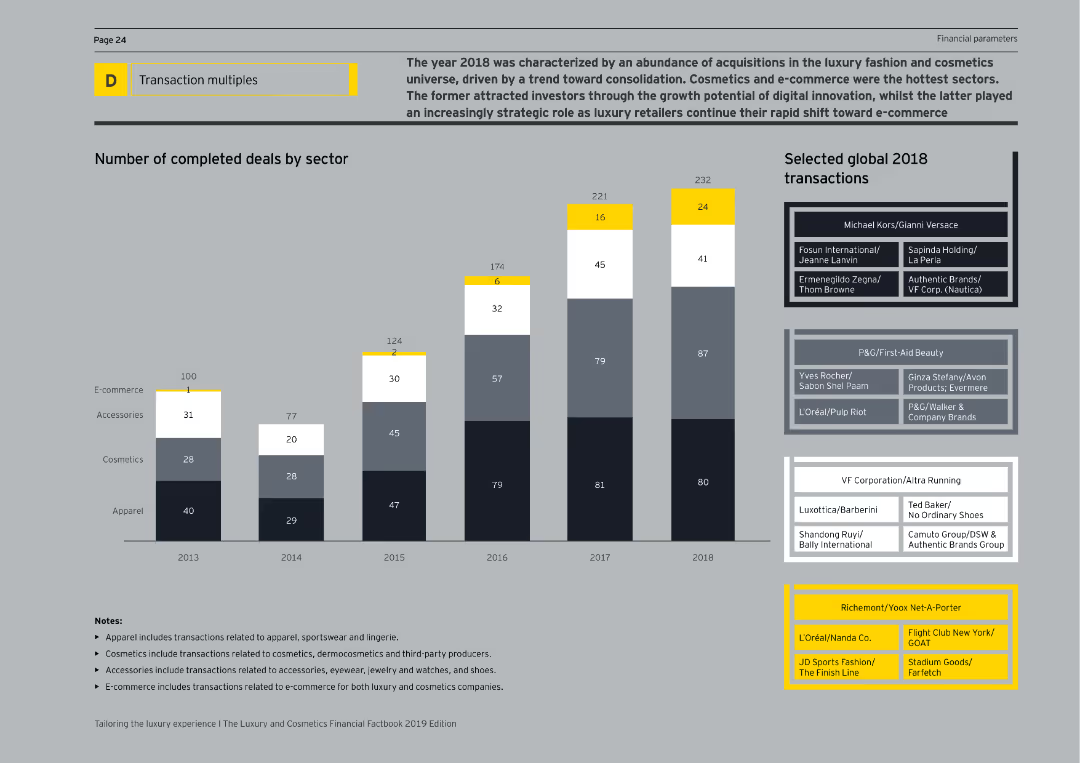
The slide features a column chart displaying the number of completed deals by sector from 2013 to 2018, and a list of selected global 2018 transactions on the right. The visual complexity is moderate, with clear labels and sector breakdowns.
Mergers and Acquisitions
Consumer Goods
The slide summarizes the acquisition activities in the luxury fashion and cosmetics sectors for 2018, highlighting the number of deals completed in various sectors such as e-commerce, accessories, cosmetics, and apparel, along with notable global transactions.
Acquisitions, Luxury, Fashion, Cosmetics, Deals
Mixed Chart
EY
Saved
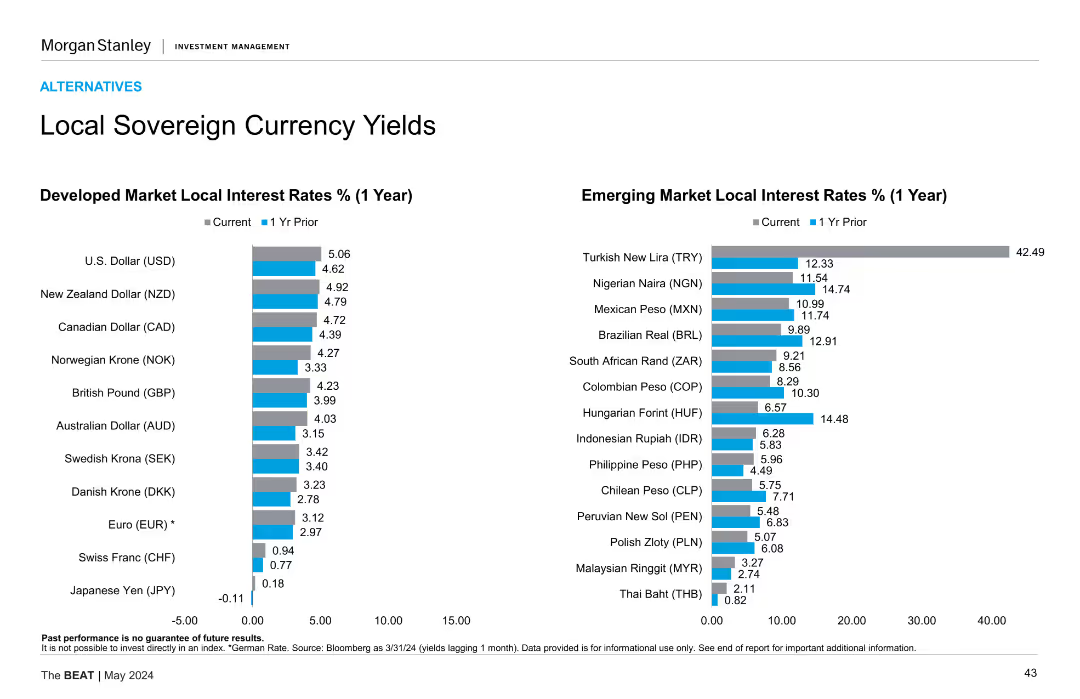
Two column charts comparing developed and emerging market local interest rates (1 year) with current and 1-year prior rates. Bars are vertical.
Market Analysis and Trends
Financial Services
Compares local interest rates for developed and emerging markets. Developed markets include USD, NZD, CAD, etc., while emerging markets include TRY, NGN, MXN, etc.
Interest rates, local currency, market
Multiple Chart
Morgan Stanley
Saved
Icons and text outlining key actions CEOs need to take to become active AI players, such as piloting fast, promoting AI innovation, and avoiding silos.
Strategic Planning
Professional Services
This slide emphasizes the importance of management leadership in AI, providing actionable steps for CEOs to enhance AI adoption in their organizations.
AI, leadership, CEOs, management, strategic planning, actions, piloting, innovation, silos, professional services
Header Vertical
BCG
Saved
Bar chart layout with rankings of countries by agreement; left-aligned text box; includes historical agreement data columns.
Market Analysis and Trends
Government & Public Sector
Evaluates whether people believe their governments would be failing them by not acting on climate change. Rankings highlight varying public trust and urgency perception across countries.
government action, climate change, public trust, global survey, Ipsos, agreement levels, cross-country comparison, environmental urgency
Mixed Chart
IPSOS
Saved
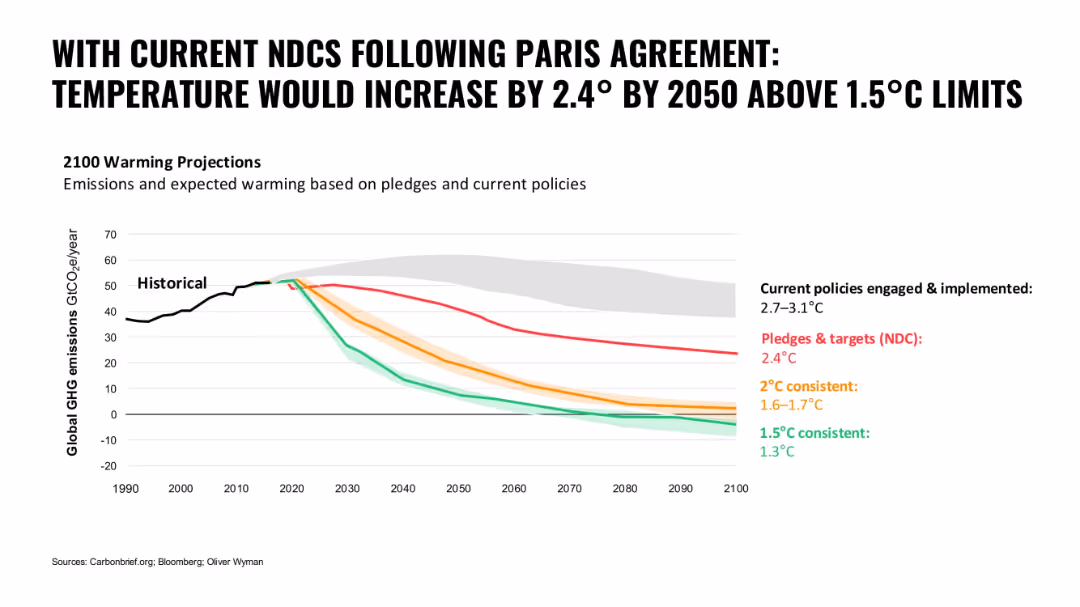
Line graph with colored paths representing different emission scenarios; bold black title and clean white background
Regulatory and Compliance
Environmental Services & Sustainability
The slide illustrates global warming projections based on current NDCs and policies versus different consistency targets. It shows the gap between policy implementation and climate goals.
climate change, NDCs, Paris Agreement, emissions, global warming, policy gap, temperature projection
Single Chart
Oliver Wyman
Saved
The slide features two bar charts showing which departments in wealth management expect the greatest time and cost savings from GenAI implementation. Text below provides further context and additional details on survey findings.
Operational Efficiency
Financial Services
This slide highlights survey results on time and cost savings expected in wealth management from GenAI implementation. It identifies client onboarding, marketing, and report generation as key areas of impact.
GenAI, time savings, cost savings, wealth management, client onboarding, marketing, report generation, survey
Multiple Chart
EY
Saved
Column chart showing headwinds impacting recent performance and drivers to achieve 2024 RoRC ambition.
Strategic Planning
Financial Services
Analyzes recent performance challenges and outlines strategies to achieve growth and sustainable returns by 2024.
performance, growth, strategic planning, headwinds, returns
Mixed Chart
Credit Suisse
Saved
An updated world map from slide 2933, now indicating growth with more markers and comparative data from 1990 to 2019. Same minimal design but with more data points.
Industry Overview
Financial Services
Showcases significant growth in international presence over 29 years with data on revenues, headcount, and offices to depict expansion success.
Global presence, development, business growth, headcount
Graphic
Goldman Sachs
Saved
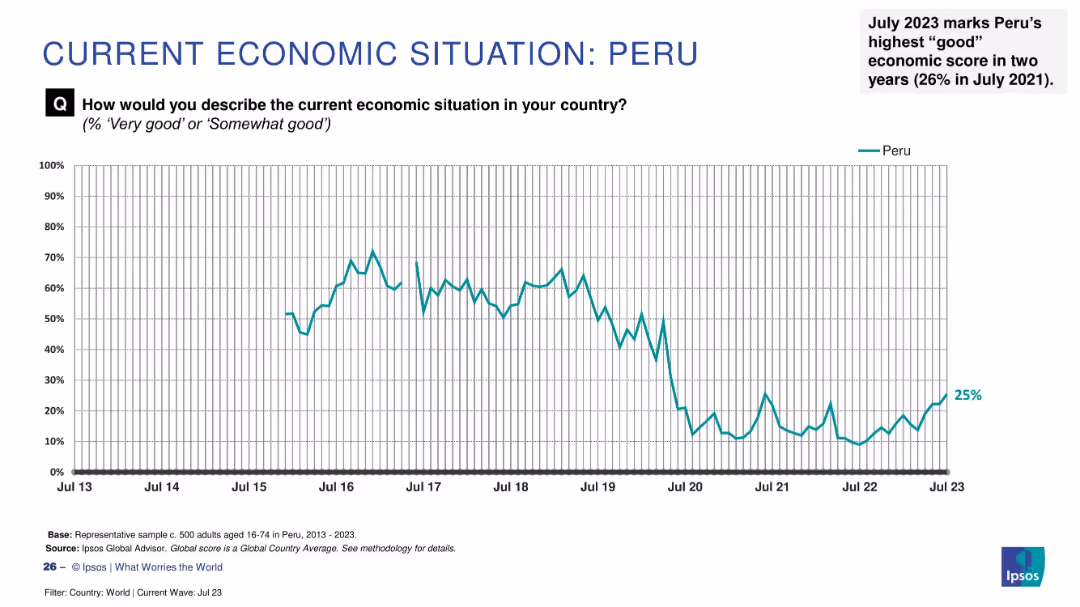
Line graph showing sentiment trend from 2013 to July 2023 with a recent rise to 25% and an annotation on 2-year high.
Market Analysis and Trends
Financial Services
Peru has reached its highest economic optimism in two years (25%) as of July 2023. This visual shows the overall downward trend followed by a modest recovery, emphasizing recent improvement.
Peru, economic sentiment, public perception, Ipsos data, 2023 trends, two-year high, economic outlook, Latin America, recovery
Single Chart
IPSOS
Saved
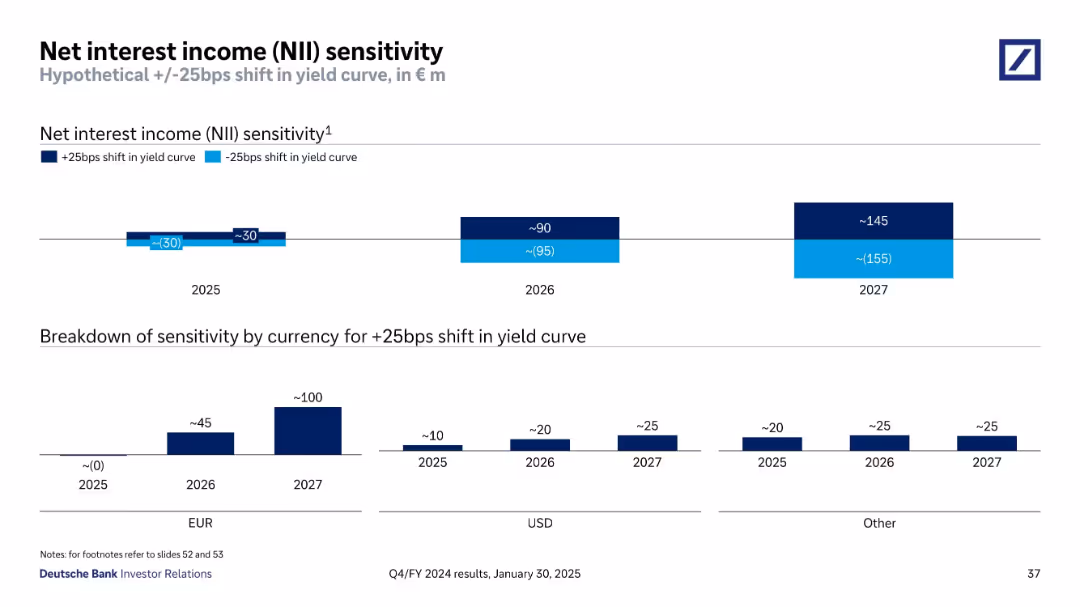
Bar chart projections showing sensitivity to +/-25bps shift in yield curve over 2025–2027
Risk Assessment and Management
Financial Services
Displays Deutsche Bank’s estimated NII sensitivity to yield curve shifts through 2027. The breakdown indicates impact by year and by currency, showing increasing NII benefit in future years under a rising rate scenario.
NII, Interest Rates, Yield Curve, Sensitivity, EUR, USD, Forecast
Multiple Chart
Deutsche Bank
Saved
Previous
Next
If nothing, comes up, please save your slides first
Create a FREE account to continue browsing
Receive Instant Access to 1,000+ slides from companies like McKinsey, Google, and Goldman Sachs
First Name
Last Name
Email
Password
I agree to all
Terms & Privacy Policy
Thank you! Your submission has been received!
Oops! Something went wrong while submitting the form.
Have an account?
Sign in
Column Chart
Heatmap
Chevron
Org Chart
Infographic
Callouts
Timeline
List
Graphic
Picture
Process Flow
Diagram
Paragraph
Map
Table
Framework
Subtitle
Takeaway Box
Icon
Other Chart
Radar Chart
Waterfall Chart
Mekko Chart
Pie Chart
Scatter Plot
Line Chart
Bar chart
Bullet points


![If [COUNTRY]’s government does not act now to combat climate change...](https://cdn.prod.website-files.com/654e70fb59937215cac87b19/6899c22ca99cd1f22e060a2a_RGMvda5XdEIOPFA76Mxz3sq9BprT25RMN5M0rb0xtFY.avif)