My Account
My Slides
Search by Category
Companies
Slide Type
Use Case
Industry
Pricing
Templates
View All Templates
Download Template Slides
✦ AI
AI Prompt Library
AI Search
Feedback
Login
Logout
Get Started
Browse all Slides
Browse all Slides
Create a FREE Account
Instant access to 1,000+ real slides from top companies like McKinsey, BCG, Goldman Sachs, Google and many more!
First Name
Last Name
Email
Password
I agree to all
Terms & Privacy Policy
Thank you! Your submission has been received!
Oops! Something went wrong while submitting the form.
Have an account?
Sign in
Saved Slides
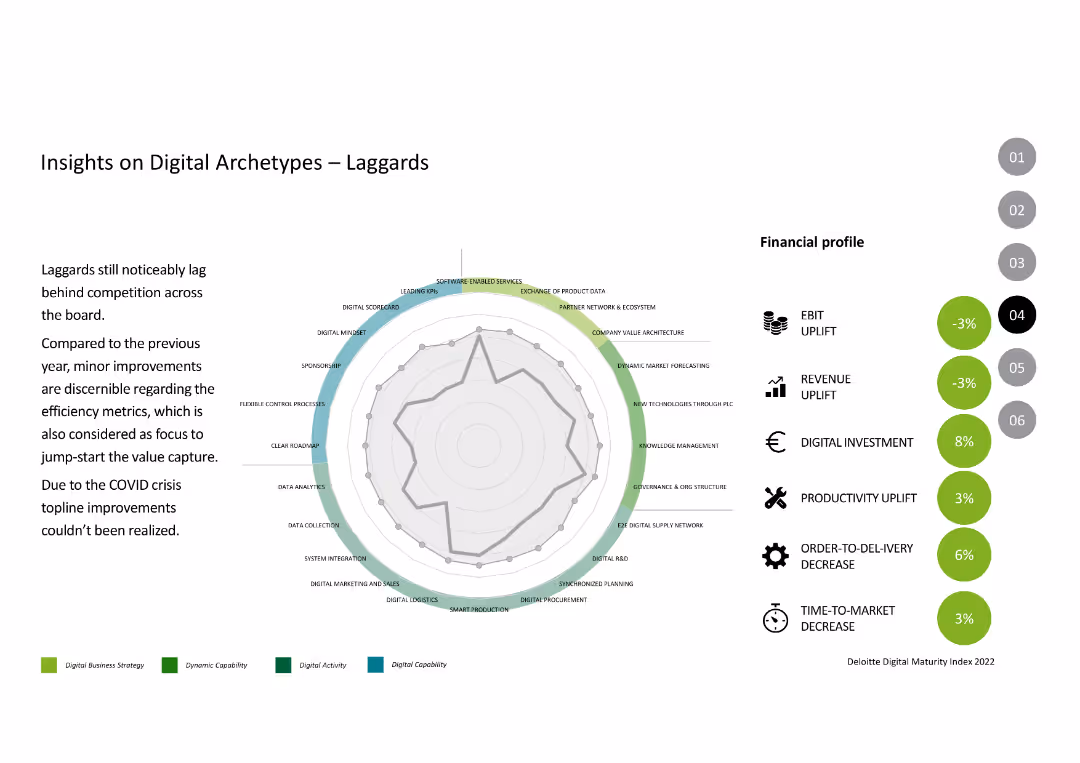
The slide features a radar chart and financial profile metrics like EBIT uplift, revenue uplift, and productivity uplift, similar to previous archetype slides.
Competitive Landscape
Industrial & Manufacturing
This slide discusses the "Laggards" archetype, focusing on their lagging performance compared to competition, highlighting their minor improvements and impact of the COVID crisis.
Digital Archetypes, Laggards, Performance, Digital Capabilities, Financial Metrics
Mixed Chart
Deloitte
Saved
Features line graphs comparing the GDP trajectories of major economies under different COVID-19 scenarios, annotated with specific percentage changes and recovery timelines.
Financial Performance
Financial Services
Analyzes the economic impact of the COVID-19 pandemic across major global economies, offering scenario-based projections for GDP growth and recovery.
GDP, economic impact, COVID-19, recovery, scenario analysis
Single Chart
McKinsey
Saved
Combines text with symbolic imagery of collaborative and technological themes.
Industry Overview
Professional Services
Offers an overview of AI's potential impact on industries, emphasizing the need for holistic approaches and ecosystem collaboration in leveraging AI.
AI Impact, Industry Transformation, Ecosystem Collaboration, Technological Advancement, Professional Insights, Business Strategy
Framework
BCG
Saved
Contains a bar chart and connected icons illustrating potential additional uses for smartphones, such as digital identification.
Market Analysis and Trends
Telecommunications
Explores potential new uses for smartphones beyond traditional functionalities, like using them as digital IDs.
smartphone utility, digital ID, technology adoption, consumer behavior, future trends
Mixed Chart
Deloitte
Saved
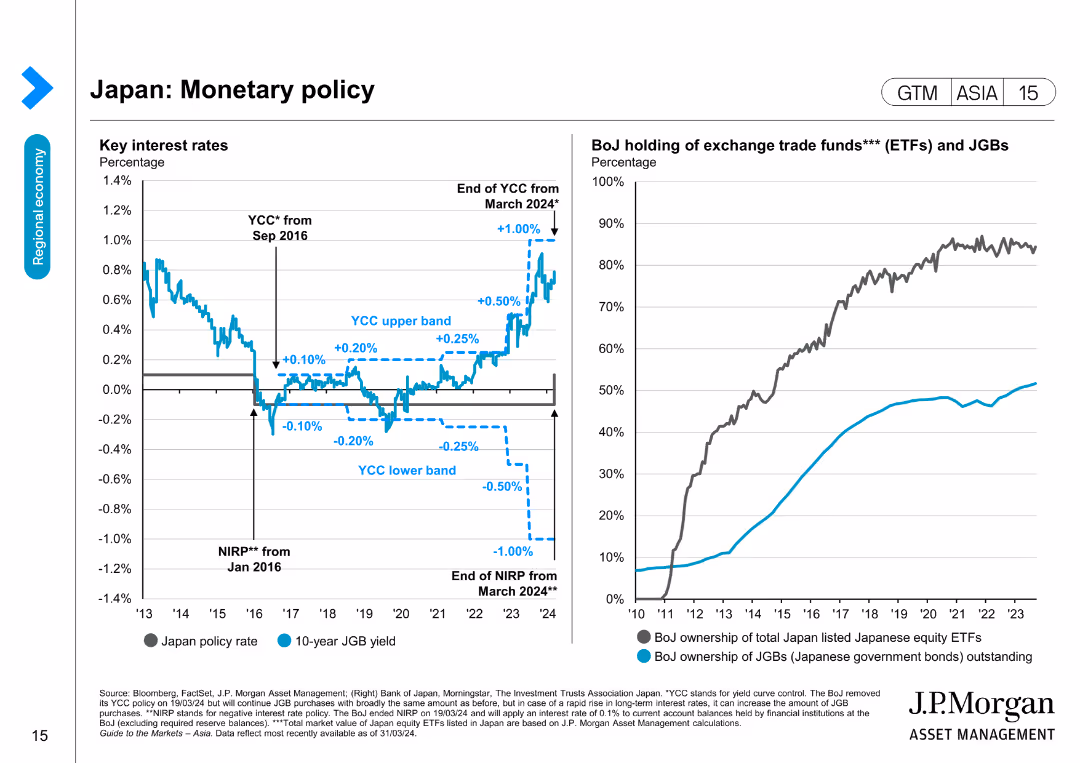
The slide features two column charts. The left chart shows Japan's key interest rates over time, with various milestones and trends annotated. The right chart illustrates the BoJ's holdings of ETFs and JGBs, with two lines indicating ownership percentages.
Market Analysis and Trends
Financial Services
The slide provides an analysis of Japan's monetary policy, highlighting key interest rates and the Bank of Japan's holdings in exchange trade funds and government bonds. It is used to discuss monetary trends and their implications on the financial market.
Japan, monetary policy, interest rates, BoJ, ETFs, JGBs, financial trends, market analysis, central bank, government bonds
Multiple Chart
JP Morgan
Saved
The slide includes a main text section at the top, followed by two sets of data visuals. The left visual is a column chart showing the top concerns among Gen Zs, and the right visual for millennials.
Market Analysis and Trends
Consumer Goods
The slide highlights the top concerns for Gen Z and millennials, with cost of living being the primary issue. It includes survey data showing the percentages of respondents from both groups who are concerned about various issues like climate change and unemployment.
Gen Z, millennials, cost of living, survey, concerns
Multiple Chart
Deloitte
Saved
Slide features a circular diagram labeled "McKinsey Sustainability Compass," surrounded by various business areas influenced by SDG initiatives, such as innovation, risk management, and talent management, in a clean, professional design.
Strategic Planning
Professional Services
Explains how McKinsey uses the UN Sustainable Development Goals to drive value in areas like diversity and inclusion, environmental sustainability, and circular economy practices within its business operations and consulting services.
McKinsey, sustainability, SDGs, business strategy, corporate practices
Diagram
McKinsey
Saved
A timeline highlighting key milestones in sustainability, with bullet points on either side summarizing major initiatives and achievements.
Strategic Planning
Financial Services
This slide traces the company's history of sustainability leadership, featuring milestones such as environmental policy framework and clean energy investments, underlining the firm's long-term commitment to environmental and social governance.
Sustainability, Environmental Policy, Clean Energy, Social Governance, Corporate Responsibility
Linear Flow
Goldman Sachs
Saved
The slide displays multiple data visualizations including a donut chart showing tax revenue breakdown, and two sets of column charts comparing income and company tax over three years.
Financial Performance
Government & Public Sector
This slide presents Namibia's tax revenue composition and comparisons for income tax on individuals and company tax, illustrating fiscal trends and government financial management.
tax, revenue, Namibia, income tax, company tax, fiscal trends, financial management, government
Multiple Chart
PwC/Strategy&
Saved
The slide features a table and bar charts displaying various levers for service and after-sales with their activity levels and trends.
Operational Efficiency
Consumer Goods
Highlights key levers in service and after-sales, focusing on performance improvement, go-to-market strategies, and customer lock-in.
Service, After-sales, Performance, Efficiency, Trends
Single Chart
Roland Berger
Saved
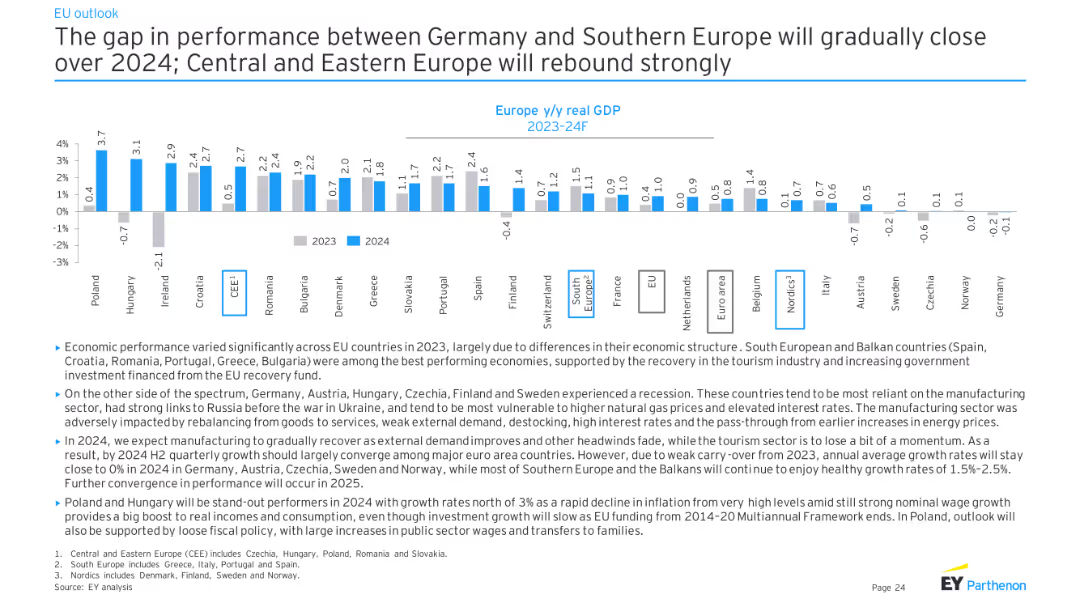
The slide features a column chart depicting Europe y/y real GDP (2023-24F) for various countries. The data is presented in a comparative format, showing projected GDP growth rates across Europe with textual explanations at the bottom.
Market Analysis and Trends
Financial Services
This slide discusses the expected convergence in economic performance between Germany and Southern Europe in 2024, while Central and Eastern Europe are projected to rebound strongly. It provides a comparative analysis of GDP growth rates across different European regions.
GDP growth, Europe, economic convergence, forecast
Mixed Chart
EY
Saved
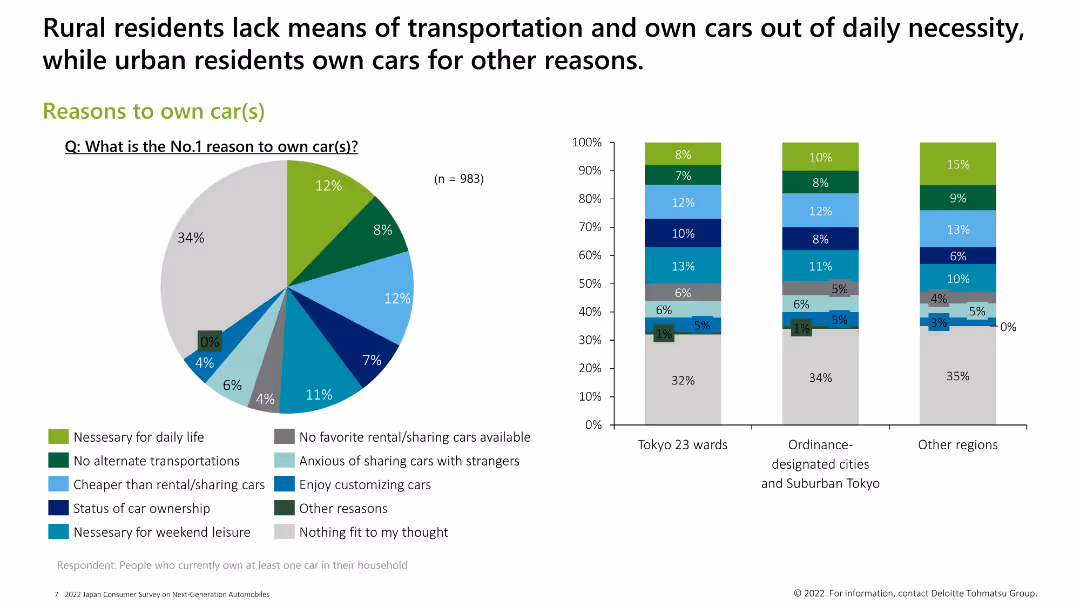
Contains a pie chart and three column charts showing various reasons people own cars, categorized by region.
Market Analysis and Trends
Consumer Goods
The slide highlights the primary reasons for car ownership, such as daily necessity, lack of alternative transportation, and personal preferences.
car ownership reasons, necessity, transportation, preferences
Multiple Chart
Deloitte
Saved
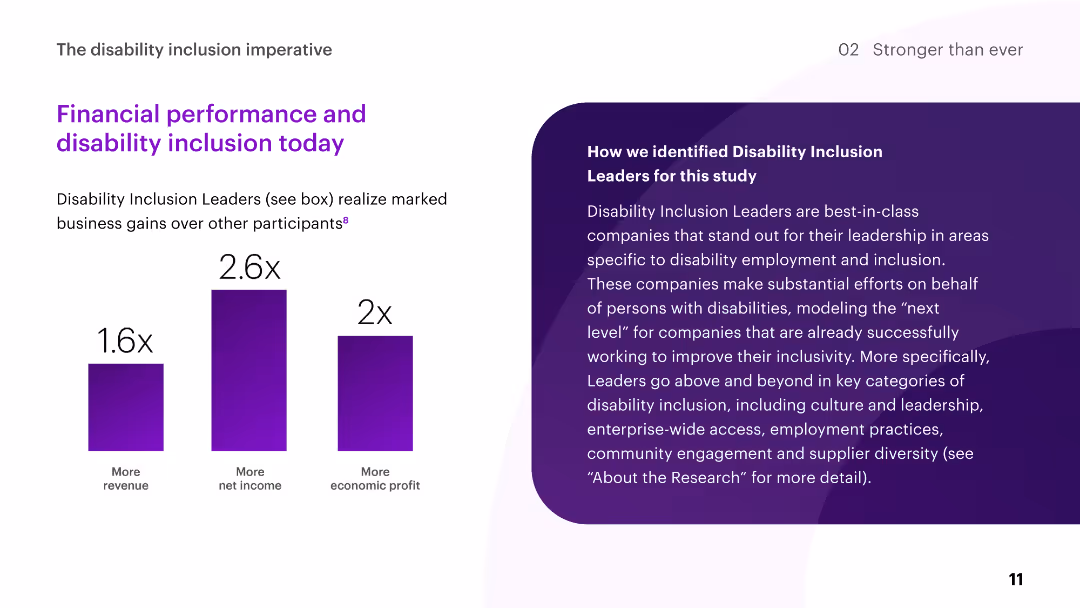
The slide includes column charts showing the financial performance of Disability Inclusion Leaders compared to other participants, highlighting revenue, net income, and economic profit.
Human Resources and Talent Management
Professional Services
The slide illustrates the business gains realized by Disability Inclusion Leaders, emphasizing higher revenue, net income, and economic profit compared to other participants.
disability inclusion, financial performance, revenue, net income, profit
Mixed Chart
Accenture
Saved
The slide features a column chart comparing year-on-year percentage change in real GDP from 2022 to 2025 across various regions, including Global, US, Euro area, UK, Japan, China, India, Brazil, Developed markets, and Emerging markets. The chart uses different colors to represent the years.
Market Analysis and Trends
Financial Services
This slide presents projections for the global economy, highlighting expected growth trajectories from 2022 to 2025. It compares real GDP percentage changes across multiple regions, offering insights into the economic outlook for developed and emerging markets over the forecast period.
global economy, GDP, financial services, market trends, economic projections, real GDP, developed markets, emerging markets, growth trajectory, forecast
Single Chart
EY
Saved
Column chart displaying survey results with percentages for Europe, United States, and APAC regions. Five main processes listed.
Technology and Digital Transformation
Technology & Software
The slide shows the top five processes companies use to ensure technology adoption, including organizational structure and innovation units.
technology, adoption, processes, survey, Europe, US, APAC, innovation, KPI, skills
Mixed Chart
Accenture
Saved
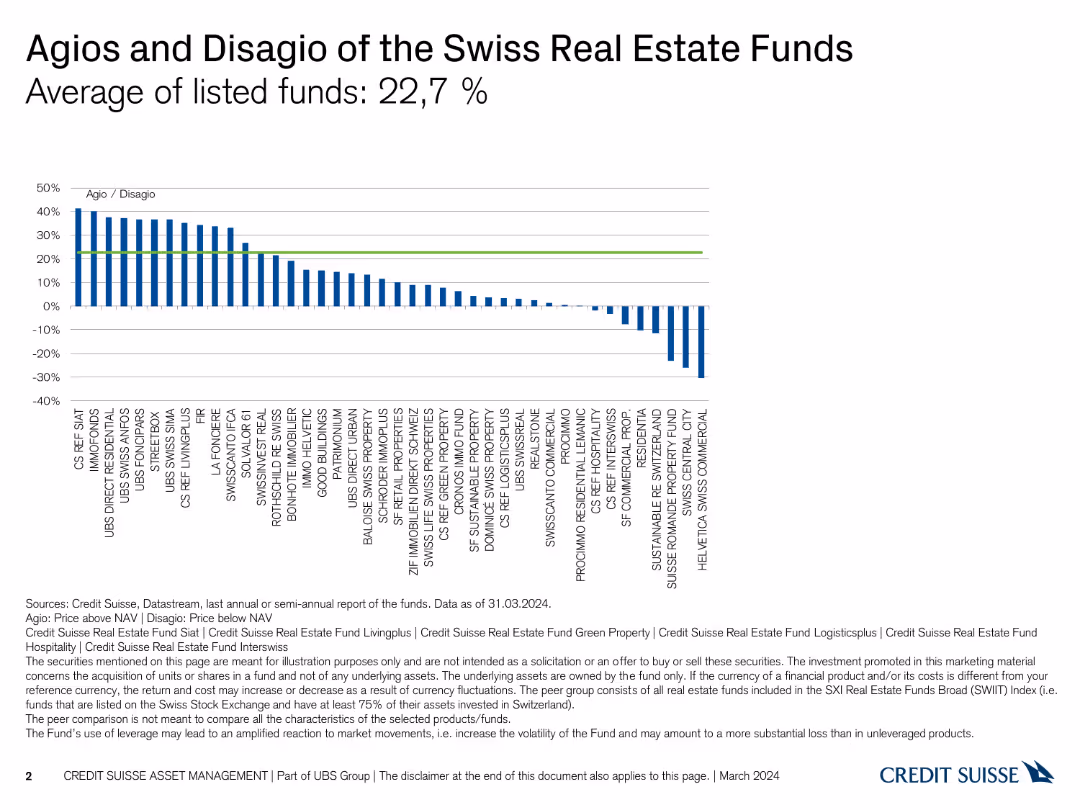
The slide includes a column chart showing agios and disagio of various Swiss real estate funds. It is moderately complex with clear visual data representation.
Investment Analysis
Real Estate & Construction
The slide analyzes the average agios and disagio of Swiss real estate funds, providing insights into fund performance as of March 2024.
agios, disagio, real estate, funds, performance
Single Chart
Credit Suisse
Saved
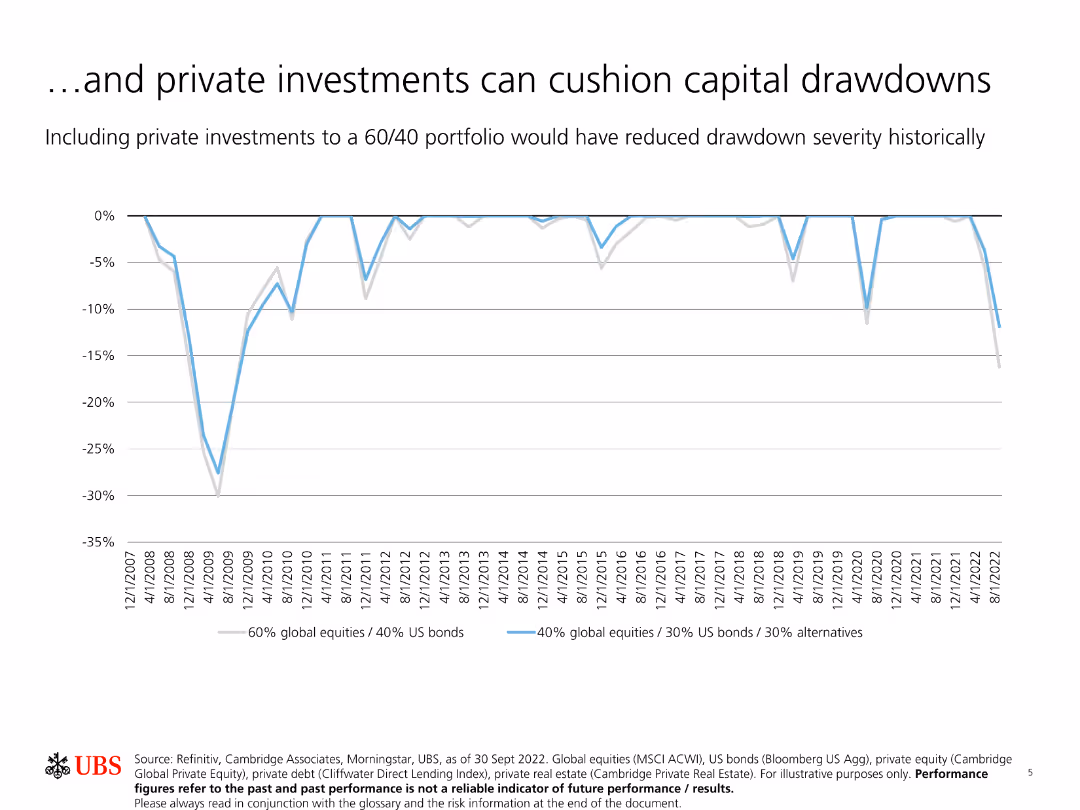
The slide shows a line chart depicting the historical drawdown severity of different portfolio allocations, indicating reduced severity with private investments.
Risk Assessment and Management
Financial Services
This slide illustrates how including private investments in a 60/40 portfolio could have reduced the severity of capital drawdowns historically, supporting the risk mitigation benefits of private assets.
Capital drawdowns, private investments, risk mitigation, portfolio, historical data
Single Chart
UBS
Saved
The slide features bar charts showing different levers in R&D with corresponding activity levels and trends over time.
Sales and Business Development
Technology & Software
Highlights R&D levers focusing on network optimization, cross-functional cost optimization, and product development processes.
R&D, Network Optimization, Product Development, Trends
Single Chart
Roland Berger
Saved
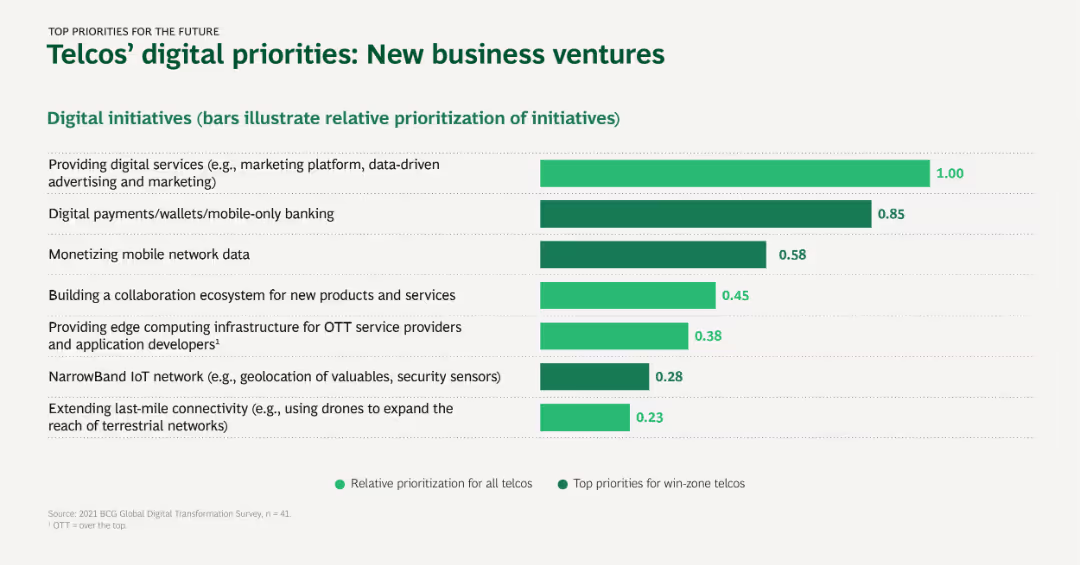
Horizontal bar chart representing the prioritization of digital initiatives for new business ventures in telcos, with a focus on top and relative priorities.
Market Analysis and Trends
Telecommunications
This slide details the digital initiatives telcos are prioritizing for new business ventures, including digital services, mobile banking, and IoT networks.
Digital services, Mobile banking, Network data, IoT, Business ventures
Single Chart
BCG
Saved
Lists key activities in making a product fully circular, with a case example of Timberland's transformation journey.
Product and Service Analysis
Environmental Services & Sustainability
Provides a roadmap for making a product fully circular, emphasizing the importance of starting small, learning, and scaling. Ideal for use in product development meetings or sustainability strategy sessions, focusing on practical steps and high-impact strategies for circular product design.
Circular economy, Timberland, Product design, Sustainability, High-impact strategy, Scaling, Learning, Circular transformation, Product lifecycle, Innovation
Linear Flow
Accenture
Saved
The slide presents quantitative data via column charts and includes a photo of a branch and digital devices. Charts show trends over time with annotations for significant changes.
Technology and Digital Transformation
Financial Services
Depicts the bank's shift towards digital operations, emphasizing the reduction in physical branches and growth in digital transaction volumes, highlighting technological adoption in banking.
Digital Transition, Branches, Transactions
Multiple Chart
Goldman Sachs
Saved
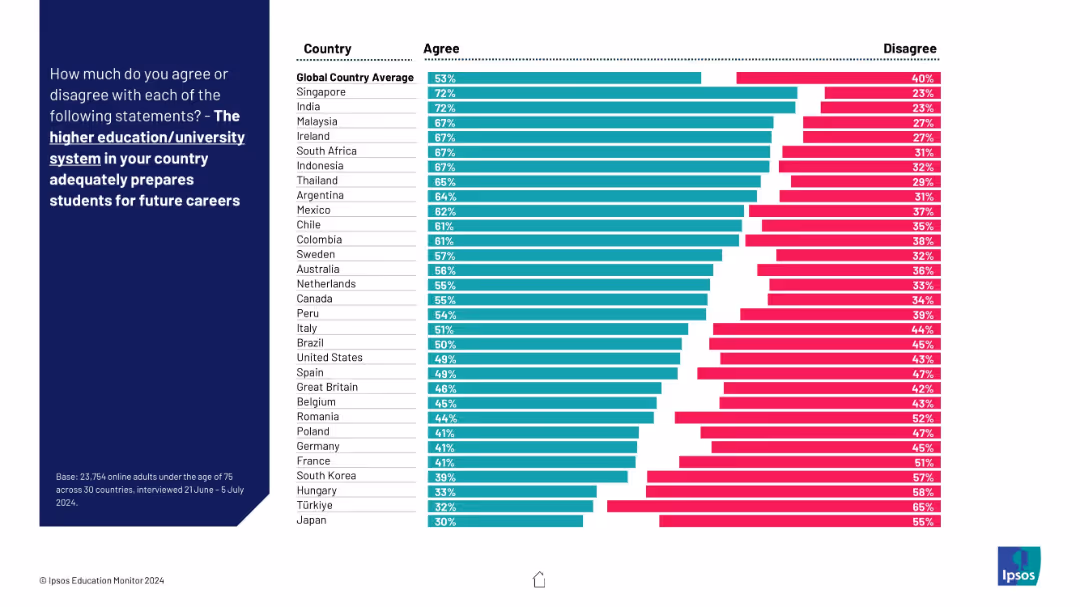
Ranked horizontal bar chart by country showing agree/disagree percentages. Global average benchmarked at top. Countries arranged highest to lowest in agreement.
Market Analysis and Trends
Education & Training
The chart ranks 30 countries by agreement levels on how well their higher education systems prepare students for careers. Singapore and India rank highest, while Hungary and Japan rank lowest.
global ranking, higher education, country comparison, future careers, university preparation
Mixed Chart
IPSOS
Saved
Column chart detailing adjusted pre-tax income/loss and adjustments for various divisions.
Financial Performance
Financial Services
Analyzes the financial performance of Credit Suisse in 4Q22, focusing on losses due to Investment Bank performance.
financial performance, net loss, investment bank, client activity, pre-tax income
Single Chart
Credit Suisse
Saved
The slide includes a line chart comparing cost estimates for long-distance CO2 transport using various methods.
Financial Performance
Energy & Utilities
This slide presents cost estimates for transporting CO2 over long distances by ship, offshore pipeline, and onshore pipeline.
CO2 transport, costs, long-distance, pipeline, ship
Single Chart
Kearney
Saved
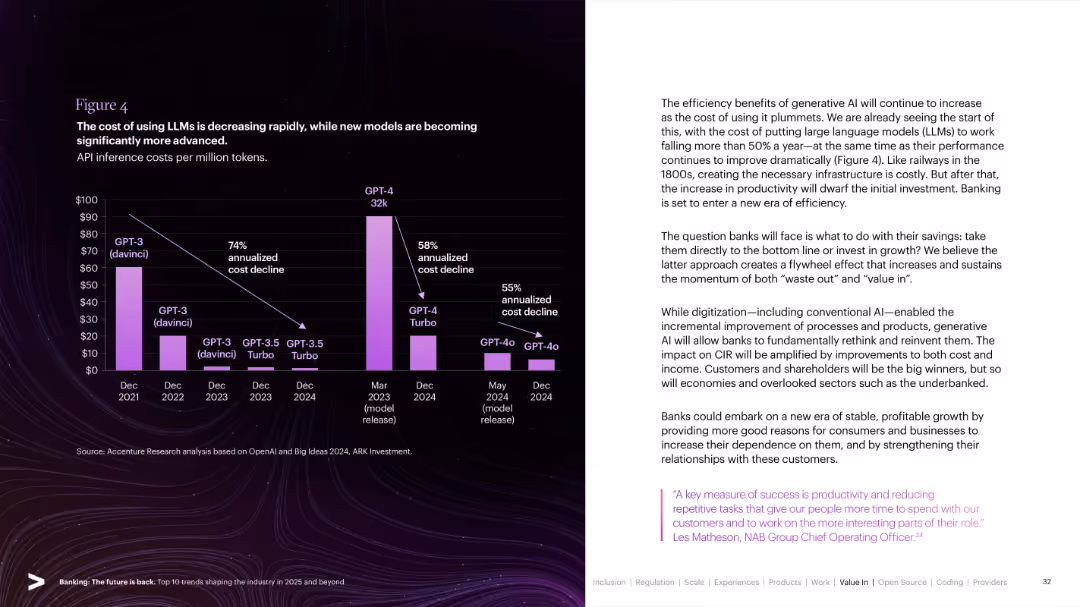
Bar chart over a dark background showing API cost decline of various LLMs (GPT-3, GPT-4 etc.). Explanatory text on the right.
Technology and Digital Transformation
Artificial Intelligence
Depicts the rapid reduction in API inference costs of large language models (LLMs) from 2021–2024, alongside advancements in model performance. Discusses how this cost efficiency drives productivity in banking and beyond.
LLM, GPT-4, Inference Cost, AI Efficiency, API Costs, AI Adoption, Banking Innovation, Digital Transformation
Mixed Chart
Accenture
Saved
Previous
Next
If nothing, comes up, please save your slides first
Create a FREE account to continue browsing
Receive Instant Access to 1,000+ slides from companies like McKinsey, Google, and Goldman Sachs
First Name
Last Name
Email
Password
I agree to all
Terms & Privacy Policy
Thank you! Your submission has been received!
Oops! Something went wrong while submitting the form.
Have an account?
Sign in
Column Chart
Heatmap
Chevron
Org Chart
Infographic
Callouts
Timeline
List
Graphic
Picture
Process Flow
Diagram
Paragraph
Map
Table
Framework
Subtitle
Takeaway Box
Icon
Other Chart
Radar Chart
Waterfall Chart
Mekko Chart
Pie Chart
Scatter Plot
Line Chart
Bar chart
Bullet points