My Account
My Slides
Search by Category
Companies
Slide Type
Use Case
Industry
Pricing
Templates
View All Templates
Download Template Slides
✦ AI
AI Prompt Library
AI Search
Feedback
Login
Logout
Get Started
Browse all Slides
Browse all Slides
Create a FREE Account
Instant access to 1,000+ real slides from top companies like McKinsey, BCG, Goldman Sachs, Google and many more!
First Name
Last Name
Email
Password
I agree to all
Terms & Privacy Policy
Thank you! Your submission has been received!
Oops! Something went wrong while submitting the form.
Have an account?
Sign in
Saved Slides
This slide includes a column chart comparing the expected changes in the proportion of acute beds over the next five years by country and hospital type.
Strategic Planning
Healthcare & Pharmaceuticals
This slide predicts an increase in the demand for acute beds in hospitals over the next five years, with detailed analysis by country and hospital type.
acute beds, demand surge, hospital planning, future trends, regional analysis
Multiple Chart
LEK
Saved
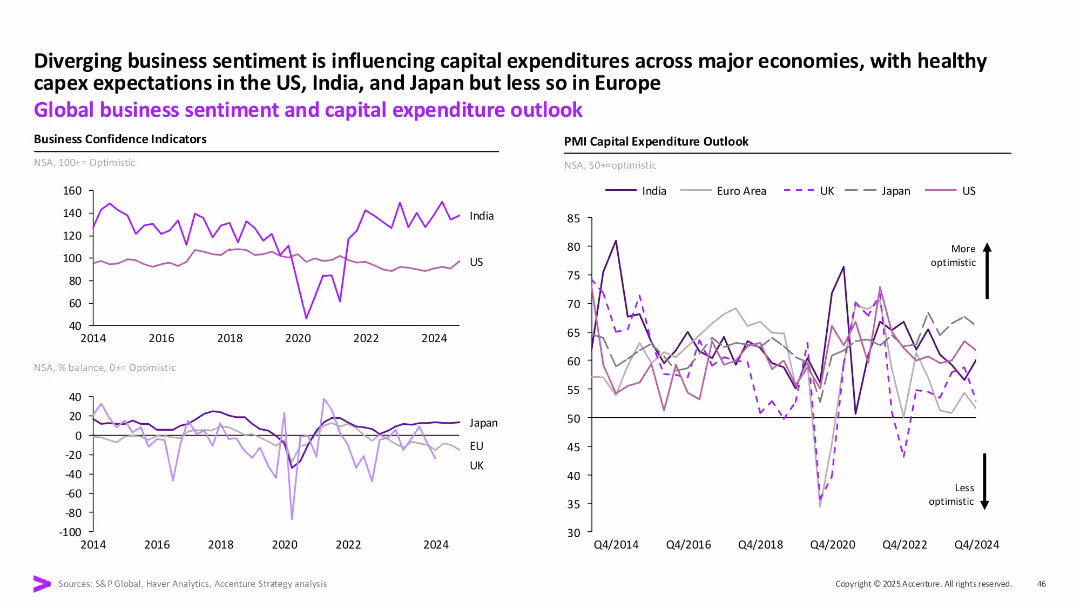
Two-panel line charts: Left shows business confidence indicators; Right shows PMI capital expenditure outlook across India, US, Euro area, UK, Japan.
Strategic Planning
Professional Services
The slide compares business sentiment and capex expectations globally. India and the US show stronger optimism, while Europe and Japan remain more subdued. It uses PMI and business confidence indicators to illustrate diverging economic outlooks.
business confidence, capex, India, US, Euro area, PMI, optimism, sentiment
Multiple Chart
Accenture
Saved
Multiple column charts showing growth in different financial services areas, complemented by textual analysis on the right.
Market Analysis and Trends
Financial Services
Demonstrates growth across home loans, deposits, and funds on the banking platform, with an emphasis on business banking loans and vehicle financing. It’s designed for market trend analysis and business development strategies, providing a visual representation of the company's expansion in these sectors.
banking, growth, trends, funds, loans
Multiple Chart
Morgan Stanley
Saved
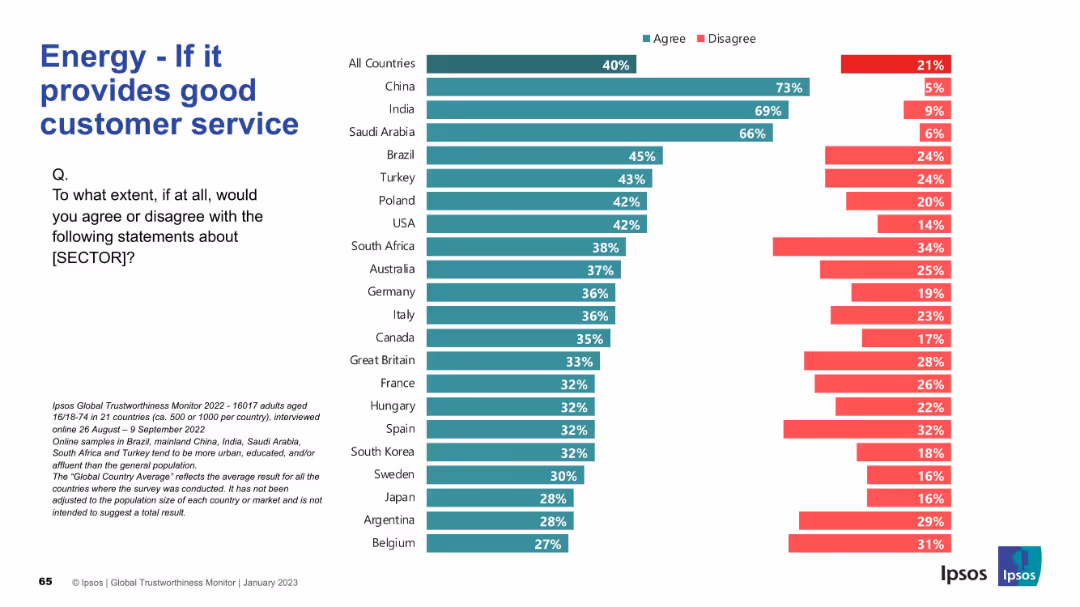
Split-screen layout with a large left-aligned title, explanatory question, and bar graph on the right.
Customer and Market Segmentation
Energy & Utilities
This slide shows global and country-specific agreement/disagreement percentages about the energy sector being trustworthy if it provides good customer service.
energy, trust, customer service, perception, Ipsos, agreement, survey, countries, utilities, public opinion
Mixed Chart
IPSOS
Saved
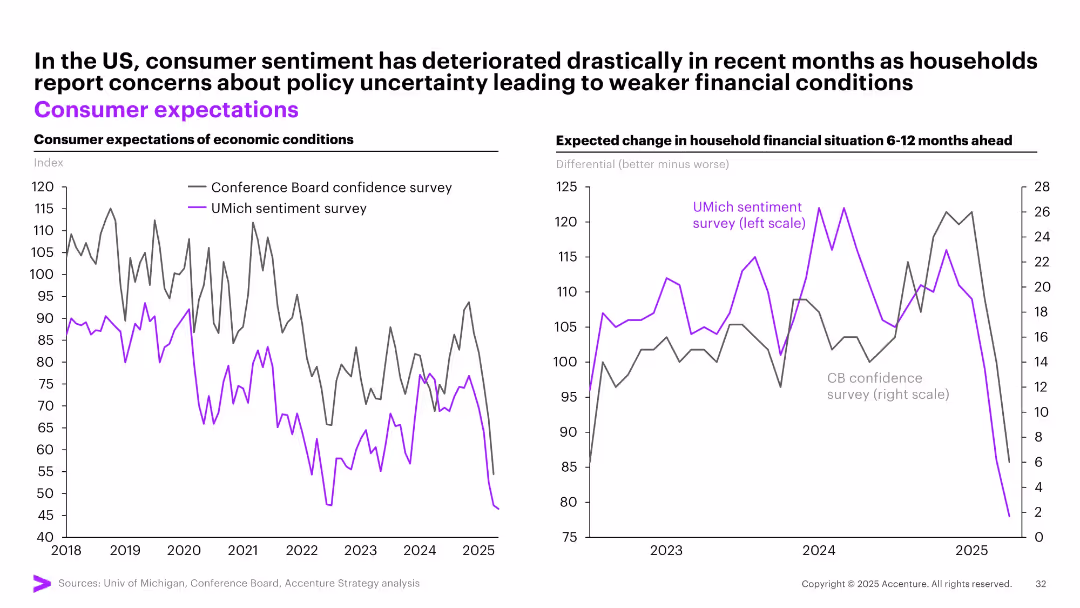
Dual line charts comparing US consumer expectations from two different sentiment surveys over time.
Market Analysis and Trends
Financial Services
The slide shows a marked decline in consumer sentiment in the US based on two major surveys (Conference Board and UMich), reflecting rising concerns over future economic and financial conditions amid policy uncertainty.
consumer sentiment, US economy, surveys, financial outlook, expectations, decline, uncertainty, economic mood
Multiple Chart
Accenture
Saved
Various column charts comparing financial performance metrics (ROIC, shareholder return, resilience index) between tech-forward companies and others. Text explains these performance advantages.
Performance Metrics and KPIs
Technology & Software
The slide compares the performance of tech-forward companies to their peers, highlighting superior financial metrics and resilience.
Tech-Forward, Performance, Financial Metrics, Resilience, Comparison
Multiple Chart
Accenture
Saved
Comprising of bar charts and textual sections, this slide visually presents Barclays' capabilities and achievements in the US partner card market. It highlights their growth in partner card receivables and reasons partners choose Barclays, like track record and partnership focus.
Market Analysis and Trends
Financial Services
This slide discusses Barclays' strategic advantages in the US partner card market, showcasing their growth in partner card receivables and reasons why partners opt for Barclays, emphasizing their specialized capabilities.
growth, partner market, receivables, partnership focus, integration
Mixed Chart
Barclays
Saved
Features a line chart on the left comparing WTI crude oil price and US rig count, and a line chart on the right showing crude oil production by country.
Market Analysis and Trends
Energy & Utilities
This slide provides insights into the oil market, comparing WTI crude oil prices with US rig counts and analyzing oil production trends across different countries.
oil prices, WTI crude, rig count, production, countries
Multiple Chart
JP Morgan
Saved
A multi-graph layout depicting the "Accenture Global Disruption Index" with separate graphs for overall disruption and various factors like Economic, Social, and Technological. The graphs show trends over time, with the overall level of disruption having a notable increase marked "~200%."
Risk Assessment and Management
Technology & Software
This analytical slide presents data on the increasing levels of global disruption influenced by various factors, intending to inform decision-makers about the growing importance of resilience and adaptive strategies in the face of diverse economic, social, and technological challenges.
disruption, global trends, economic, social, technological, Accenture, index
Multiple Chart
Accenture
Saved
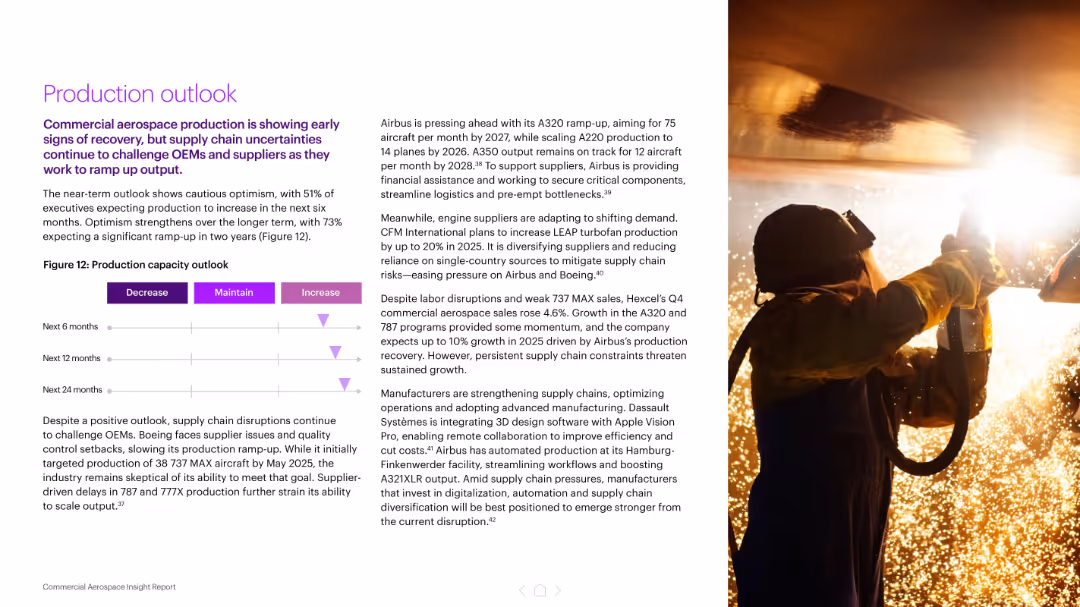
Left-aligned text with an increase/decrease triangle graphic for production forecasts; right image shows a factory worker. Purple accent graphics.
Operational Efficiency
Industrial & Manufacturing
Discusses anticipated recovery in aerospace production, with 73% of executives expecting output to increase in 2 years. Emphasizes supply chain constraints and efforts by OEMs like Airbus and Boeing to overcome them.
aerospace production, supply chain, Airbus, Boeing, OEMs, ramp-up, recovery, manufacturing, forecasting
Mixed Chart
Accenture
Saved
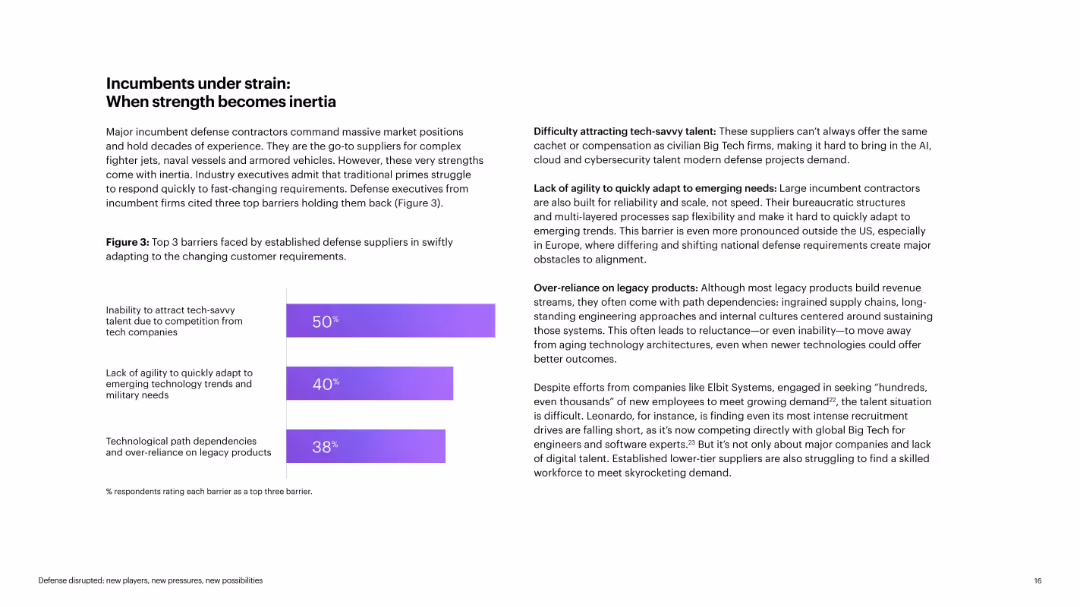
Two-column layout with left side featuring a horizontal bar chart and summary; right side includes detailed text with bold subheadings. Clean design with purple-accented chart.
Strategic Planning
Government & Public Sector
Highlights the inertia in incumbent defense suppliers, naming top barriers: inability to attract tech talent, lack of agility, and over-reliance on legacy tech. It emphasizes how these hinder rapid response to evolving military needs.
defense, incumbents, tech talent, agility, legacy systems, barriers
Mixed Chart
Accenture
Saved
Features a bar chart comparing growth rates based on interoperability levels across different regions, set against a gradient purple background. Includes detailed descriptions and key statistical highlights.
Technology and Digital Transformation
Technology & Software
Analyzes the correlation between high interoperability and increased revenue growth in Growth Markets, suggesting strategies for technology integration and business transformation. Useful for IT and business strategy meetings.
interoperability, revenue growth, Growth Markets, technology integration, business transformation
Mixed Chart
Accenture
Saved
A gray and purple map highlights selected cities with their economic contribution in bubbles, and explanatory text to the side, with a clean and effective presentation of data.
Financial Performance
Technology & Software
Demonstrates the significant economic contribution of Greater Jakarta to Indonesia's GDP, offering a geographic and economic overview for potential investors or policymakers.
Jakarta, GDP, economic contribution, Indonesian economy
Single Chart
Kearney
Saved
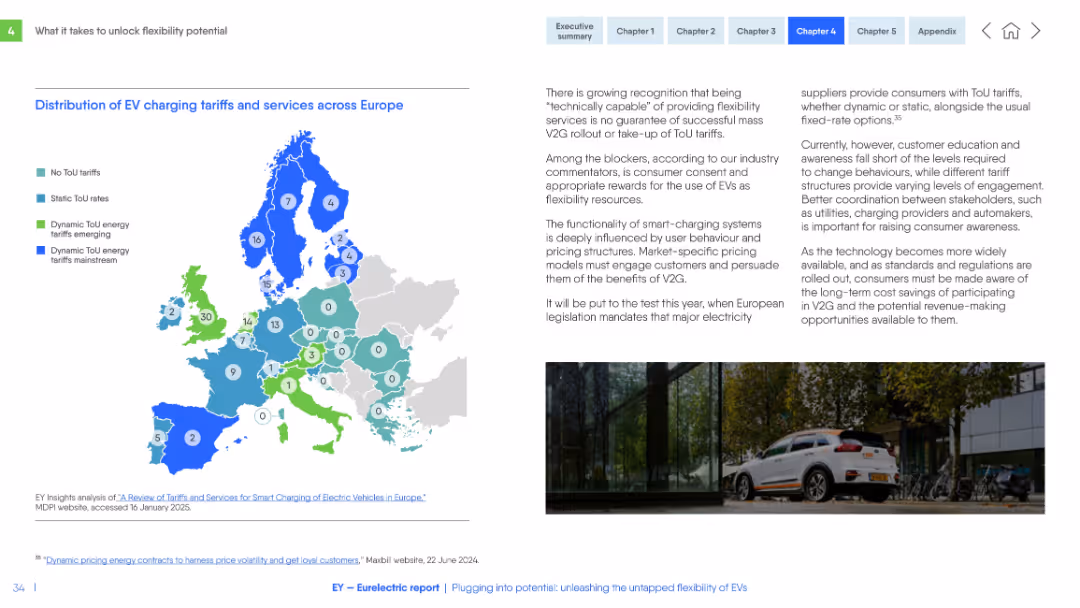
Color-coded map of Europe showing ToU tariffs. Text commentary on the right explains challenges of EV user engagement and pricing models.
Pricing Strategies
Transportation & Logistics
This slide maps the presence of time-of-use (ToU) tariffs across Europe and discusses consumer awareness, engagement levels, and regulatory implications of tariff adoption for EV smart-charging services.
EV charging, ToU tariffs, pricing models, Europe, consumer engagement, regulation, flexibility, energy services
Mixed Chart
EY
Saved
Pie charts depicting market size and Morgan Stanley's share in various financial service categories. Utilizes blue shades and annotations.
Competitive Landscape
Financial Services
Examines Morgan Stanley's market share in different financial service sectors, identifying opportunities to deepen market penetration.
Market share, financial services, Morgan Stanley, client reach, industry sectors, market penetration, opportunity
Multiple Chart
Goldman Sachs
Saved
The slide includes a column chart illustrating the transition to renewable energy on farms and electric vehicles. It provides detailed descriptions of included actions and example initiatives.
Technology and Digital Transformation
Agriculture & Food Production
This slide outlines the transition to renewable energy and electric vehicles in agriculture. It highlights the adoption of renewable energy on farms, the transition to electric vehicles, and their impact on emissions reduction and cost savings.
Renewable energy, Electric vehicles, Agriculture, Emissions, Cost savings
Mixed Chart
EY
Saved
A column chart and a bar chart showing potential CO2 emissions reduction from CCUS on thermal power plants.
Market Analysis and Trends
Energy & Utilities
Illustrates the impact of retrofitting power plants with CCUS on reducing CO2 emissions.
CCUS, CO2 reduction, power plants, retrofitting, emissions
Multiple Chart
Kearney
Saved
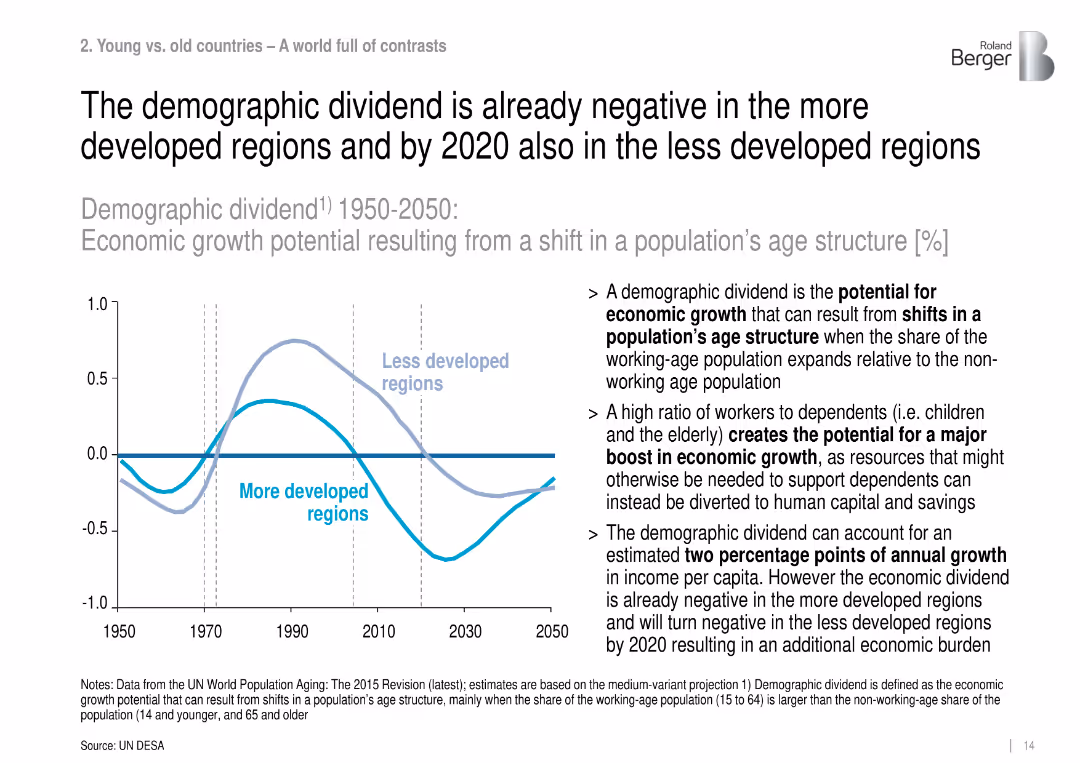
Dual-line chart with accompanying text, illustrating economic growth potential due to demographic structure shifts from 1950 to 2050.
Strategic Planning
Government & Public Sector
This slide discusses demographic dividends, showing how more developed regions have already lost growth benefits from age structure shifts, and less developed regions will follow by 2020, impacting economic output.
demographic dividend, economic growth, age structure, dependency ratio, population aging, labor force
Mixed Chart
Roland Berger
Saved
Slide shows a bar chart with rankings of service attributes, a bulleted list of key findings on shared services, and simple graphical elements in green and blue. Layout includes side-by-side content and graphics sections.
Market Analysis and Trends
Professional Services
The slide presents key findings from a 2017 survey on shared services, focusing on governance and operational priorities such as cost and timeliness of services. It’s used to compare changes in priorities over time and their impact on business strategies.
Shared services, governance, cost, timeliness, survey, operational priorities
Mixed Chart
Deloitte
Saved
This slide uses a timeline format to detail significant events in Tyson's sustainability efforts, marked by circular nodes. The visual arrangement is clear and orderly, using colors to differentiate dates and events, which enhances readability.
Regulatory and Compliance
Environmental Services & Sustainability
Outlines key milestones in Tyson's sustainability journey, including appointments, program rollouts, and strategic partnerships. This slide is likely aimed at stakeholders interested in corporate responsibility, providing a concise overview of Tyson's commitment to environmental and social initiatives.
Sustainability, Tyson, Corporate Responsibility, Milestones, Timeline
Linear Flow
Barclays
Saved
Two-part slide; the left discusses the Multi-Earner Era with line graphs on search trends, the right examines Obesity x Social Media with a spike graph and thematic analysis.
Market Analysis and Trends
Financial Services
The slide examines the rise of the multi-earner era due to AI advancements and the impact of social media on obesity-related product growth, relevant for market strategists and health industry analysts.
Multi-earner, generative AI, social media, obesity, market trends, health products, AI impact, search trends, health industry analysis, product growth
Mixed Chart
Morgan Stanley
Saved
A bar graph showing the percentage spend allocation on different e-commerce categories across several Southeast Asian countries, with clear segmentation.
Market Analysis and Trends
Retail & E-commerce
Analyzes the rise of business messaging as part of digital shopping, giving a breakdown of e-commerce spending across Southeast Asian countries.
business messaging, e-commerce, digital shopping, spend allocation, Southeast Asia, trends, rise, analysis
Multiple Chart
Bain
Saved
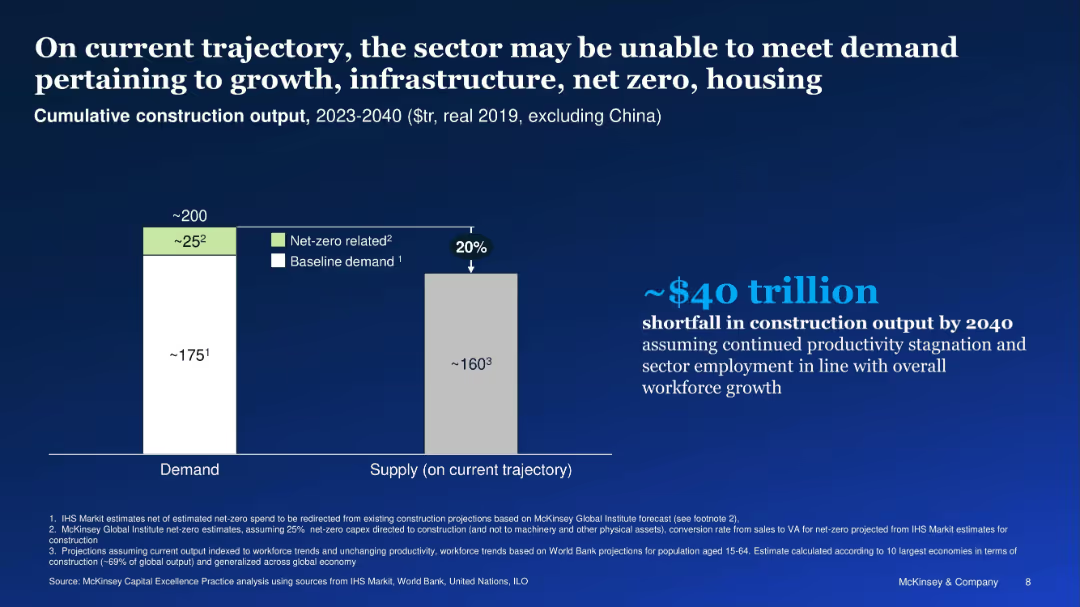
Bar chart comparing projected demand and supply; $40T gap highlighted
Strategic Planning
Real Estate & Construction
The slide forecasts a $40 trillion construction shortfall by 2040 if productivity and workforce trends do not improve. Demand for net-zero and infrastructure exceeds supply by ~20%, creating major output gaps.
construction gap, net-zero, demand vs. supply, productivity, output gap
Mixed Chart
McKinsey
Saved
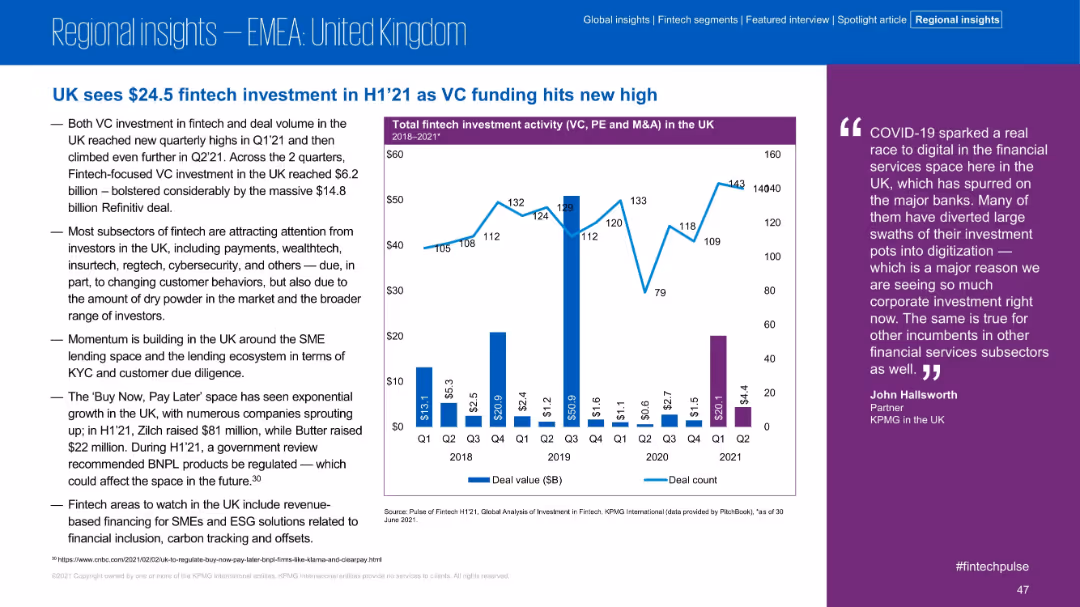
Left-aligned bullet points with right-side chart and quote; purple-accented chart shows total fintech investment in the UK from 2018 to 2021. Clean, professional layout.
Market Analysis and Trends
Financial Services
The slide highlights the UK's record fintech investment of $24.5B in H1 2021. VC activity and deal volume hit new highs due to large deals, especially the $14.8B Refinitiv transaction. Commentary includes insights on subsectors like insurtech and BNPL.
UK, VC, Fintech, H1 2021, BNPL, Insurtech, Refinitiv, Investment Volume, Trends
Mixed Chart
KPMG
Saved
The slide features a large section of text explaining the importance of AI maturity, accompanied by a column chart illustrating the projected time for AI transformation compared to digital transformation.
Market Analysis and Trends
Technology & Software
This slide emphasizes the critical role of AI in gaining competitive advantage, highlighting survey data on the importance of AI, and showing a projection of AI transformation timelines.
AI maturity, competitive advantage, transformation, digital transformation, survey data
Pillar
Accenture
Saved
Previous
Next
If nothing, comes up, please save your slides first
Create a FREE account to continue browsing
Receive Instant Access to 1,000+ slides from companies like McKinsey, Google, and Goldman Sachs
First Name
Last Name
Email
Password
I agree to all
Terms & Privacy Policy
Thank you! Your submission has been received!
Oops! Something went wrong while submitting the form.
Have an account?
Sign in
Column Chart
Heatmap
Chevron
Org Chart
Infographic
Callouts
Timeline
List
Graphic
Picture
Process Flow
Diagram
Paragraph
Map
Table
Framework
Subtitle
Takeaway Box
Icon
Other Chart
Radar Chart
Waterfall Chart
Mekko Chart
Pie Chart
Scatter Plot
Line Chart
Bar chart
Bullet points