My Account
My Slides
Search by Category
Companies
Slide Type
Use Case
Industry
Pricing
Templates
View All Templates
Download Template Slides
✦ AI
AI Prompt Library
AI Search
Feedback
Login
Logout
Get Started
Browse all Slides
Browse all Slides
Create a FREE Account
Instant access to 1,000+ real slides from top companies like McKinsey, BCG, Goldman Sachs, Google and many more!
First Name
Last Name
Email
Password
I agree to all
Terms & Privacy Policy
Thank you! Your submission has been received!
Oops! Something went wrong while submitting the form.
Have an account?
Sign in
Saved Slides
Two large blue panels with text and circular images depicting key areas of growth. Smaller images and bullet points elaborate on core strategies for enhancing digital capabilities.
Strategic Planning
Financial Services
Highlights strategic initiatives for business growth, focusing on digital enhancement and distribution optimization. These are aimed at maintaining a strong market position and driving future success.
Digital Capabilities, Partnerships, Growth
Table
Goldman Sachs
Saved
The slide features three column charts and line icons in a well-organized layout. Green highlights and infographics are used to emphasize key data points.
Industry Overview
Education & Training
This slide presents data on the impact of community hubs on English language improvement and confidence boosting for immigrants. It utilizes various data visualizations to show improvements in language skills and the consequential increase in employment and social satisfaction.
community hubs, language improvement, confidence, employment, social connections
Multiple Chart
Deloitte
Saved
Features a heat map-like graphic illustrating the varied impact of tech trends across sectors. The design is data-centric, color-coded for ease of interpretation.
Technology and Digital Transformation
Technology & Software
This data-rich slide compares the influence of various technology trends across multiple sectors, essential for industry analysis sessions where strategic decisions are based on tech trend impacts. It visually communicates where businesses should focus their technological advancements and R&D efforts.
Technology Trends, Impact, Heat Map, Sectors, Analysis, Data Visualization, R&D, Strategic Focus
Single Chart
McKinsey
Saved
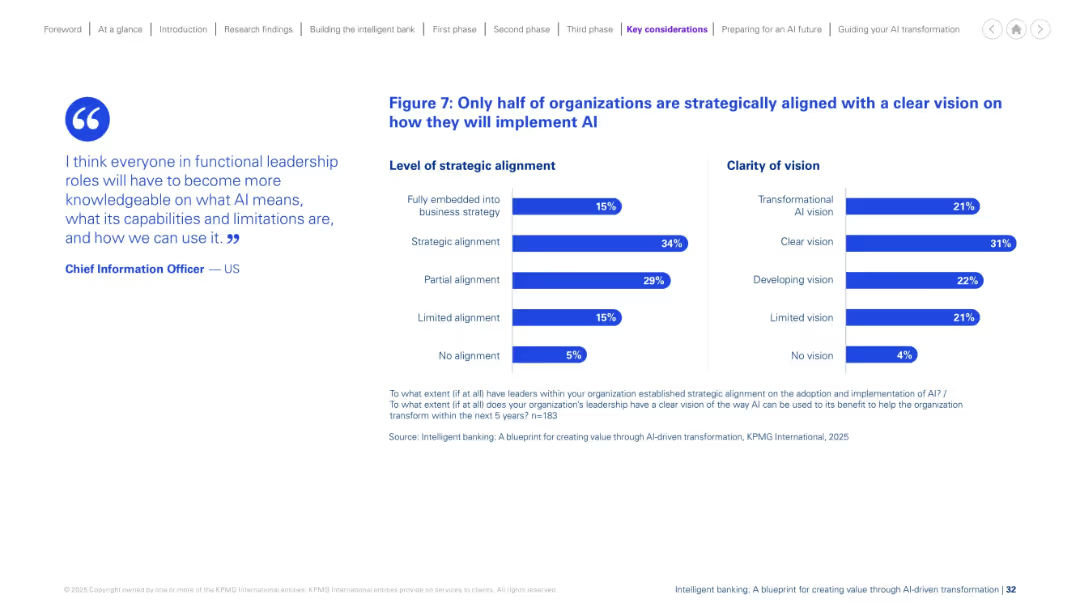
Split-layout slide with a quote on the left and two horizontal bar charts on the right, each showing survey percentages.
Strategic Planning
Financial Services
This slide presents findings on AI strategy alignment and vision clarity in organizations. Only 15% are fully embedded into strategy, and only 31% have a clear vision. It emphasizes gaps in strategic alignment and AI foresight.
AI implementation, strategic alignment, clarity, transformation, survey, statistics, business strategy, vision, leadership, organizational change
Mixed Chart
KPMG
Saved
Contains circular diagrams and a timeline, visually depicting the process and timing of adopting shared services. The design is clean and focused on displaying chronological data.
Strategic Planning
Professional Services
Discusses strategies and approaches to implementing shared services, focusing on timing and standardization processes. It can be used to guide strategic planning and risk management during the transition to shared services.
Shared services, implementation strategies, standardization, process timing, transition
Multiple Chart
Deloitte
Saved
The slide presents three scenarios (minimum, reference, and maximum scope) for hydrogen demand and related carbon impacts, using vertical column charts for each scope.
Strategic Planning
Energy & Utilities
The slide explores different scenarios for hydrogen demand by 2050, detailing the carbon impact and adjustments needed for each scope. It includes minimum, reference, and maximum scenarios, emphasizing the potential for reducing carbon emissions through hydrogen use.
hydrogen, scenarios, carbon impact, 2050, demand
Mixed Chart
Kearney
Saved
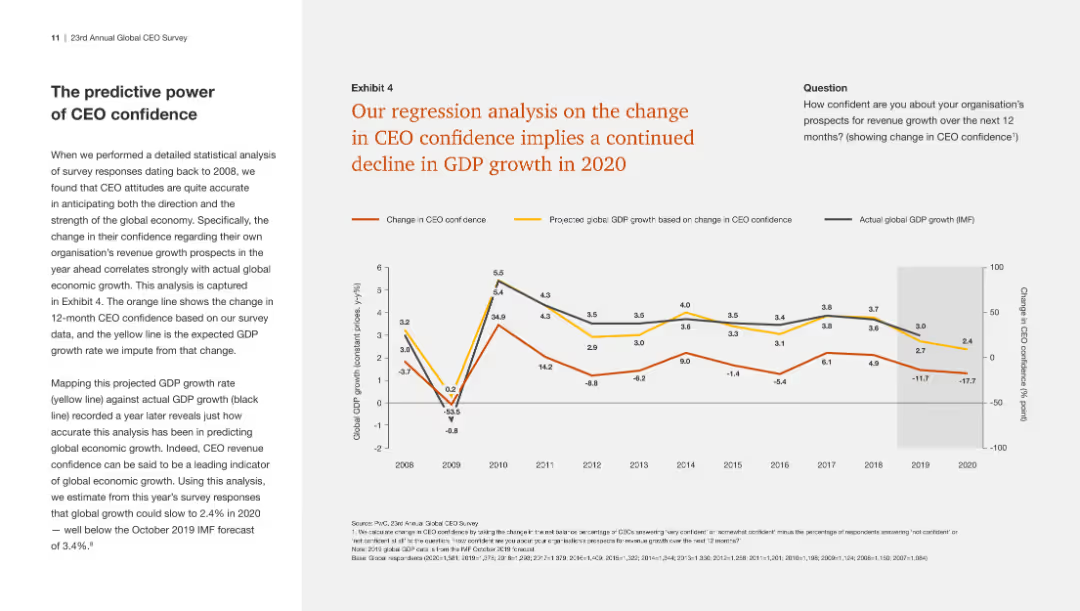
The slide has a line chart showing a regression analysis of CEO confidence and projected GDP growth, indicating a continued decline in GDP growth based on changing confidence.
Market Analysis and Trends
Financial Services
This slide presents a regression analysis showing a direct correlation between declining CEO confidence and projected GDP growth, predicting further economic downturn in 2020.
CEO confidence, GDP growth, regression analysis, economic projection
Mixed Chart
PwC/Strategy&
Saved
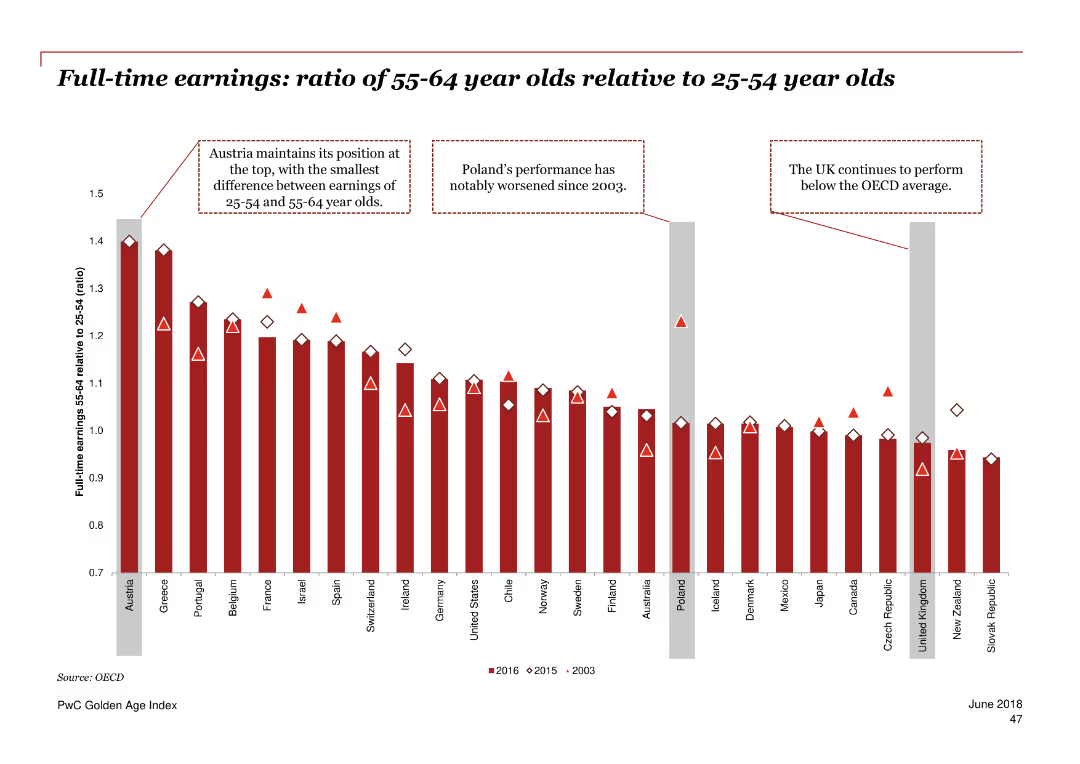
Column chart depicting the ratio of full-time earnings between 55-64 year olds and 25-54 year olds in various countries.
Financial Performance
Professional Services
The slide compares the full-time earnings of older adults to those of younger adults across different countries over three periods (2003, 2015, 2016).
earnings, ratio, age comparison, full-time, OECD, trend
Single Chart
PwC/Strategy&
Saved
Country-level bar chart ranked by agreement/disagreement. Title in bold, summary explanation on left, horizontal bars showing % agree/disagree on right.
Risk Assessment and Management
Government & Public Sector
This slide showcases global skepticism towards refugee legitimacy. The global average agreement is 61%, with Peru and Lithuania at the top (70%+ agreement) and Ethiopia and New Zealand at the bottom (~41%). Many people believe refugees are motivated by economic gain rather than genuine need.
refugee skepticism, economic migrants, public opinion, Ipsos, global survey, country rankings, welfare concern, immigration policy
Mixed Chart
IPSOS
Saved
This slide includes a column chart and textual data illustrating the strategy for on-balance sheet alternative investments.
Strategic Planning
Financial Services
Designed for strategic planning discussions, showcasing the firm’s approach to optimizing alternative investments on the balance sheet and their intended financial trajectory, with projections and capital allocation.
alternative investments, balance sheet, strategy, capital allocation
Single Chart
Goldman Sachs
Saved
Slide presents a bar chart visualizing how certain risks, like strategic and operational risks, are interconnected and have escalated the importance of other risks across various industries.
Risk Assessment and Management
Financial Services
Analyzes the interconnectedness of various risk types, showing strategic implications for risk management within organizations, especially in financial services.
risk interconnections, strategic implications, operational risks, financial services
Multiple Chart
Accenture
Saved
Features a bar chart showing changes in podcast advertising investments by buy type (annual, quarterly, remnant) from 2019 to 2020.
Market Analysis and Trends
Media & Entertainment
Discusses a trend shift in podcast advertising investments moving from annual to more flexible remnant buys, reflecting market agility.
podcast advertising, investment trends, annual buys, remnant buys, 2019-2020
Single Chart
PwC/Strategy&
Saved
Slide with a timeline graph, text, and color-coded phases representing pandemic response strategies.
Market Analysis and Trends
Government & Public Sector
Analyzes strategies for dealing with COVID-19's impact over time, including flattening the curve and economic recovery.
Pandemic Recovery, COVID-19, Flatten, Fight, Future, Economic Impact, Government Policy
Linear Flow
BCG
Saved
This slide features a comparative chart with ratings from Moody's, S&P, and Fitch for various financial institutions. Symbols indicate rating levels and outlooks.
Competitive Landscape
Financial Services
It compares credit ratings for UBS and its peers, providing a visual representation of ratings across different agencies as of September 2023.
credit ratings, peer comparison, Moody's, S&P, Fitch, UBS, financial, operating company, September 2023
Table
UBS
Saved
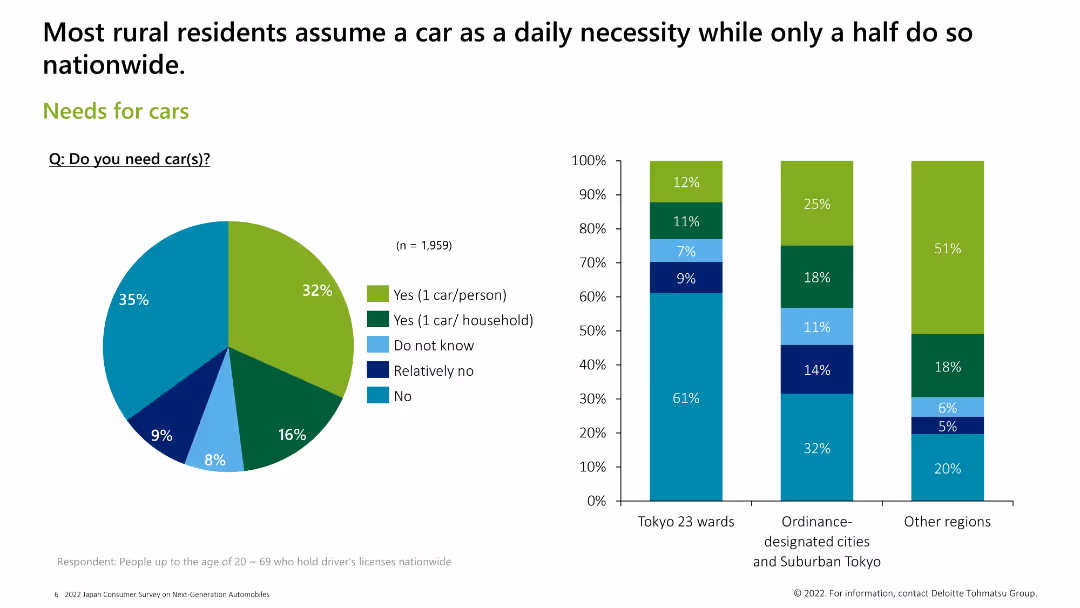
Includes a pie chart and three column charts to illustrate the need for cars across different regions and demographics.
Market Analysis and Trends
Consumer Goods
The slide discusses the necessity of cars among rural and urban residents, with data on how many cars they need and why.
car necessity, rural, urban, survey, demographics
Multiple Chart
Deloitte
Saved
The slide is dense with a timeline chart showing milestones in organic growth, acquisitions, and regional expansion from FY70 to FY19, and staff headcount noted for certain years.
Financial Performance
Financial Services
This slide depicts Macquarie's financial growth trajectory over decades, highlighting significant business expansions and staff growth. Useful for analyzing historical profitability and growth strategies.
growth, profitability, timeline, acquisitions, expansion, financial, history, business, strategy, staff
Single Chart
Goldman Sachs
Saved
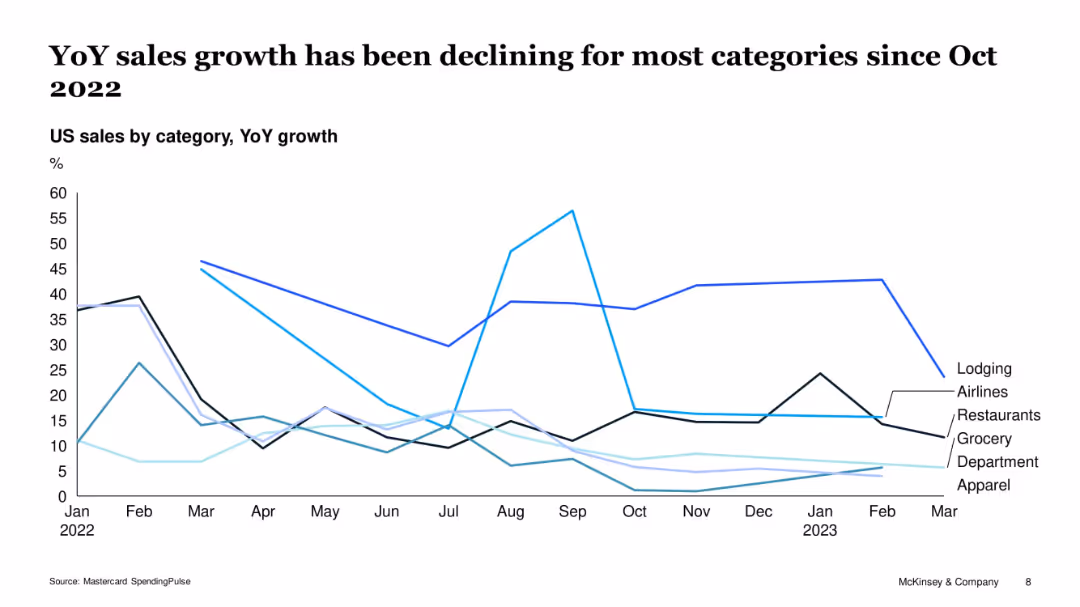
Multi-line chart tracking category-wise YoY sales growth (e.g., lodging, airlines, apparel)
Performance Metrics and KPIs
Retail & E-commerce
The chart illustrates the sharp drop in year-over-year sales growth across key consumer categories post-October 2022. Lodging and airlines initially saw large spikes but declined, while apparel and department stores experienced consistent underperformance, indicating broad retail headwinds.
sales growth, categories, apparel, restaurants, lodging, Mastercard, decline, YoY
Single Chart
McKinsey
Saved
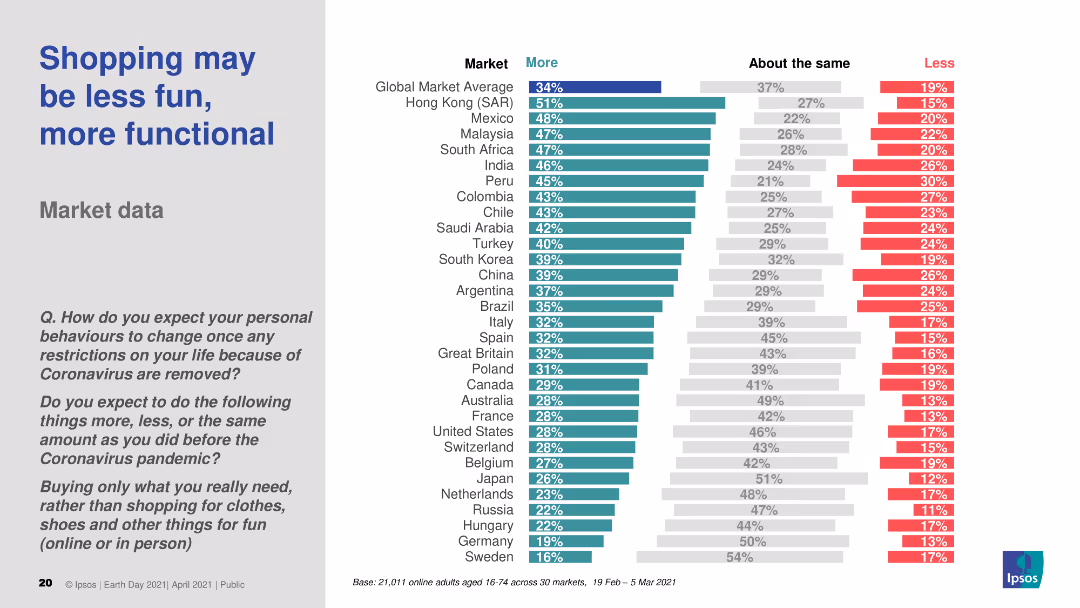
The slide features a column chart comparing the behavior changes in purchasing only essential items across various markets post-COVID-19. The chart uses three color bars to indicate "More," "About the same," and "Less." The text section includes a question and survey details.
Market Analysis and Trends
Retail & E-commerce
The slide presents survey data showing expected changes in personal buying behavior after COVID-19 restrictions are removed, focusing on purchasing essential items rather than non-essential items across multiple global markets.
COVID-19, shopping behavior, essential items, markets, global survey
Multiple Chart
IPSOS
Saved
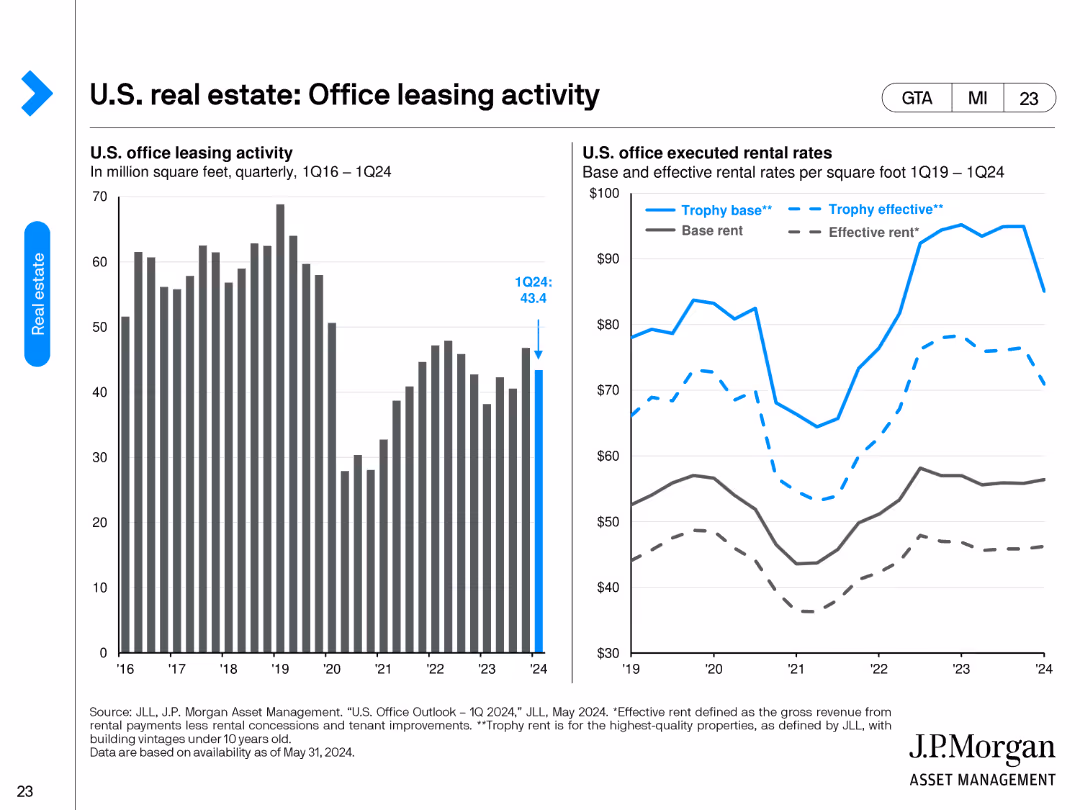
The slide contains two column charts. The left chart shows U.S. office leasing activity in million square feet from 1Q16 to 1Q24. The right chart compares base and effective rental rates per square foot from 1Q19 to 1Q24.
Market Analysis and Trends
Real Estate & Construction
This slide tracks U.S. office leasing activity and rental rates over time, providing insights into office space demand and rent dynamics. It's useful for understanding the office market's performance and trends in leasing and rental rates.
office leasing, rental rates, market performance, leasing activity, office space demand
Multiple Chart
JP Morgan
Saved
Contains a mixture of images and text, with highlighted numerical targets and progress indicators in bold fonts, set against a background image of solar panels, which implies a green investment focus.
Corporate Finance and Valuation
Financial Services
Highlights a financial firm’s goals and progress in sustainable and inclusive economic practices, ideal for investor relations or sustainability reporting.
Sustainable Development, Green Goals, Community, Racial Equity, Investment
Mixed Chart
JP Morgan
Saved
This slide presents a forward-looking column chart forecasting the growth of the personal luxury goods market from 2018 to 2025, highlighting potential market drivers.
Market Analysis and Trends
Consumer Goods
Forecasts the growth of the personal luxury goods market, discussing underlying economic fundamentals and potential challenges. Useful for long-term strategic planning.
market forecast, luxury goods, economic fundamentals, growth potential, strategic planning
Mixed Chart
Bain
Saved
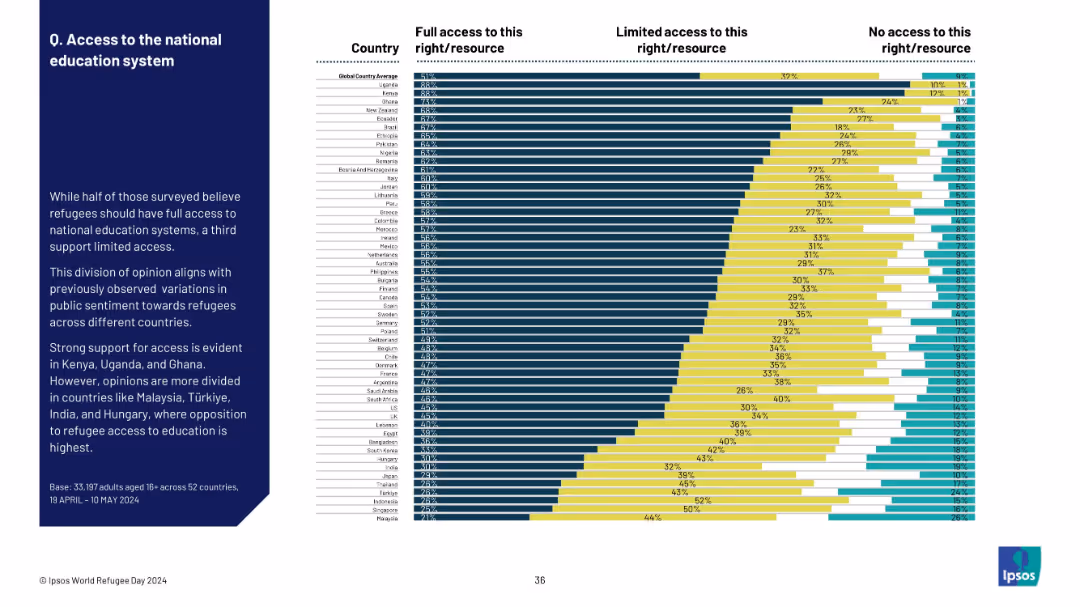
Ranked bar chart by country showing levels of support for refugee education access; detailed segmentation.
Regulatory and Compliance
Government & Public Sector
The slide shows that most countries support some level of refugee access to national education systems. Uganda and Kenya show the strongest support, while Türkiye, India, and Hungary show the most opposition.
refugees, education access, national systems, public opinion, support levels, global comparison, sentiment
Mixed Chart
IPSOS
Saved
Simple design with a title and subtitle, vibrant blue background with abstract shapes, and the logos of the collaborating companies.
Market Analysis and Trends
Technology & Software
Introduces the 'e-Conomy SEA 2021' report, indicating a focus on the digital economy of Southeast Asia during the 2020s.
e-Conomy, SEA, digital decade, market overview, technology, 2021, collaboration
Title
Bain
Saved
The slide presents a table with credit loss expenses and a column chart showing ECL coverage ratios. It uses a structured layout with clear data segmentation.
Financial Performance
Financial Services
It details credit loss expenses and impaired exposures, providing figures by business segment and the evolution of ECL coverage ratios over time.
credit loss, expenses, impaired, ECL, ratios, exposures, UBS, 2Q23, financial, release
Mixed Chart
UBS
Saved
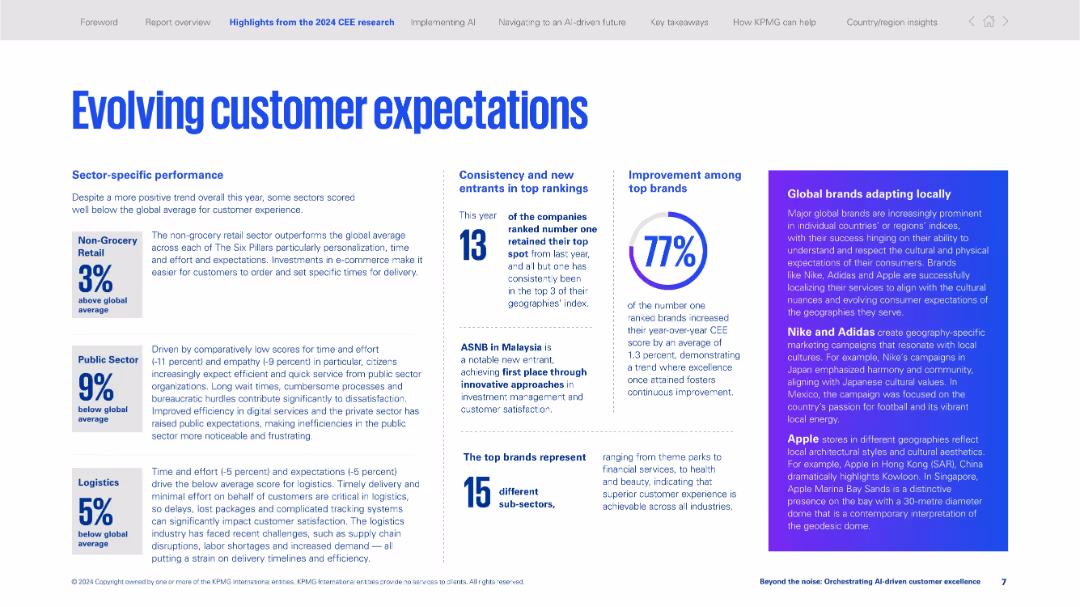
Grid-style layout with data points, stats, and textual commentary about customer experience trends by sector.
Market Analysis and Trends
Professional Services
Analyzes customer experience across sectors such as retail, public, and logistics. Discusses emerging consumer expectations and brand localization strategies. Provides CEE performance benchmarks and brand highlights.
customer experience, sector trends, logistics, retail, public sector, localization, brand strategy, global brands, expectations
Mixed Chart
KPMG
Saved
Previous
Next
If nothing, comes up, please save your slides first
Create a FREE account to continue browsing
Receive Instant Access to 1,000+ slides from companies like McKinsey, Google, and Goldman Sachs
First Name
Last Name
Email
Password
I agree to all
Terms & Privacy Policy
Thank you! Your submission has been received!
Oops! Something went wrong while submitting the form.
Have an account?
Sign in
Column Chart
Heatmap
Chevron
Org Chart
Infographic
Callouts
Timeline
List
Graphic
Picture
Process Flow
Diagram
Paragraph
Map
Table
Framework
Subtitle
Takeaway Box
Icon
Other Chart
Radar Chart
Waterfall Chart
Mekko Chart
Pie Chart
Scatter Plot
Line Chart
Bar chart
Bullet points