My Account
My Slides
Search by Category
Companies
Slide Type
Use Case
Industry
Pricing
Templates
View All Templates
Download Template Slides
✦ AI
AI Prompt Library
AI Search
Feedback
Login
Logout
Get Started
Browse all Slides
Browse all Slides
Create a FREE Account
Instant access to 1,000+ real slides from top companies like McKinsey, BCG, Goldman Sachs, Google and many more!
First Name
Last Name
Email
Password
I agree to all
Terms & Privacy Policy
Thank you! Your submission has been received!
Oops! Something went wrong while submitting the form.
Have an account?
Sign in
Saved Slides
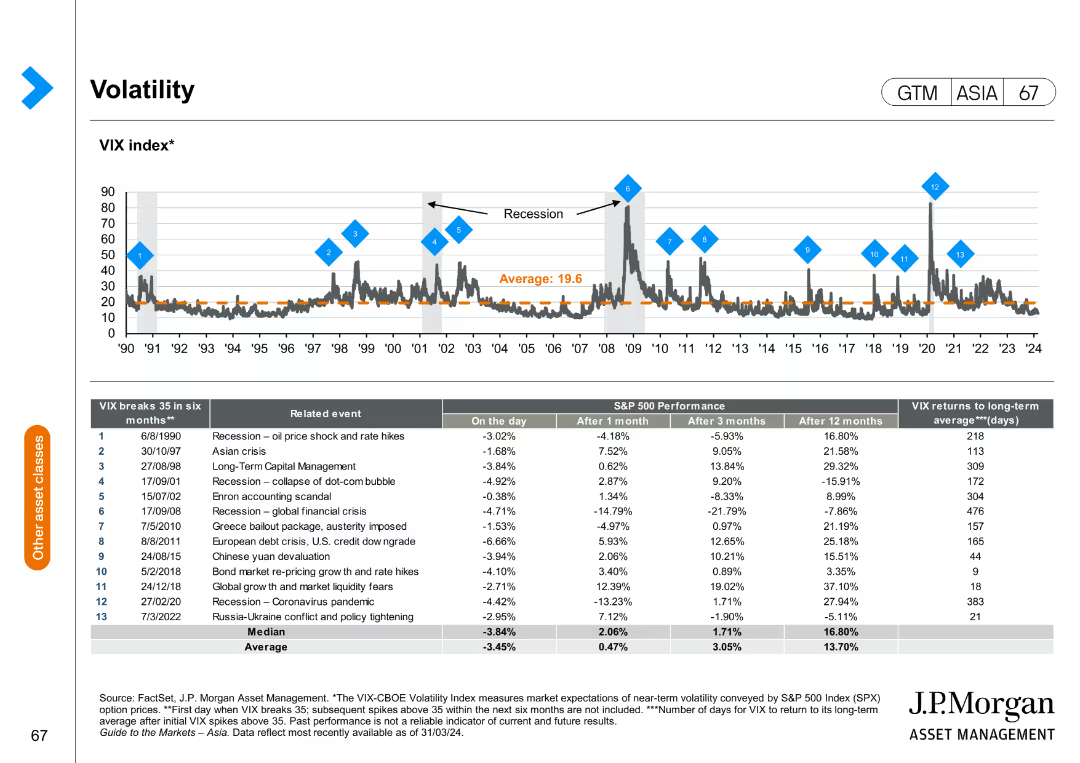
The slide presents a line chart of the VIX index over time with annotations for significant events and a table detailing VIX breaks.
Risk Assessment and Management
Financial Services
The slide provides an overview of market volatility, represented by the VIX index, and details significant events that caused volatility spikes.
VIX index, market volatility, significant events, risk management, financial analysis
Mixed Chart
JP Morgan
Saved
The slide is organized into sections detailing fuel cell R&D funding, key improvement levers, areas improved, and benefits/challenges. Includes a bar chart on R&D funding breakdown.
Risk Assessment and Management
Energy & Utilities
Discusses the challenges in fuel cell technology related to cost and durability, and outlines key improvement areas with corresponding benefits and challenges.
Fuel cells, cost reduction, durability, performance, challenges, R&D funding, improvement levers, benefits
Mixed Chart
Kearney
Saved
Horizontal bar chart showing the belief in science versus the desire for control over health decisions by age groups.
Market Analysis and Trends
Healthcare & Pharmaceuticals
The slide presents data on people's belief in science and their desire to retain control over health decisions.
science, health control, age differences, healthcare, public opinion
Multiple Chart
IPSOS
Saved
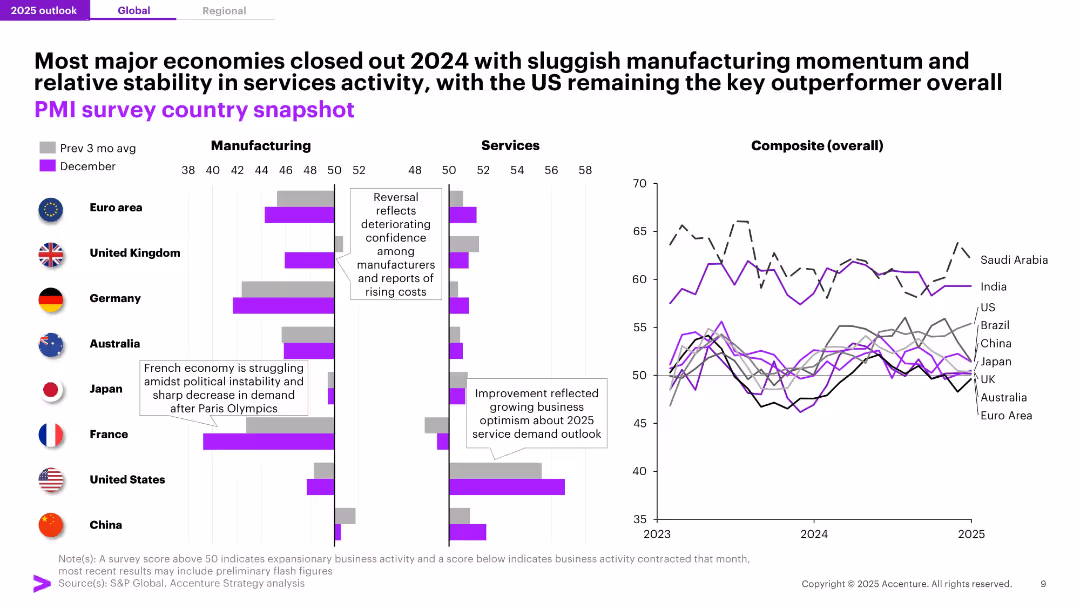
Three-column comparison of PMI indicators for manufacturing, services, and overall composite across countries; line and bar charts are used with national flags as icons. Uses purple as highlight color.
Industry Overview
Financial Services
This slide presents a snapshot of global PMI data by region and sector, showing sluggish manufacturing but more stable services activity. The U.S. stands out as an outperformer, while Europe and Asia display weakness. Includes composite economic trend lines through 2023–2025.
PMI, Manufacturing, Services, US, Eurozone, Economic Trends, Composite Index, 2024, Snapshot, Growth Outlook
Multiple Chart
Accenture
Saved
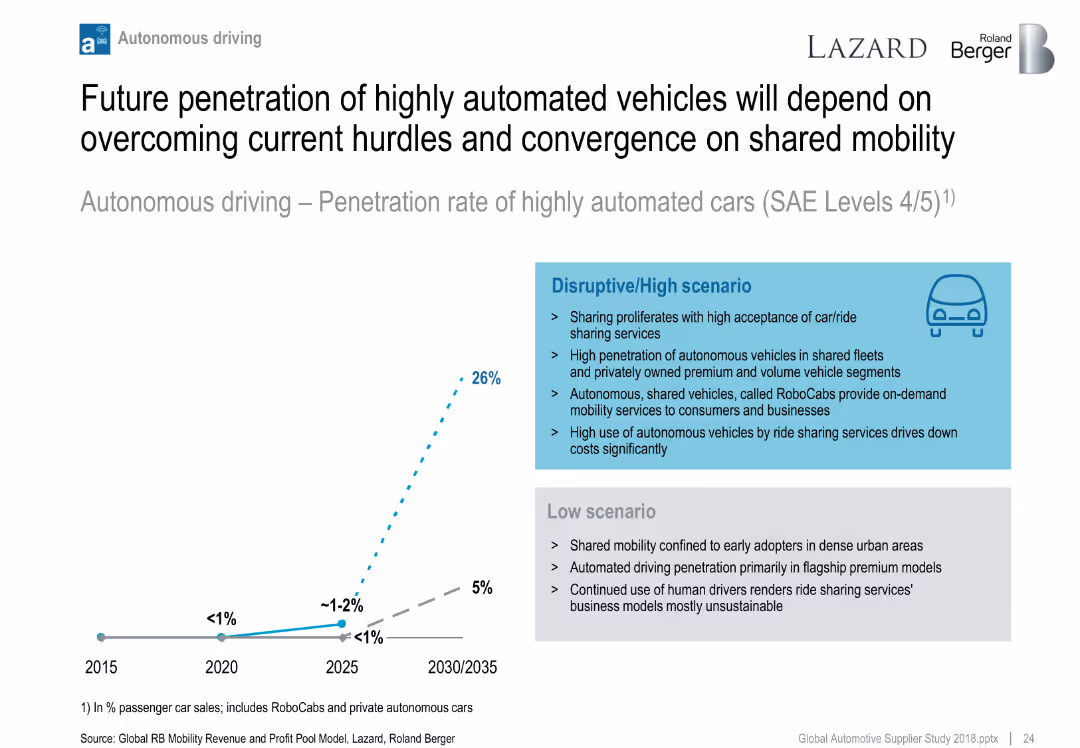
Line chart showing two scenarios for autonomous vehicle penetration (low vs. high); side text compares scenario assumptions.
Technology and Digital Transformation
Industrial & Manufacturing
Projects adoption of highly automated vehicles (SAE Level 4/5) under different market scenarios. Highlights role of shared mobility, ride-hailing, and RoboCabs in accelerating adoption under a disruptive path.
autonomous driving, RoboCabs, mobility, adoption forecast, automation scenarios
Mixed Chart
Roland Berger
Saved
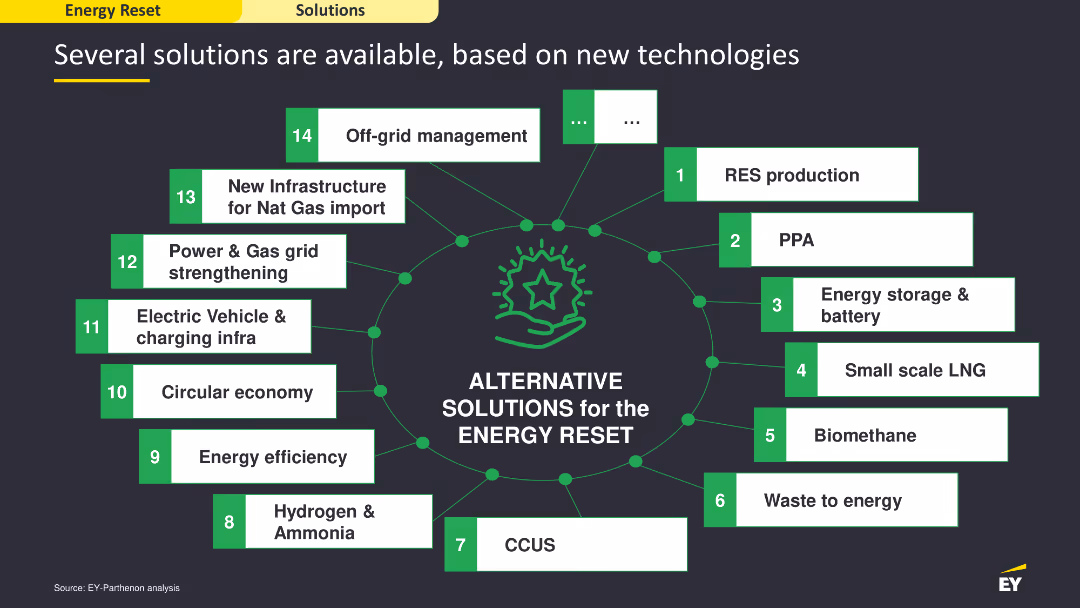
This slide features a central diagram with multiple connected nodes, each representing a different solution for energy reset. It uses green and white colors, with icons and text to illustrate each solution. The layout is moderately complex, focusing on the various technological solutions available.
Technology and Digital Transformation
Energy & Utilities
The slide showcases various technological solutions for the energy reset, highlighting options like RES production, PPA, energy storage, and more. It emphasizes the availability of multiple solutions to address energy challenges, providing a comprehensive overview of the technological landscape for energy transformation.
energy solutions, technology, digital transformation
Diagram
EY
Saved
The slide presents a comparative analysis of monthly passenger vehicle sales year-over-year for several countries (US, Germany, Italy, Sweden, China, South Korea, Japan). Each country has a bar graph with monthly data from January to July, with bars colored to indicate the percentage change compared to the previous year. The design is straightforward, with clear labels and a color-coded system that helps in quickly identifying trends and deviations in vehicle sales.
Market Analysis and Trends
Transportation & Logistics
This slide is useful for analyzing trends in the automotive sector, particularly how different regions are recovering from economic impacts of COVID-19 on vehicle sales. It allows stakeholders to compare market dynamics and consumer confidence across various countries, aiding in strategic planning for production adjustments, marketing strategies, and inventory management. The clear month-by-month breakdown helps in understanding the timing and effectiveness of economic recovery measures and consumer sentiment towards vehicle purchases.
vehicle sales, COVID-19, market analysis, economic recovery, automotive sector, consumer confidence, strategic planning
Multiple Chart
BCG
Saved
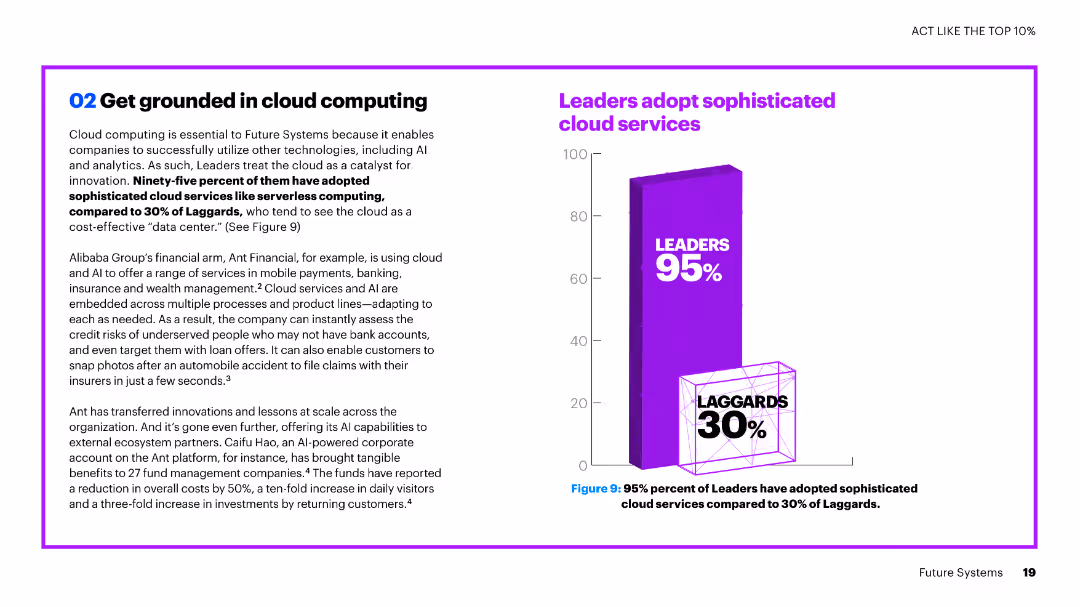
The slide features a combination of text and a vertical column chart. The chart shows a comparison of leaders and laggards in adopting sophisticated cloud services.
Technology and Digital Transformation
Technology & Software
The slide explains the importance of cloud computing in leveraging advanced technologies like AI and analytics, highlighting the adoption rates of sophisticated cloud services among leaders versus laggards.
cloud computing, AI, analytics, adoption, leaders, laggards, services, comparison, technology
Mixed Chart
Accenture
Saved
The slide includes horizontal bar charts showing top sectors by investment value and number of deals for recent months, with color coding for different time periods.
Market Analysis and Trends
Financial Services
This slide analyzes private equity and venture capital investments by sector, comparing the top sectors by investment value and the number of deals over recent months, aimed at identifying sector trends and performance.
PE/VC, Investments, Sectors, Value, Deals, Trends, Bar Chart
Multiple Chart
EY
Saved
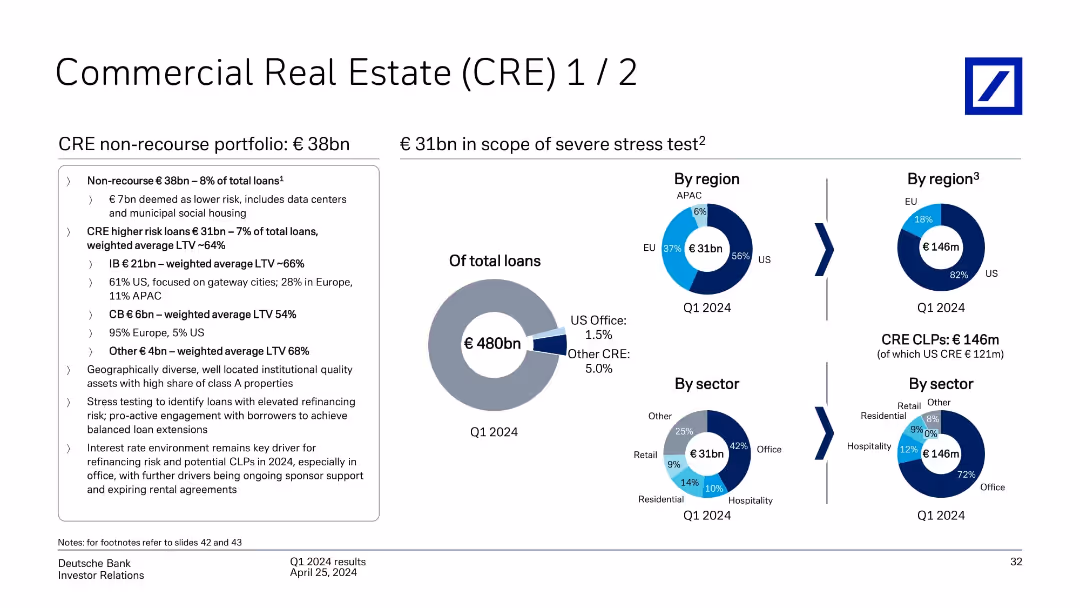
Multiple pie charts showing CRE exposure by region and sector, including stress test coverage; supported by bullet-point analysis and totals.
Risk Assessment and Management
Financial Services
Provides an overview of Deutsche Bank’s €38bn non-recourse CRE exposure and €31bn in scope for stress testing. Highlights include U.S. office concentration, LTV averages, and sector/region breakdowns. Emphasizes refinancing risks and ongoing risk mitigation strategies in a rising rate environment.
commercial real estate, CRE exposure, non-recourse, stress testing, refinancing risk, LTV, Deutsche Bank
Mixed Chart
Deutsche Bank
Saved
Contains column charts comparing trading volumes and costs across different stock exchanges, highlighting advantages for Brazilian companies
Strategic Planning
Financial Services
Discusses why Brazilian companies prefer US stock exchanges, focusing on trading volume, investor profiles, and cost advantages
stock exchanges, Brazil, US, trading, costs
Mixed Chart
McKinsey
Saved
This slide includes a clear title and a combined column chart showing the growth of the internet economy, with a legend and CAGR indication. Colors differentiate between sectors such as e-commerce, online media, etc. The design is clean, making the data easy to interpret.
Market Analysis and Trends
Retail & E-commerce
The slide displays the e-commerce sector's dominant role in driving the market growth of the internet economy in SEA, with a projected continuation till 2025. It highlights the exponential growth in e-commerce, contrasted against other sectors like online media and travel, to underscore the surge in digital consumer behavior and its long-term market implications.
e-commerce, growth, internet economy, SEA, CAGR, market trends, digital consumer behavior
Single Chart
Bain
Saved
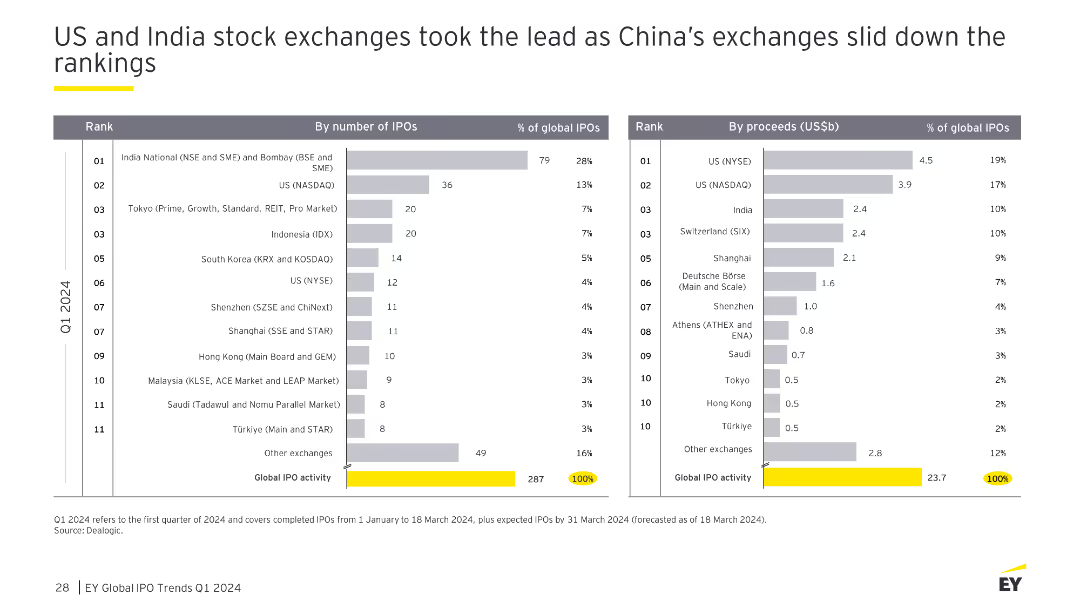
A slide with two comparative column charts showing the number and proceeds of IPOs by stock exchange in the first quarter of 2024. The visual complexity is moderate, focusing on comparative data across major exchanges.
Market Analysis and Trends
Financial Services
The slide analyzes the performance of global stock exchanges in the first quarter of 2024, noting the lead taken by US and India exchanges while China's exchanges experienced a decline. It provides comparative data on the number and proceeds of IPOs, highlighting the top-performing exchanges and their market shares.
IPO, US, India, China, Stock Exchanges, Rankings
Multiple Chart
EY
Saved
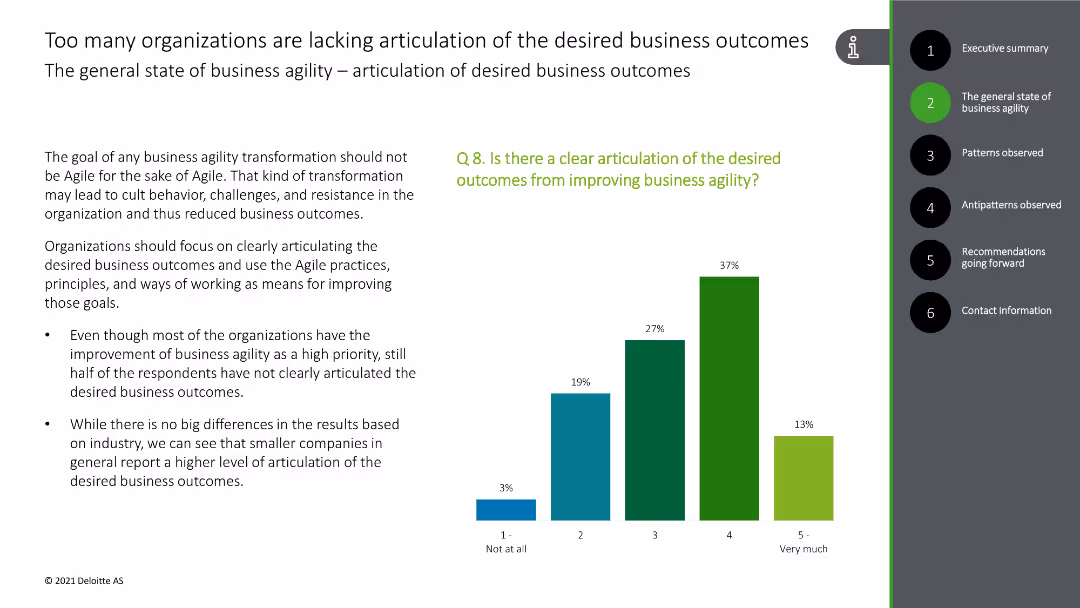
This slide presents a column chart showing levels of articulation of desired outcomes from improving business agility, with bars in green and blue shades.
Strategic Planning
Technology & Software
The slide addresses the need for clear articulation of business outcomes related to agility improvement, supported by survey results.
business agility, outcomes, clarity, articulation, survey data
Mixed Chart
Deloitte
Saved
Includes a timeline graphic and images of a smartphone displaying various consumer services, highlighting key phases of consumer financial engagement.
Strategic Planning
Financial Services
Outlines Serasa's strategy to provide a broad range of financial services to Brazilians, aimed at enhancing credit access and including digital solutions like e-wallets and financial education.
financial services, credit access, Serasa, digital solutions, Brazil
Mixed Chart
Barclays
Saved
The slide includes bar charts comparing on-farm storage costs and capacity in Australia, Canada, and Ukraine, along with contextual notes.
Operational Efficiency
Agriculture & Food Production
The slide highlights Australia's limited on-farm storage capacity compared to Canada and Ukraine, discussing the cost advantages and market impacts of this limitation.
On-farm storage, Australia, Canada, Ukraine, storage costs, storage capacity, agriculture, food production, operational efficiency
Multiple Chart
LEK
Saved
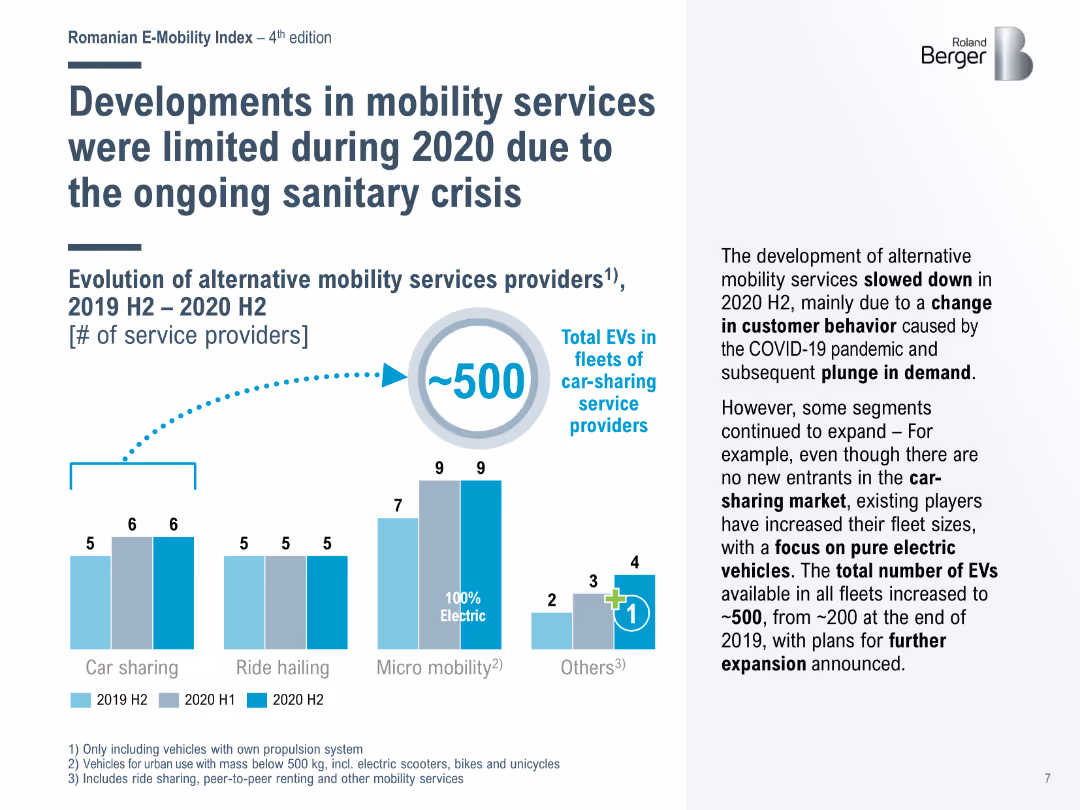
Bar chart showing the number of service providers for car sharing, ride hailing, and micro mobility from 2019 H2 to 2020 H2, highlighting the impact of COVID-19 on services.
Market Analysis and Trends
Transportation & Logistics
Discusses the limited growth in alternative mobility services during 2020 due to the pandemic, with car-sharing services increasing EV fleet sizes despite no new entrants.
mobility services, COVID-19, car sharing, ride hailing, micro mobility
Mixed Chart
Roland Berger
Saved
The slide presents a column chart showing the number of employees involved in using/building DCRs, with categories ranging from none to 11+ employees, along with a quote from a C-suite executive.
Technology and Digital Transformation
Technology & Software
The slide emphasizes the need for significant human talent to manage and operate data clean rooms (DCRs), highlighting the various roles and expertise required for effective implementation.
DCR investment, human talent, privacy, data engineers
Mixed Chart
IPSOS
Saved
Slide features a clear diagram categorizing various EdTech solutions along the teaching and learning journey, with a side panel listing target audiences. It utilizes blue and grey for text and background contrast.
Industry Overview
Education & Training
This slide maps the ecosystem of EdTech startups in Southeast Asia, displaying a range of solutions and the respective educational segments they serve, from K-12 to corporate training.
EdTech, Ecosystem, Startups, SEA, Solutions, Education, Learning Journey, K-12, Corporate Training, Segmentation
Table
Bain
Saved
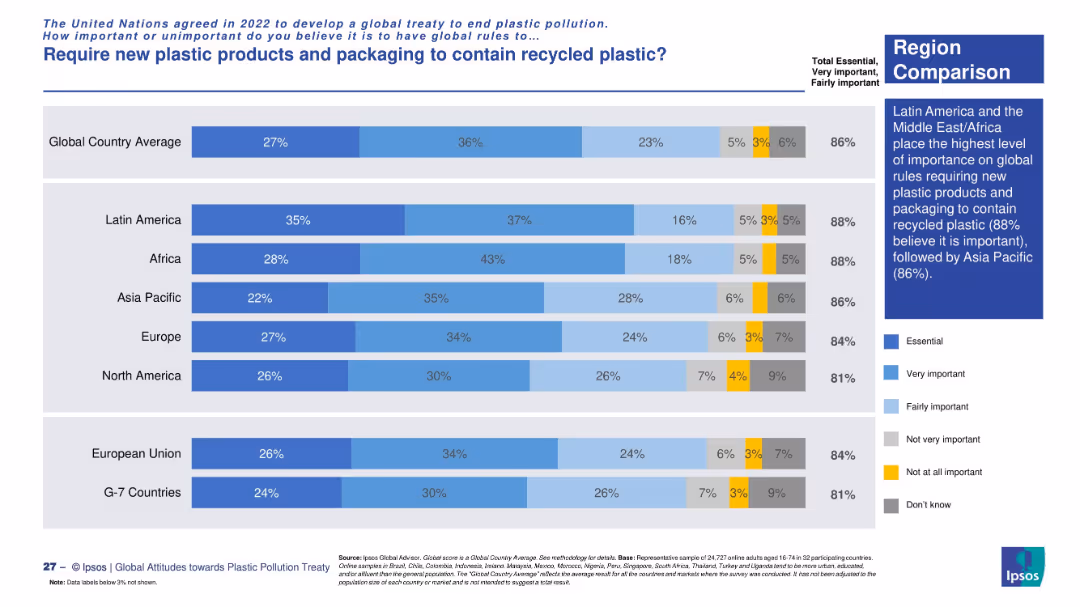
Horizontal stacked bar chart comparing regions. Shades of blue, yellow, and gray represent levels of importance and uncertainty. Side panel emphasizes regional support levels.
Market Analysis and Trends
Environmental Services & Sustainability
This slide shows how different regions value global rules on including recycled plastic in packaging. Latin America and Africa have the highest support (88%), with the Asia Pacific region closely behind. The chart aggregates survey responses into five importance levels.
recycled plastic, sustainability, regional views, plastic regulation, global rules, survey data, Ipsos, Latin America, Africa, Asia Pacific
Mixed Chart
IPSOS
Saved
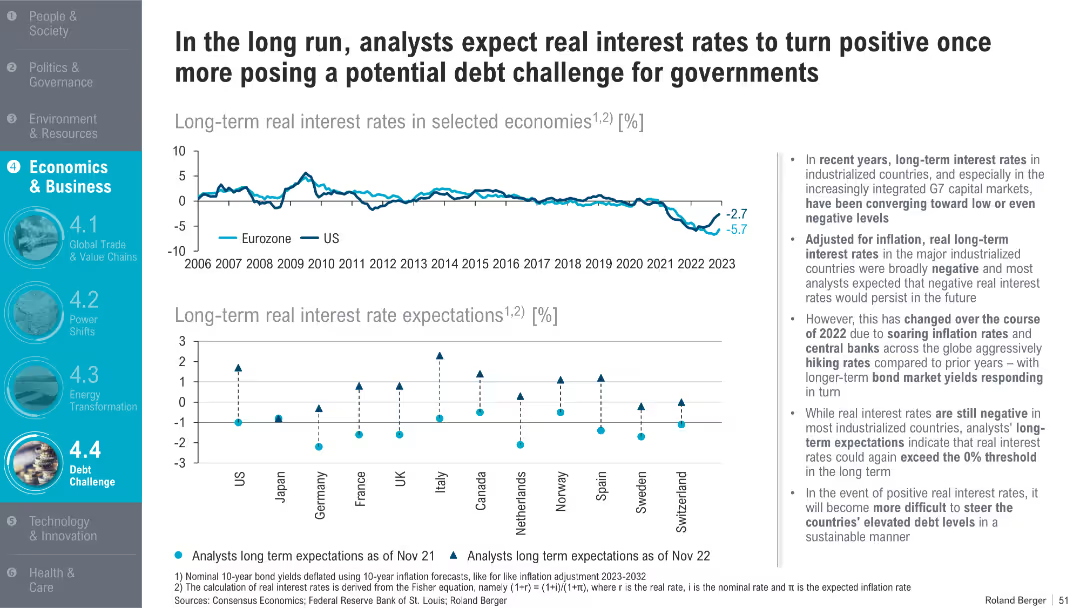
Two-part chart: top shows long-term real interest rates for Eurozone & US; bottom visualizes expectations for major economies; right panel provides analysis
Financial Performance
Government & Public Sector
This slide outlines the shift in real interest rate expectations following inflationary pressures and central bank interventions in 2022. It discusses the implications for managing public debt under higher real rates.
real interest rates, inflation, central banks, public debt, monetary policy, forecasts, G7, long-term yields
Multiple Chart
Roland Berger
Saved
The slide shows a bar chart on the right side and an illustration of a man with a briefcase on the left, set against a gradient background. The design is modern with clean lines and simple icons.
Market Analysis and Trends
Professional Services
It reflects on the eagerness of different generations to return to normalcy post-pandemic, focusing on activities such as dining out and travel. This slide is ideal for discussing market shifts and consumer behavior in a post-pandemic economy.
post-pandemic, consumer behavior, millennials, Gen Z, market trends, dining out, work preferences, travel
Mixed Chart
Deloitte
Saved
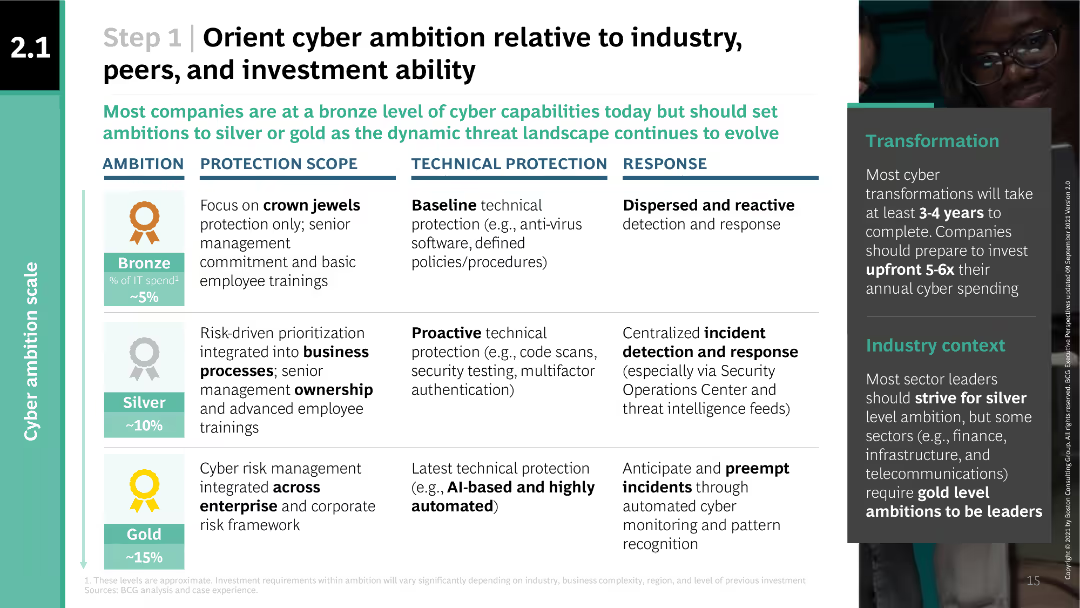
The slide features a table outlining different levels of cyber ambition (bronze, silver, gold) and their corresponding protection scope, technical protection, and response measures.
Strategic Planning
Professional Services
This slide helps organizations align their cyber ambition with industry standards, peer benchmarks, and investment capabilities. It provides detailed descriptions of bronze, silver, and gold levels of cyber ambition and their respective cybersecurity measures.
cyber ambition, industry standards, investment, protection scope, technical protection, response measures, BCG
Table
BCG
Saved
The slide features three comparison bar charts with accompanying annotations for sales data over two periods, 9M 23 and 9M 22. Design elements include shaded backgrounds for chart areas and color-coded bars for easy differentiation. There is a title at the top, and each bar chart has a label and a brief explanatory note on the right, which analyzes the change in sales and volume. The company logo is at the bottom.
Market Analysis and Trends
Industrial & Manufacturing
The content details the performance of different segments within the automotive and specialties sectors, including sales growth, volume changes, and market analysis. This slide is useful for discussing segment-specific strategies and performance in the automotive industry.
automotive, specialties, sales, performance, market analysis, growth, volume change, sector, strategy
Table
Morgan Stanley
Saved
Light background with yellow title banner, text-heavy content, and a pie chart and line chart showing IPO pipeline and withdrawal trends.
Market Analysis and Trends
Financial Services
The slide highlights the increasing IPO backlogs and deal withdrawals, particularly in China. It includes a pie chart showing the IPO pipeline breakdown by sector and a line chart tracking postponed and withdrawn IPOs as a percentage of total IPO volume from 2014 to 2023.
IPO backlogs, growth sectors, China, 2023, financial trends
Multiple Chart
EY
Saved
Previous
Next
If nothing, comes up, please save your slides first
Create a FREE account to continue browsing
Receive Instant Access to 1,000+ slides from companies like McKinsey, Google, and Goldman Sachs
First Name
Last Name
Email
Password
I agree to all
Terms & Privacy Policy
Thank you! Your submission has been received!
Oops! Something went wrong while submitting the form.
Have an account?
Sign in
Column Chart
Heatmap
Chevron
Org Chart
Infographic
Callouts
Timeline
List
Graphic
Picture
Process Flow
Diagram
Paragraph
Map
Table
Framework
Subtitle
Takeaway Box
Icon
Other Chart
Radar Chart
Waterfall Chart
Mekko Chart
Pie Chart
Scatter Plot
Line Chart
Bar chart
Bullet points