My Account
My Slides
Search by Category
Companies
Slide Type
Use Case
Industry
Pricing
Templates
View All Templates
Download Template Slides
✦ AI
AI Prompt Library
AI Search
Feedback
Login
Logout
Get Started
Browse all Slides
Browse all Slides
Create a FREE Account
Instant access to 1,000+ real slides from top companies like McKinsey, BCG, Goldman Sachs, Google and many more!
First Name
Last Name
Email
Password
I agree to all
Terms & Privacy Policy
Thank you! Your submission has been received!
Oops! Something went wrong while submitting the form.
Have an account?
Sign in
Saved Slides
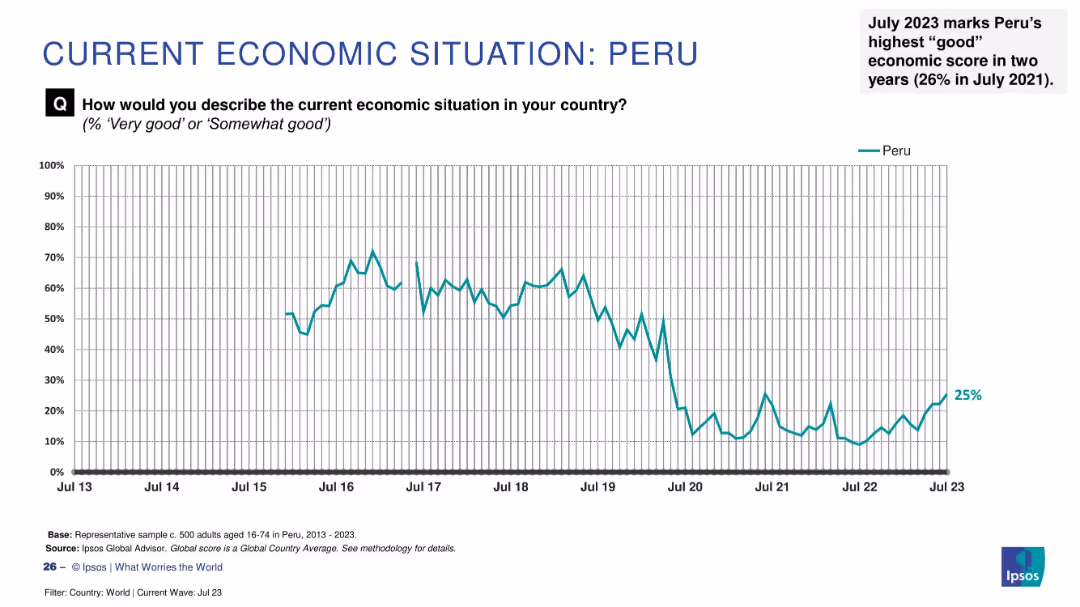
Line graph showing sentiment trend from 2013 to July 2023 with a recent rise to 25% and an annotation on 2-year high.
Market Analysis and Trends
Financial Services
Peru has reached its highest economic optimism in two years (25%) as of July 2023. This visual shows the overall downward trend followed by a modest recovery, emphasizing recent improvement.
Peru, economic sentiment, public perception, Ipsos data, 2023 trends, two-year high, economic outlook, Latin America, recovery
Single Chart
IPSOS
Saved
Two line charts are presented: one showing government debt as a percentage of GDP and the other illustrating government interest payments as a percentage of GDP for the US, Eurozone, and UK.
Risk Assessment and Management
Government & Public Sector
The slide examines government debt levels and interest payment trends, useful for assessing fiscal sustainability and debt risk in major economies.
Government debt, interest payments, fiscal sustainability, GDP, risk management
Multiple Chart
JP Morgan
Saved
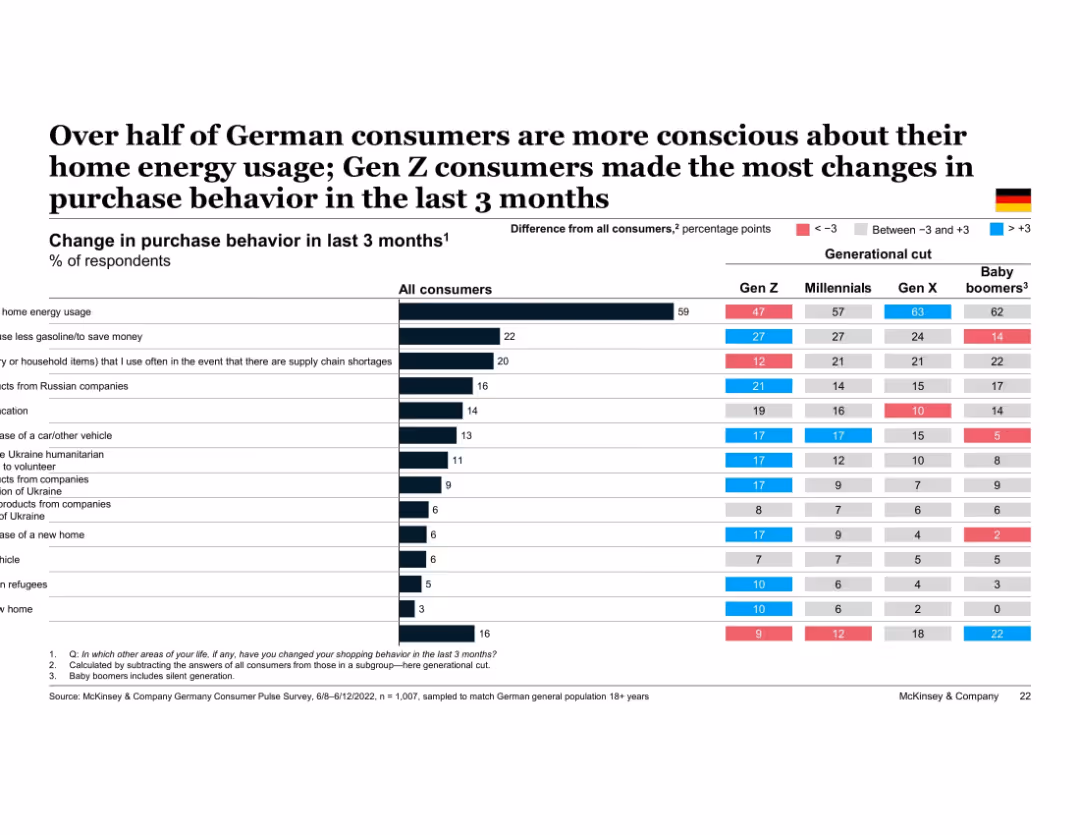
Table chart showing % of German consumers changing various behaviors, broken down by generation. Color coding indicates deviation from average. Most actions relate to energy savings, budgeting, or avoiding Russia-linked products.
Customer and Market Segmentation
Financial Services
This slide tracks behavioral adjustments made by German consumers in response to economic and geopolitical events. The most common change is reducing home energy use, particularly among Gen X and Baby Boomers. Gen Z shows the most widespread behavioral adaptation across categories.
behavioral change, energy savings, Germany, generational behavior, inflation response, geopolitical impact, Gen Z, purchase habits
Multiple Chart
McKinsey
Saved
The slide presents a bar chart with horizontal bars in orange, indicating percentages for different regions answering a question on data privacy. There's a large '64%' graphic and an explanatory text block on the left.
Market Analysis and Trends
Financial Services
The slide depicts global perspectives on whether governments are effectively designing data privacy regulations that balance trust and business competitiveness, with a focus on several countries.
Data Privacy, Regulations, CEOs, Trust, Competitiveness, Global, Government
Multiple Chart
PwC/Strategy&
Saved
The slide provides a geographical breakdown of growth rates in personal luxury goods for 2017, with specific details for regions such as China, Asia, Europe, and the Americas. It uses a mix of bar and column charts, color-coded in red and gray, to differentiate between the regions and their respective growth figures.
Market Analysis and Trends
Consumer Goods
Analyzes 2017 growth rates in the personal luxury goods market across different regions, highlighting China as the top performer with significant details on local consumer behavior and market changes. Also compares other regions to provide a comprehensive view of global trends.
luxury goods, regional analysis, growth rate, China, market analysis
Single Chart
Bain
Saved
This slide features a timeline layout with icons and percentage bars. It uses blues and grays to show progress on infrastructure updates and cloud adoption.
Operational Efficiency
Technology & Software
Highlights the ongoing modernization of payment processing platforms and the transition of internal applications to the cloud.
Infrastructure, cloud migration, modernization, processing platforms, timeline, cloud adoption, technology upgrades
Mixed Chart
JP Morgan
Saved
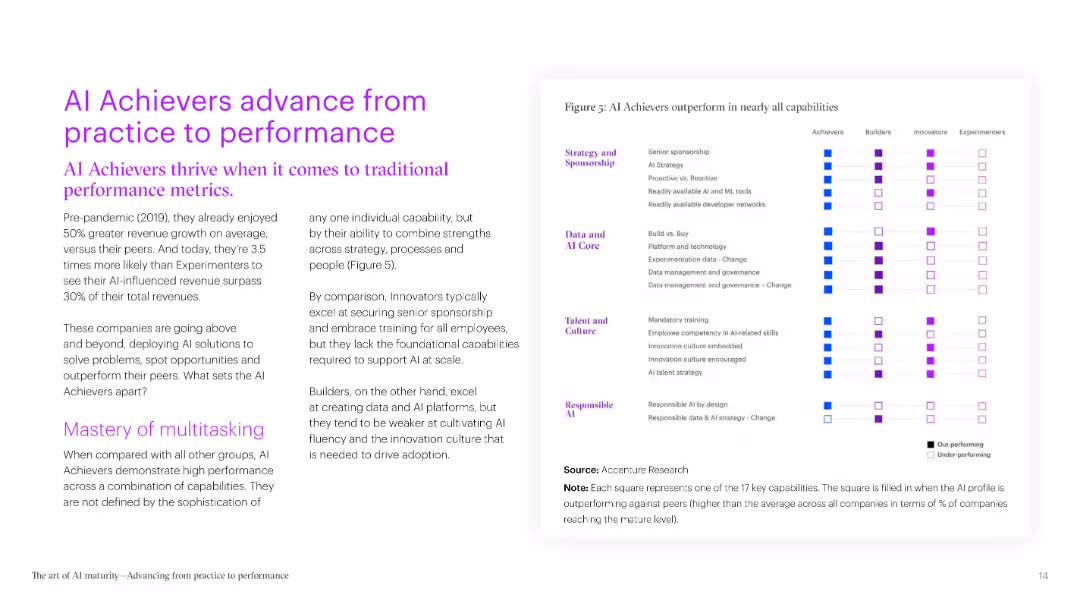
The slide includes a horizontal bar chart showing the stages of AI use in different functions. It features clear distinctions between Achievers and Experimenters, making the data easy to interpret.
Technology and Digital Transformation
Technology & Software
It discusses the transition of AI projects from pilot phases to full production, using Procter & Gamble as a case study. The slide highlights the effectiveness of scaling AI solutions across enterprises.
AI production, case study, scalability, implementation, pilot projects
Boxed
Accenture
Saved
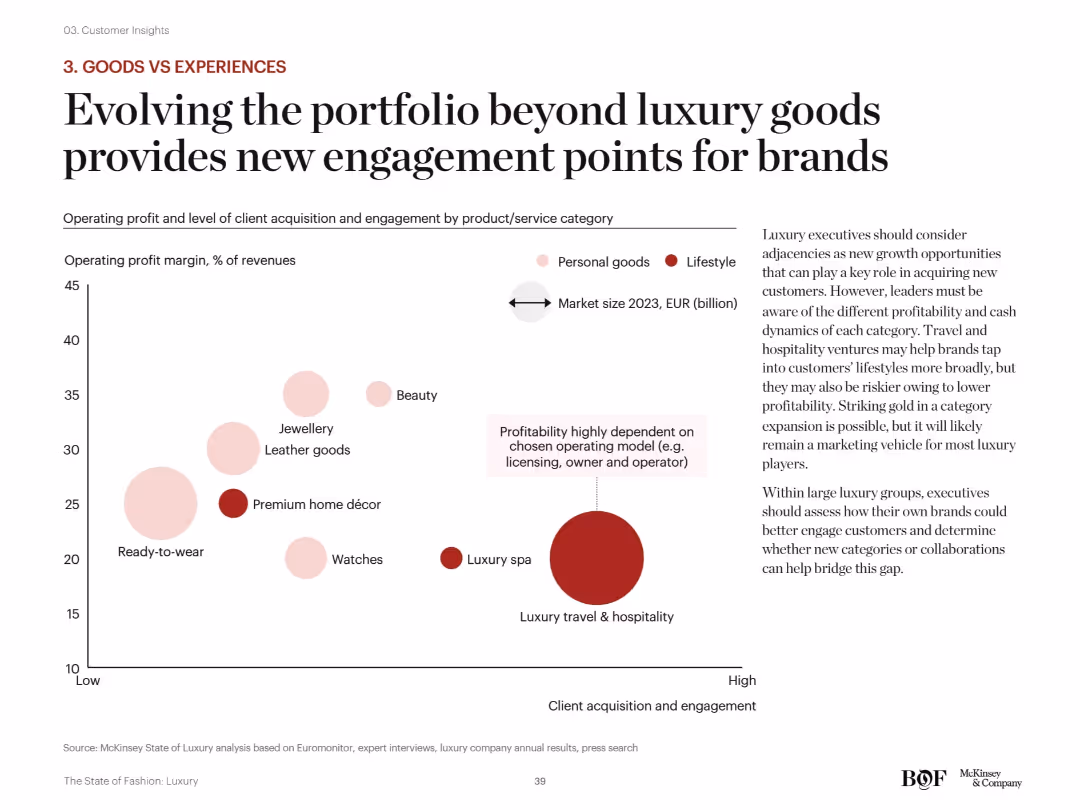
Scatterplot showing operating margin vs. customer engagement across product categories (beauty, spa, décor, etc.). Bubble sizes indicate market size. Pink/red bubbles differentiate lifestyle vs. personal goods.
Strategic Planning
Consumer Goods
This slide urges luxury brands to diversify into experiences (e.g., travel, spa) alongside products. Although some experiential categories have lower margins, they offer high customer engagement, making them useful for long-term strategic brand growth and loyalty.
diversification, category strategy, lifestyle goods, customer engagement, operating margin, growth opportunities
Mixed Chart
McKinsey
Saved
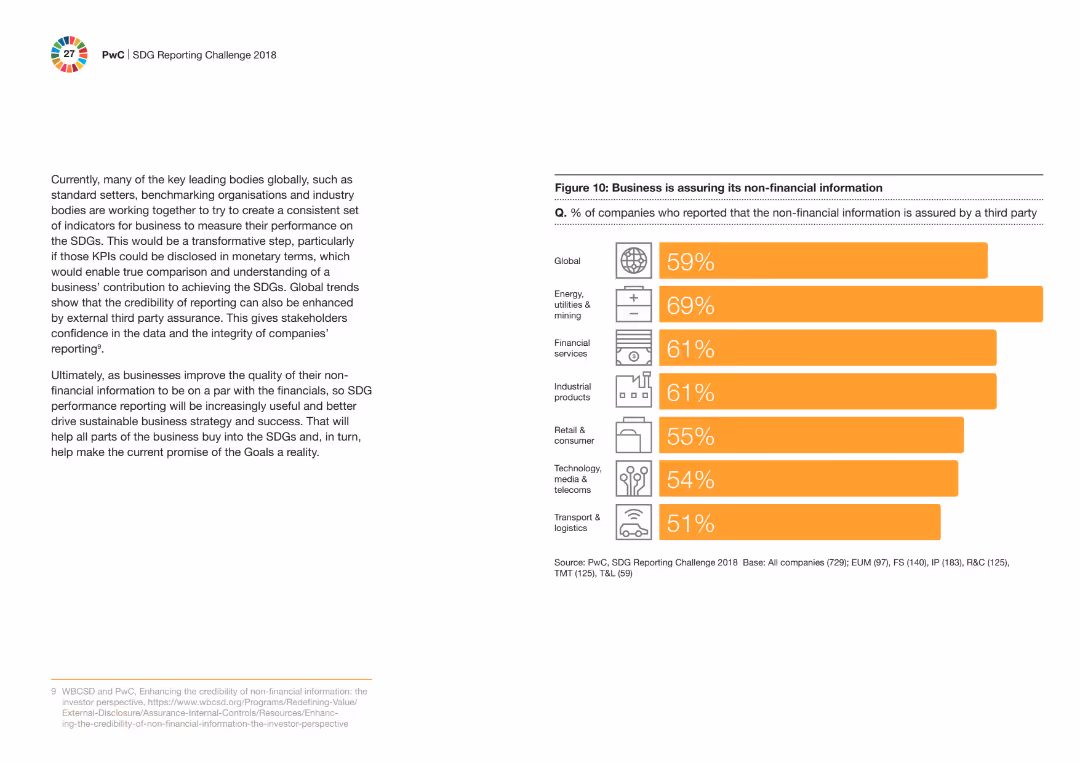
The slide shows a column chart with the percentage of companies ensuring their non-financial information is assured by a third party across different industries. Text explains the importance of non-financial information assurance.
Regulatory and Compliance
Financial Services
It highlights the percentage of companies across various industries that have their non-financial information assured by third parties, emphasizing the growing trend and its importance in achieving SDG goals.
non-financial information, assurance, third party, compliance, financial services, SDGs, column chart, industry percentages
Mixed Chart
PwC/Strategy&
Saved
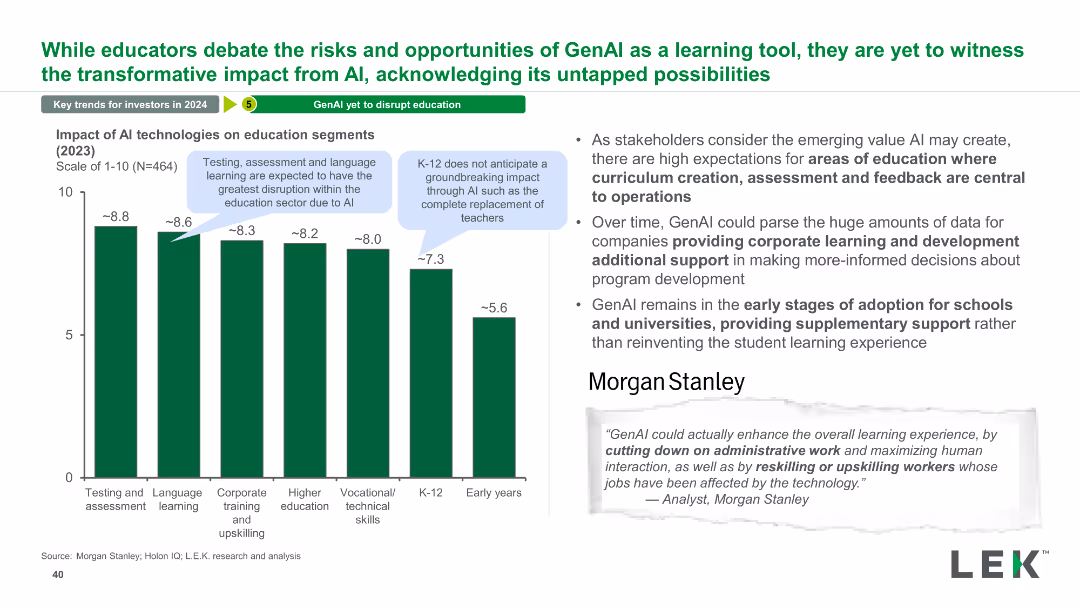
The slide has a column chart showing the impact of AI technologies on various education segments, with a narrative section explaining potential benefits and stakeholder expectations.
Technology and Digital Transformation
Education & Training
This slide explores the potential impact of AI on different segments of the education sector, highlighting areas like testing, assessment, and corporate training.
AI, Impact, Education, Segments, Technology, Testing, Assessment, Training, Benefits, Expectations
Mixed Chart
LEK
Saved
Multiple line charts display sovereign and corporate EMD spreads, along with local EMD yields. Each chart is color-coded for clarity.
Market Analysis and Trends
Financial Services
The slide provides an update on the emerging markets bond market, analyzing sovereign, corporate spreads, and local yields, presenting recent trends and averages.
Emerging Markets, Bond Market, EMD Spreads, Local Yields, Trends
Multiple Chart
Morgan Stanley
Saved
Graphs and statistics showing the growth in talent and capital investment in Web3.
Market Analysis and Trends
Technology & Software
Highlights the significant growth in the number of developers and capital investment in Web3 over recent years.
Web3 growth, talent increase, capital investment, market analysis
Multiple Chart
McKinsey
Saved
Slide features two column charts depicting revenue growth and market resiliency.
Market Analysis and Trends
Financial Services
Shows Equifax's revenue resilience and growth levers during economic fluctuations, emphasizing its strength in diverse market conditions.
Revenue, Resilience, Growth, Economy, Market
Multiple Chart
Barclays
Saved
Contains multiple bar graphs and a small text section comparing the effects of different treatments on COVID-19 patient outcomes, highlighting dexamethasone and remdesivir.
Product and Service Analysis
Healthcare & Pharmaceuticals
Evaluates the effectiveness of various treatments like dexamethasone and remdesivir on COVID-19, useful for medical professionals and health service planners.
COVID-19, treatment outcomes, dexamethasone, remdesivir, therapeutics, patient care
Multiple Chart
McKinsey
Saved
Contains a prioritization matrix with bubbles representing market potential, plotted against uncertainty and cost evolution from 2025 to 2035.
Strategic Planning
Energy & Utilities
Predicts the economic timeline for hydrogen applications in transport and industry, focusing on domestic and export markets.
hydrogen, breakeven, ammonia, FCEV, export, domestic, market
Mixed Chart
McKinsey
Saved
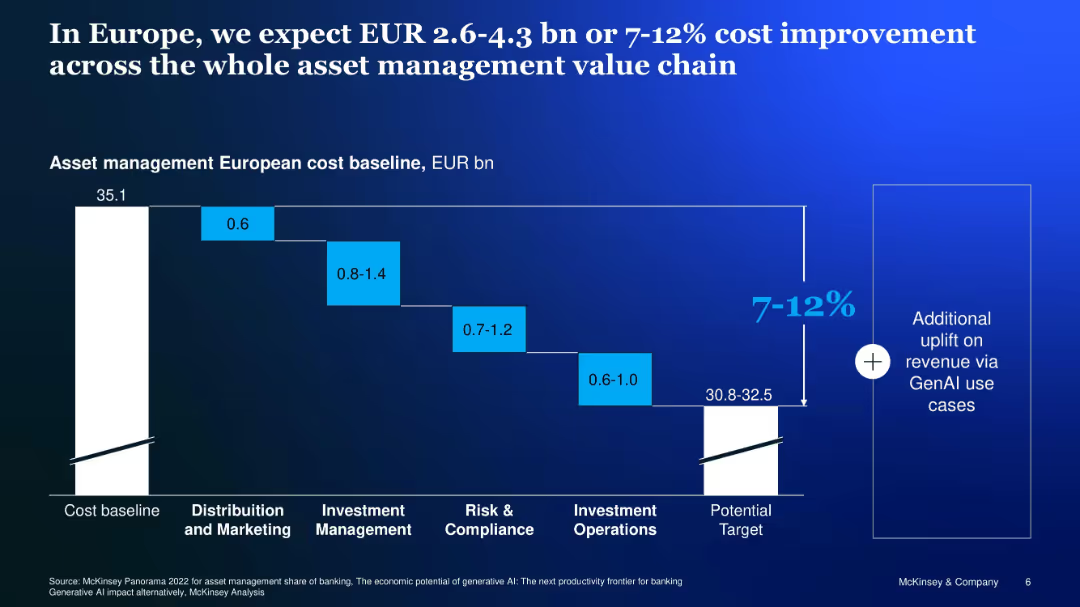
Waterfall chart showing potential GenAI-related cost reduction across asset management functions
Financial Performance
Financial Services
Analyzes cost-saving potential of GenAI across European asset management, estimating 7–12% savings from process efficiencies across marketing, investment, compliance, and operations.
Europe, cost savings, asset management, GenAI, waterfall, value chain
Single Chart
McKinsey
Saved
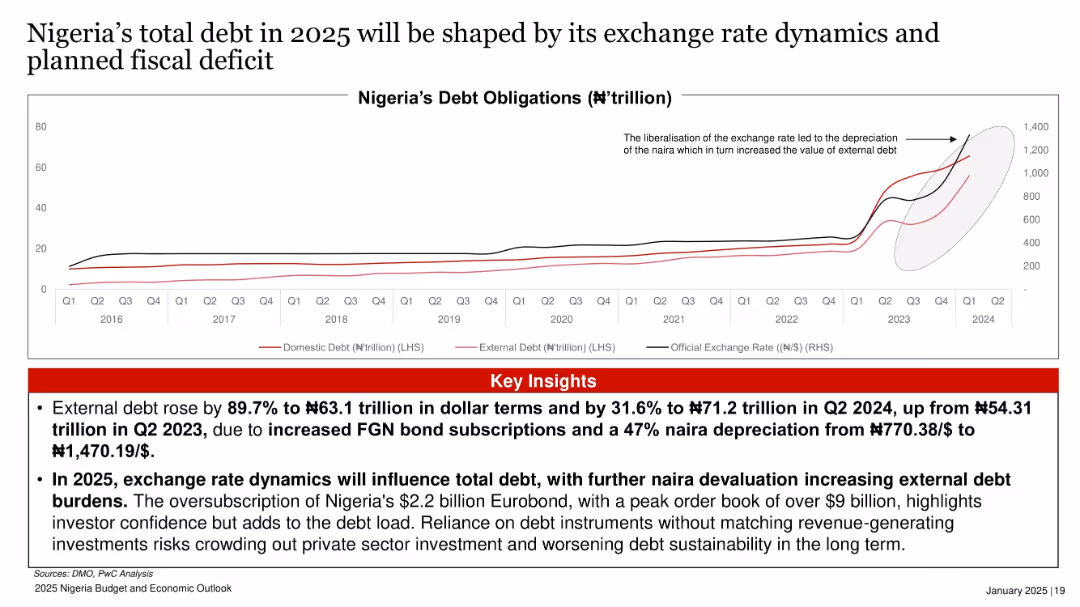
Dual-axis line chart showing domestic/external debt and exchange rate from 2016 to Q2 2024.
Financial Performance
Government & Public Sector
External debt surged by 89.7% due to a combination of bond subscriptions and a steep naira depreciation. The slide stresses how currency movements and planned deficits will determine future debt trends, potentially worsening sustainability.
external debt, naira, depreciation, bonds, debt burden, fiscal deficit, exchange rate
Mixed Chart
PwC/Strategy&
Saved
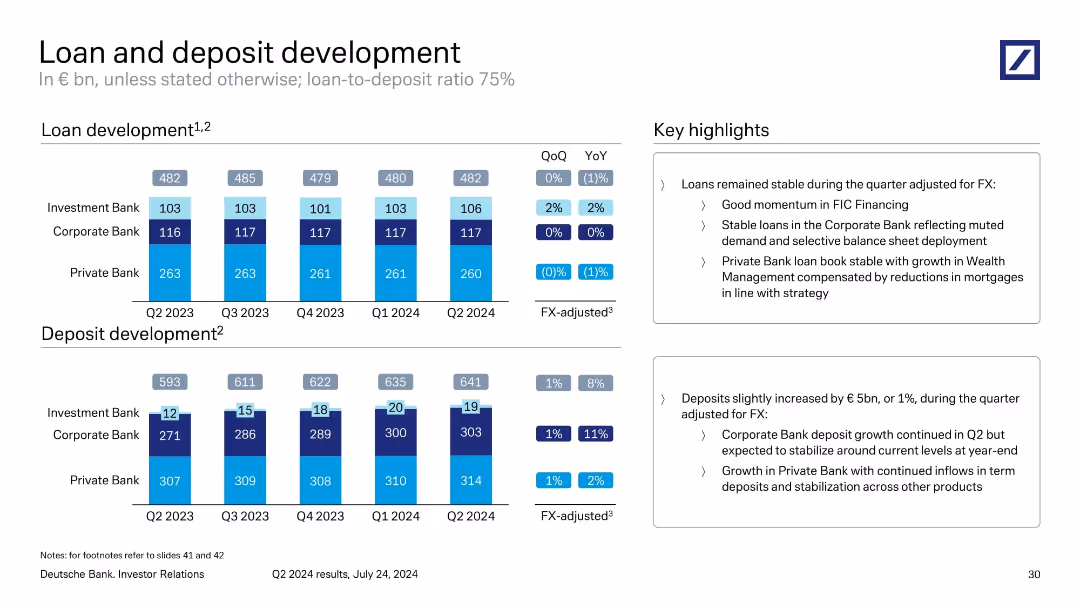
Split bar chart format for loan and deposit trends across five quarters by division. Key highlights shown in text boxes.
Performance Metrics and KPIs
Financial Services
Details Deutsche Bank’s loan and deposit volumes by segment. Loans remained flat YoY; deposits rose 1% QoQ. Highlights Private Bank loan stability and Corporate Bank deposit growth. FX adjustments considered in trends.
loans, deposits, development, FX-adjusted, Q2 2024, balance sheet
Multiple Chart
Deutsche Bank
Saved
The slide includes a bar chart showing various use cases for DCRs like data anonymization, privacy compliance, data cleaning, and transformation, with percentages for each.
Technology and Digital Transformation
Technology & Software
The slide explains the main use cases for data clean rooms (DCRs) among current users, emphasizing their role in addressing privacy concerns and audience activation.
DCR use cases, privacy, data anonymization, compliance
Single Chart
IPSOS
Saved
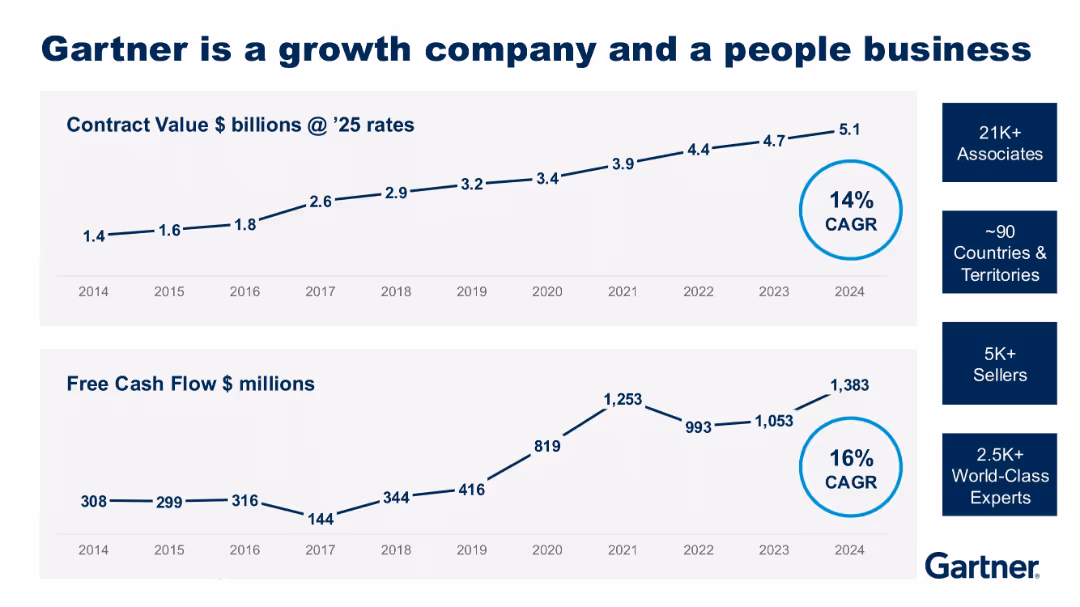
Two line graphs (contract value and free cash flow from 2014–2024) with supporting metrics on employee base; clean blue-and-white layout.
Strategic Planning
Technology & Software
Gartner highlights its sustained growth in contract value and free cash flow, with 14% and 16% CAGR respectively. The slide also emphasizes the scale of its workforce and global reach, supporting its position as a growth-focused company.
growth, Gartner, free cash flow, contract value, CAGR, global team
Multiple Chart
Gartner
Saved
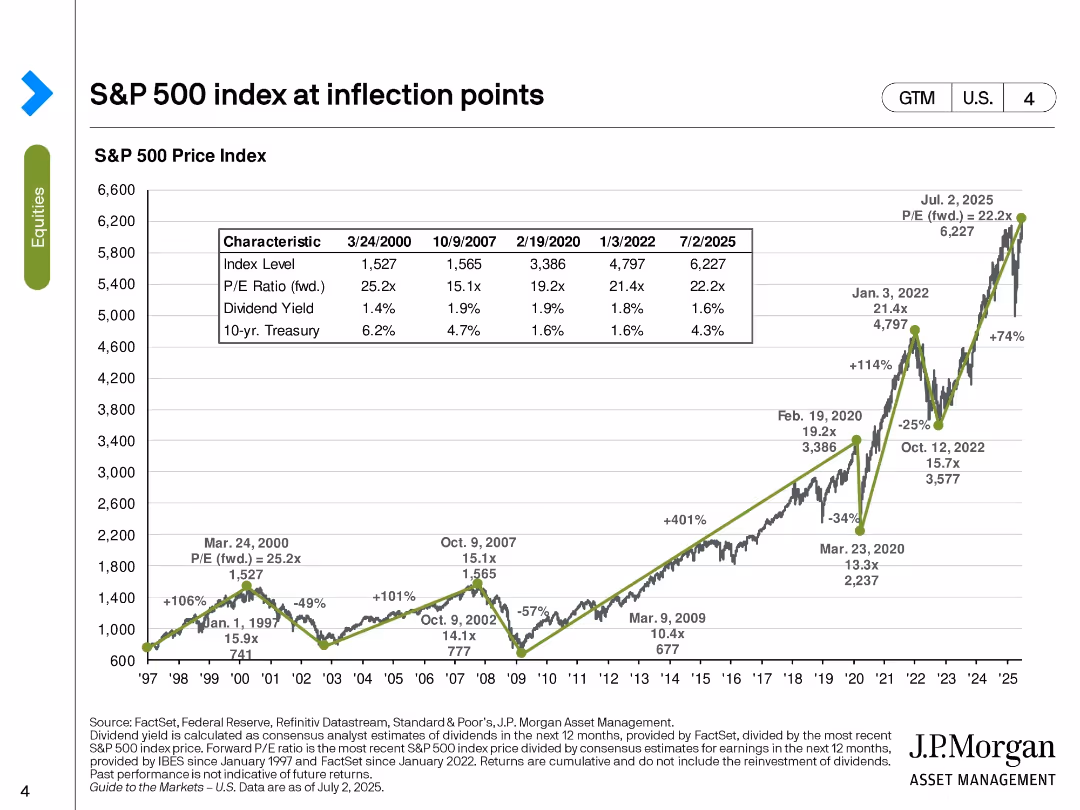
Line chart of S&P 500 index over time with annotations on major economic events; inset table compares metrics at key dates.
Market Analysis and Trends
Financial Services
This slide charts the historical trajectory of the S&P 500 from 1997 to 2025, marking significant market inflection points. It provides insights into valuation ratios, dividend yields, and interest rates at these points, helping to interpret market trends and investor behavior.
S&P 500, inflection points, market trends, valuation, dividend yield, interest rates, economic cycles, equity index
Single Chart
JP Morgan
Saved
Features three numbered steps with corresponding icons, describing the process of operationalizing SDG initiatives, including templates, timelines, and tracking methods.
Strategic Planning
Professional Services
Offering a strategic blueprint, this slide outlines essential steps to operationalize and measure the impact of SDG initiatives, aiming to enhance clarity and accountability in sustainability efforts within corporate strategies.
SDGs, Strategic Planning, Operationalization, Impact Measurement, Accountability
Pillar
McKinsey
Saved
The slide is divided into two sections, comparing satisfaction between offline and online experiences. The left side shows offline satisfaction at 100, and the right side shows online satisfaction at 125.
Customer and Market Segmentation
Consumer Goods
Compares satisfaction levels of luxury brands' offline experiences to their online counterparts, indicating higher satisfaction with online services.
Satisfaction, online, offline, luxury, comparison
Single Chart
BCG
Saved
The slide features a combination of images and bulleted lists. Four images represent key pillars, and a detailed list of industry trends and opportunities follows each image.
Market Analysis and Trends
Energy & Utilities
Discusses the growth drivers in the renewable energy sector, emphasizing Seatruim’s strategic areas of development. Useful for presenting the market outlook and potential growth areas in offshore energy and decarbonization initiatives.
Offshore Wind, Decarbonization, New Energies, Growth
Header Vertical
Morgan Stanley
Saved
Column chart with actual ranks and CO2 saved metrics highlighted for specific actions.
Market Analysis and Trends
Environmental Services & Sustainability
Shows actual effectiveness of actions to reduce greenhouse gases, highlighting 'not having a car'.
greenhouse gas, emissions, CO2, car, child
Mixed Chart
IPSOS
Saved
Previous
Next
If nothing, comes up, please save your slides first
Create a FREE account to continue browsing
Receive Instant Access to 1,000+ slides from companies like McKinsey, Google, and Goldman Sachs
First Name
Last Name
Email
Password
I agree to all
Terms & Privacy Policy
Thank you! Your submission has been received!
Oops! Something went wrong while submitting the form.
Have an account?
Sign in
Column Chart
Heatmap
Chevron
Org Chart
Infographic
Callouts
Timeline
List
Graphic
Picture
Process Flow
Diagram
Paragraph
Map
Table
Framework
Subtitle
Takeaway Box
Icon
Other Chart
Radar Chart
Waterfall Chart
Mekko Chart
Pie Chart
Scatter Plot
Line Chart
Bar chart
Bullet points