My Account
My Slides
Search by Category
Companies
Slide Type
Use Case
Industry
Pricing
Templates
View All Templates
Download Template Slides
✦ AI
AI Prompt Library
AI Search
Feedback
Login
Logout
Get Started
Browse all Slides
Browse all Slides
Create a FREE Account
Instant access to 1,000+ real slides from top companies like McKinsey, BCG, Goldman Sachs, Google and many more!
First Name
Last Name
Email
Password
I agree to all
Terms & Privacy Policy
Thank you! Your submission has been received!
Oops! Something went wrong while submitting the form.
Have an account?
Sign in
Saved Slides
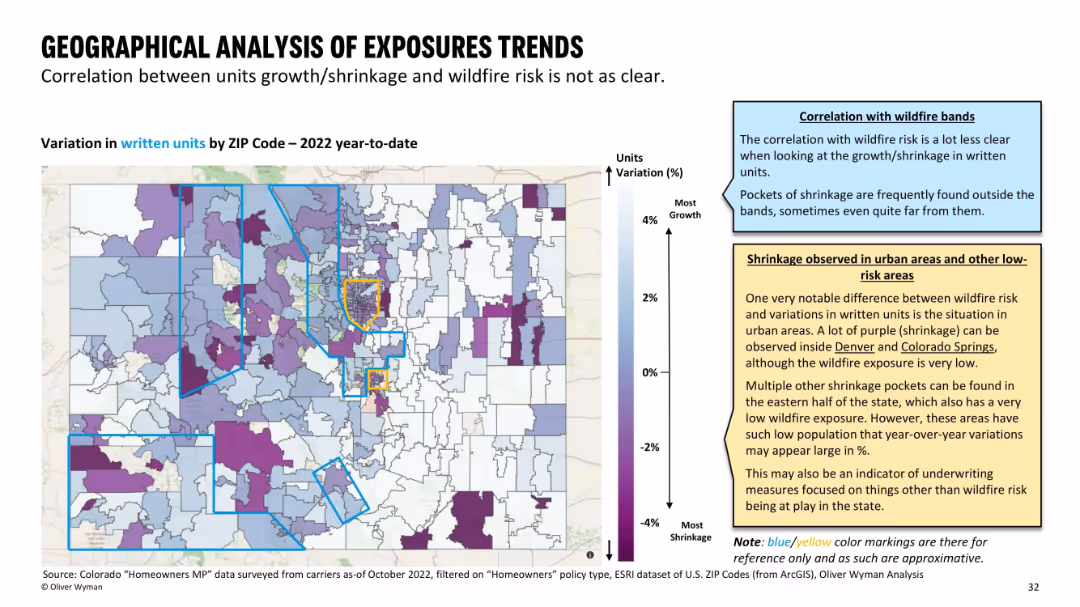
Color-coded ZIP map of Colorado showing growth/shrinkage in insurance units written; blue/yellow bands used as references for wildfire zones.
Strategic Planning
Financial Services
This slide reveals geographical patterns of insurance exposure changes in 2022. Unlike premium maps, there’s no strong correlation with wildfire risk zones. Pockets of decline appear even in low-risk or urban areas, suggesting additional underwriting considerations.
exposure trends, insurance shrinkage, wildfire zones, ZIP variation
Mixed Chart
Oliver Wyman
Saved
The slide features multiple column charts showing adjusted pre-tax income, cost/income ratio, return on regulatory capital, and client business volume over the years.
Financial Performance
Financial Services
This slide highlights the strong performance of the Swiss Universal Bank, showing financial metrics such as pre-tax income, cost/income ratio, and business volume growth.
SUB, financial performance, pre-tax income, cost/income ratio, business volume
Multiple Chart
Credit Suisse
Saved
This slide presents a clear title, a large column chart depicting growth in the home improvement market, and additional circular icons with percentages and brief descriptions. The design utilizes a consistent green and gray color scheme to aid in data presentation.
Market Analysis and Trends
Consumer Goods
Analyzes the temporary growth and expected decline in the home improvement sector during and post-COVID-19. It highlights the surge in market activity during 2020 due to increased consumer spending on home upgrades, with projections for normalization as the pandemic impact diminishes.
home improvement, market trends, COVID-19, consumer spending, retail impact, growth analysis, data chart
Mixed Chart
BCG
Saved
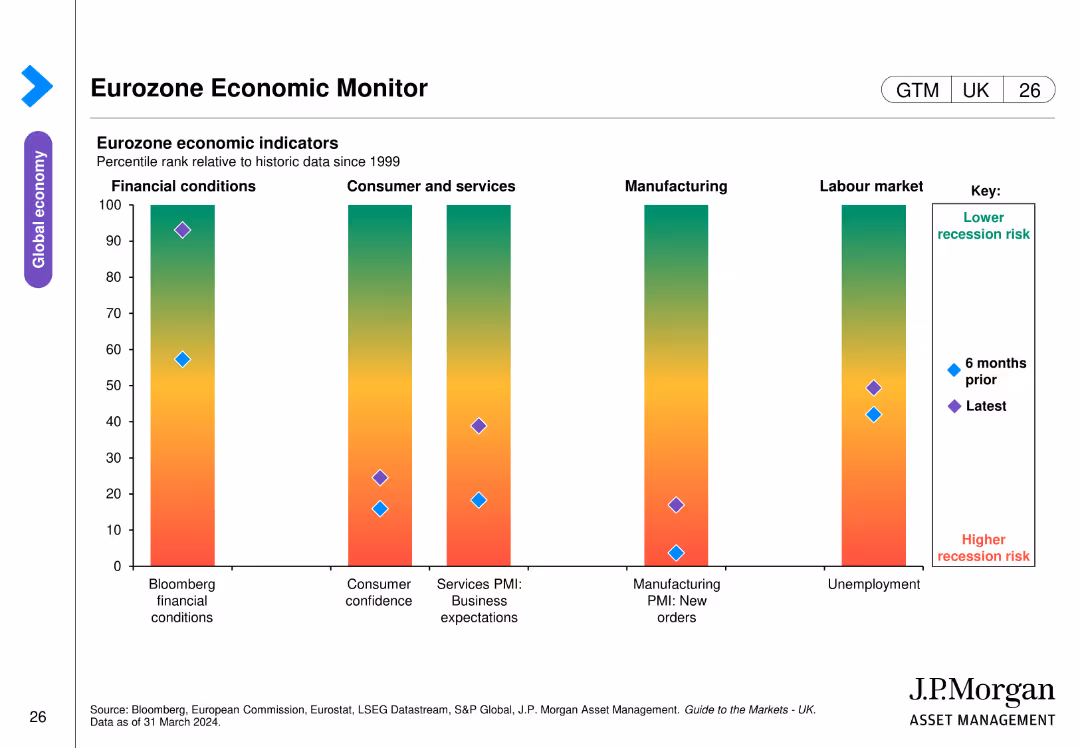
The slide includes a bar chart displaying eurozone economic indicators. The bars show percentile ranks relative to historic data across different economic conditions, consumer confidence, business expectations, manufacturing orders, and unemployment.
Market Analysis and Trends
Financial Services
This slide monitors eurozone economic health by presenting various economic indicators over time, aiding in the assessment of recession risks and economic stability.
eurozone, economic indicators, recession risk, consumer confidence, manufacturing orders
Single Chart
JP Morgan
Saved
The slide includes a circular diagram for digitally enabled client experience and multiple metrics showing benefits like client returns, RM efficiency, and franchise benefits. A column chart and bullet points describe private banking international benefits.
Technology and Digital Transformation
Financial Services
The slide demonstrates how digital enablement enhances client engagement and profitability, highlighting improved client returns, reduced RM proposal time, and revenue increase. It also details the launch of Private Banking International for investment clients.
digital, engagement, profitability, private banking, technology
Framework
Credit Suisse
Saved
Contains column charts showing the role of Chinese OEMs in BEV production and their market share in the global top 100 suppliers. Includes text highlighting the professionalization and expansion of Chinese automotive suppliers.
Market Analysis and Trends
Transportation & Logistics
Discusses the growing influence of Chinese OEMs in the global automotive market, especially in BEV production. Analyzes the market share and strategic positioning of Chinese suppliers in the global top 100 suppliers.
Chinese OEMs, Market Dynamics, Automotive, BEV, Suppliers
Multiple Chart
Roland Berger
Saved
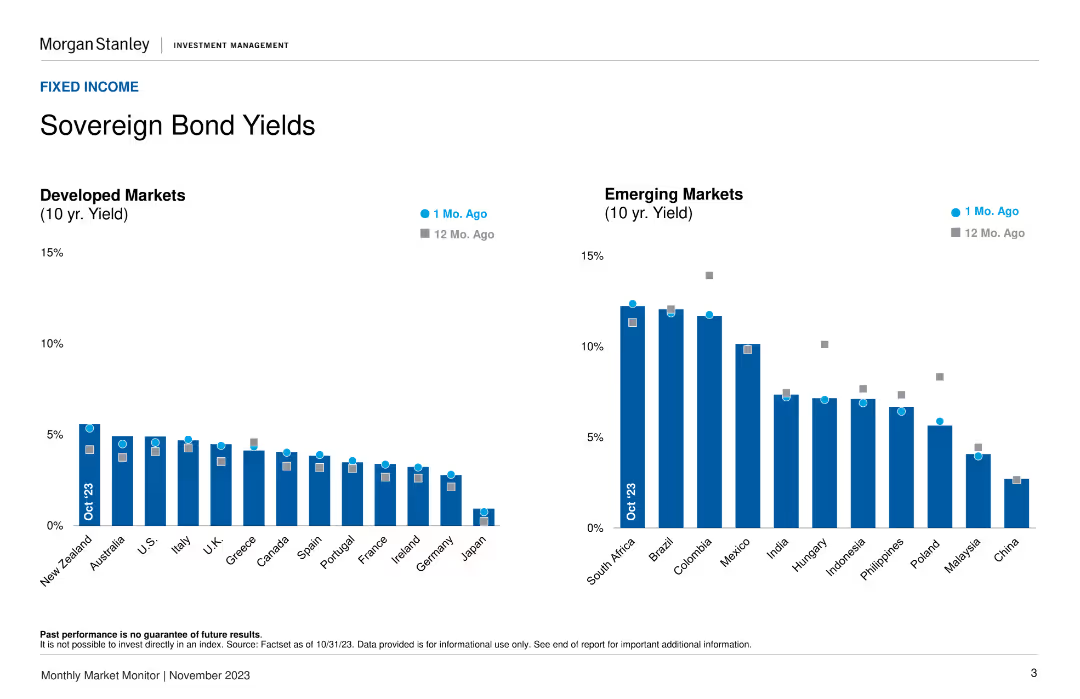
Two column charts showing 10-year bond yields for developed and emerging markets, comparing current rates to rates from 1 month and 12 months ago.
Market Analysis and Trends
Financial Services
Provides 10-year sovereign bond yields for developed and emerging markets, helping analyze trends in bond yields and their implications.
Bond yields, developed markets, trends
Multiple Chart
Morgan Stanley
Saved
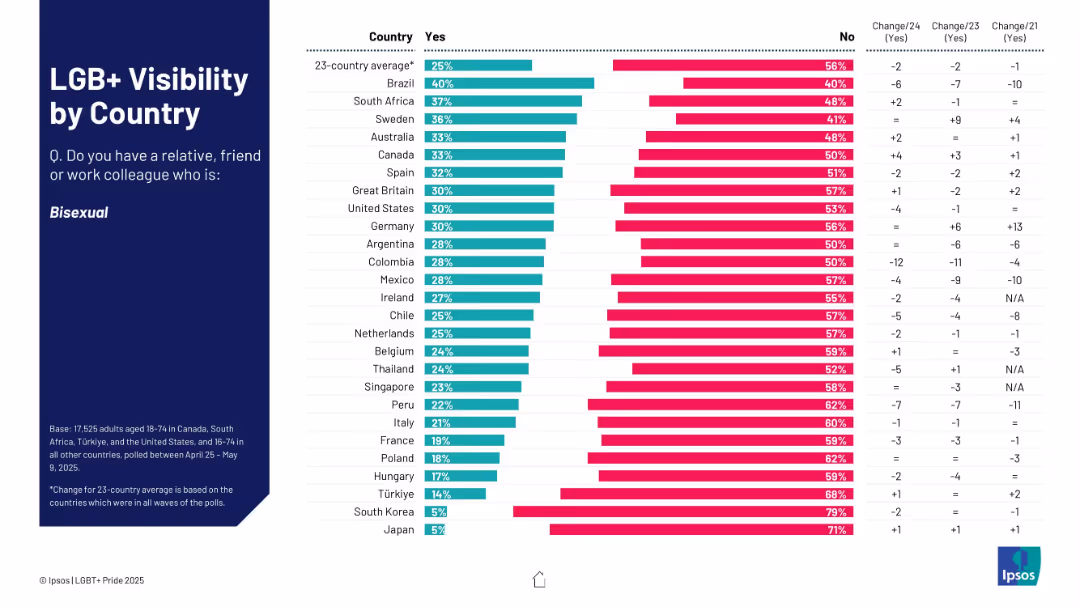
Similar to previous; shows responses to knowing someone bisexual; bar chart with country comparisons.
Market Analysis and Trends
Government & Public Sector
The chart shows the proportion of people in different countries who know someone bisexual. Brazil and South Africa top the list, while Japan and South Korea are at the bottom.
bisexual, relationships, awareness, LGBT+, countries, visibility
Mixed Chart
IPSOS
Saved
A comparative slide with a grid layout, comparing offline and online channels for different stages of vehicle purchase and aftersales, including information gathering, testing, purchase, and care.
Sales and Business Development
Retail & E-commerce
The slide compares online and offline channels for different stages of the vehicle purchase process, highlighting that online channels dominate for information gathering, but offline for testing and purchase.
car buyers, online channel, offline channel, vehicle purchase, customer lifecycle, information gathering, pre-purchase testing, purchase, customer care
Multiple Chart
EY
Saved
Includes a pie chart and a sectioned content layout with headers and bullet points. Text sections cover key findings and broad overviews.
Operational Efficiency
Financial Services
This slide outlines the limited involvement of tax functions in ERP and software deployment within companies. It details the survey percentages and discusses the necessity for greater integration of tax operations into ERP systems.
tax, ERP, software, deployment, involvement, financial services, pie chart
Mixed Chart
PwC/Strategy&
Saved
A visually engaging slide presenting a variety of computing methods like device edge, remote edge, and hybrid cloud, illustrated with relevant icons and diagrams, all on a sleek dark background.
Technology and Digital Transformation
Technology & Software
The slide provides a comprehensive overview of the cloud and edge computing trend, explaining the shift from centralized to hybrid computational models. It details various computing locations and their use cases, highlighting how they contribute to tomorrow's networks with closer user computation.
Edge Computing, Hybrid Cloud, Computational Models
Header Horizontal
McKinsey
Saved
Depicts a central graphic with concentric circles detailing governance, strategy, risk management, and targets, accompanied by side text and logos.
Regulatory and Compliance
Industrial & Manufacturing
Discusses how Michelin adheres to the Task Force on Climate-Related Financial Disclosures (TCFD) with a focus on governance, strategy, risk management, and targets related to climate initiatives.
TCFD, Michelin, Climate Change, Financial Disclosures, Risk Management, Strategy, Governance, Environmental Targets, Corporate Responsibility, Sustainability
Framework
Morgan Stanley
Saved
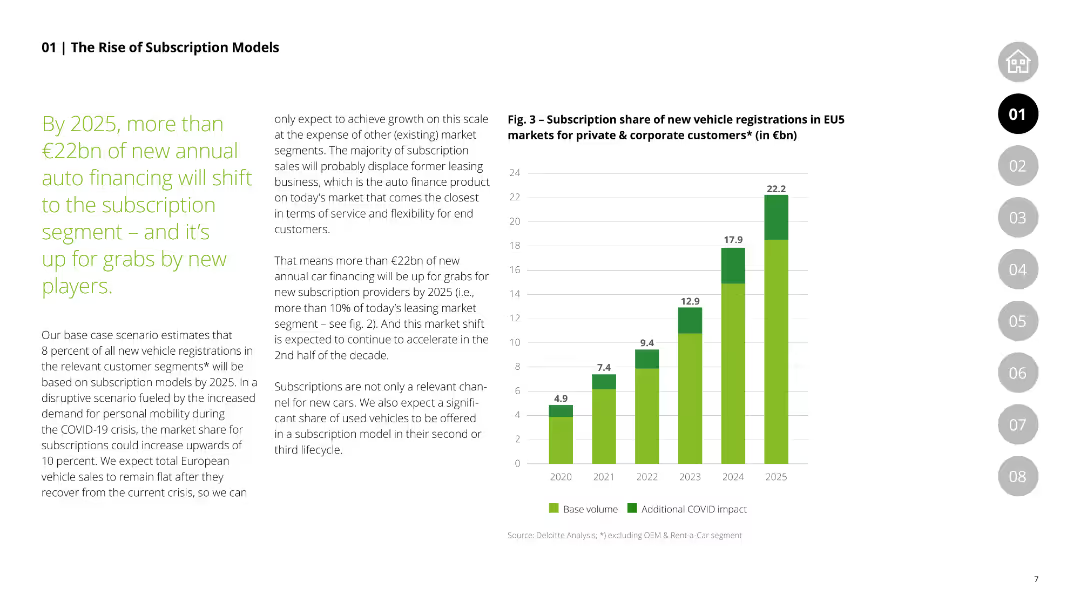
The slide shows a column chart projecting subscription share of new vehicle registrations in the EU5 markets for private and corporate customers from 2020 to 2025, highlighting the expected growth due to COVID-19 impact.
Market Analysis and Trends
Financial Services
Provides projections for the rise in subscription models in vehicle registrations in the EU5, emphasizing the impact of COVID-19 and the shift in market dynamics.
subscription models, vehicle registrations, EU5, market projection, COVID-19 impact
Mixed Chart
Deloitte
Saved
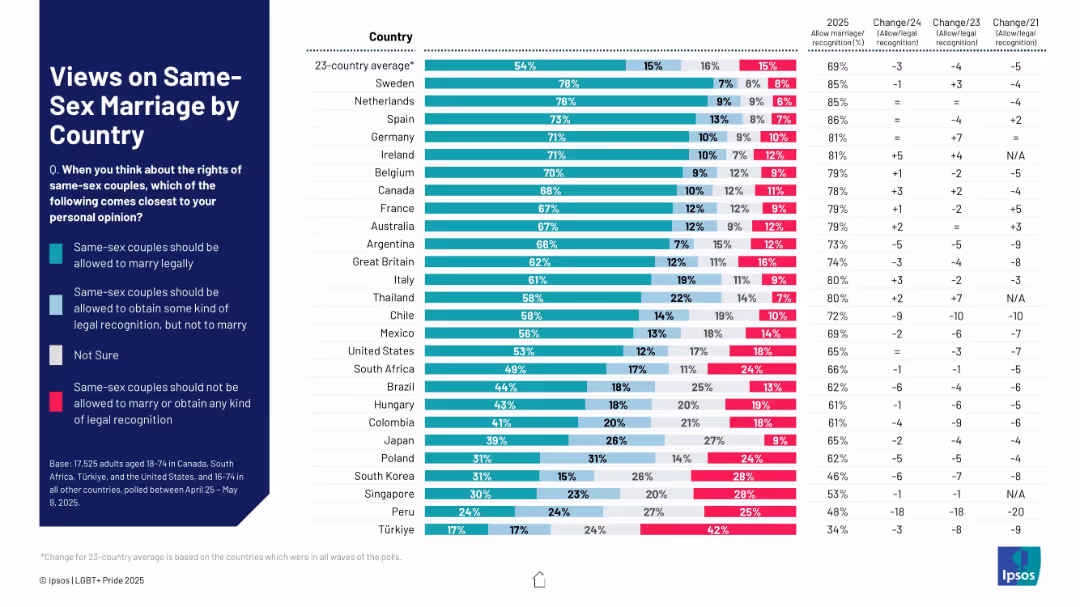
Multicolor stacked bar chart showing legal recognition support levels across countries, including "Not sure" responses.
Regulatory and Compliance
Government & Public Sector
This slide measures global sentiment toward same-sex marriage rights. It shows whether people believe same-sex couples should be allowed to marry, receive legal recognition, or be denied both. Trends over time are also included.
same-sex marriage, legal recognition, LGBTQ+ rights, marriage equality, international opinion, civil rights, public support, trends
Mixed Chart
IPSOS
Saved
A highlighted map of Europe with key strategy points listed to the left, and a descriptive heading at the top. Neat layout with icons and colored text boxes.
Strategic Planning
Financial Services
Focuses on the growth and strategic positioning within the developed European markets, outlining opportunities and initiatives to strengthen the company's presence.
Strategy, Europe, market growth, development, positioning
Table
Goldman Sachs
Saved
The slide includes a bar chart and a pie chart illustrating the demographics, gender split, and other characteristics of young people.
Customer and Market Segmentation
Education & Training
The slide presents an analysis of young people's demographics, highlighting gender, ethnicity, educational background, and various socio-economic factors.
demographics, gender split, young people, ethnicity, socio-economic
Multiple Chart
EY
Saved
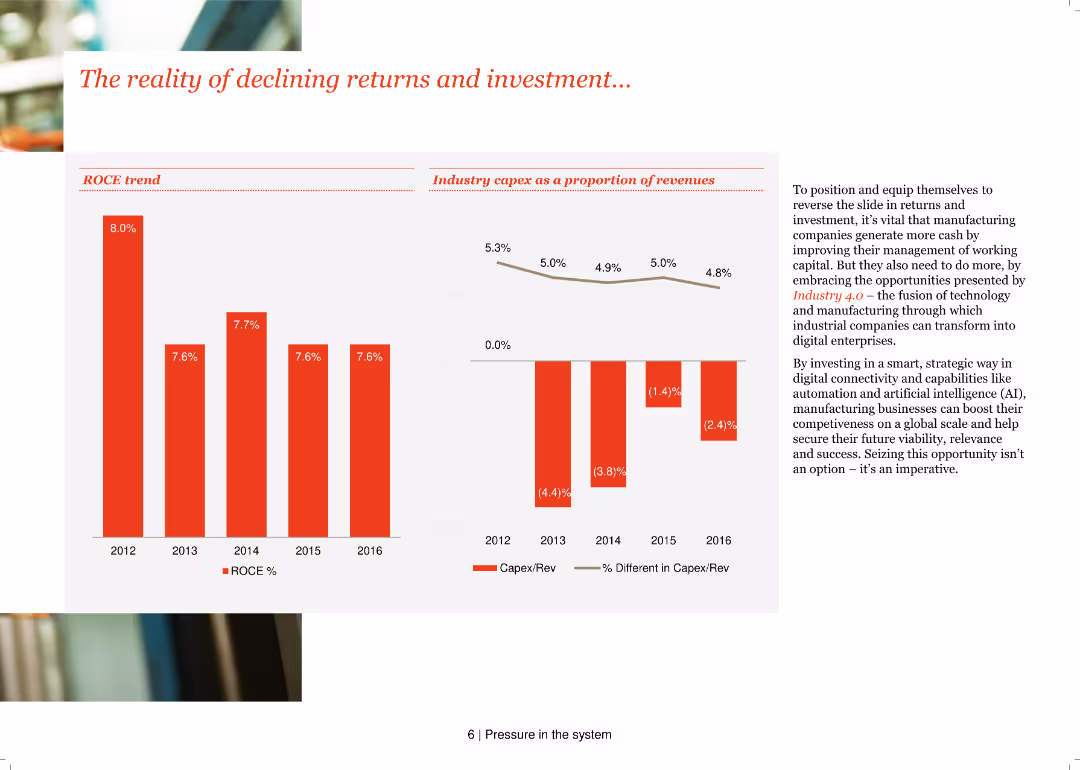
This slide features two column charts: one showing ROCE trends from 2012-2016 and another showing industry capex as a proportion of revenues. Text discusses the importance of managing working capital and investing in Industry 4.0.
Financial Performance
Industrial & Manufacturing
It addresses the decline in returns and investment in the manufacturing sector, emphasizing the need for better working capital management and investment in Industry 4.0 to improve competitiveness and future viability.
ROCE trends, capex, industry 4.0, manufacturing, investment, financial performance, column charts, working capital, returns
Multiple Chart
PwC/Strategy&
Saved
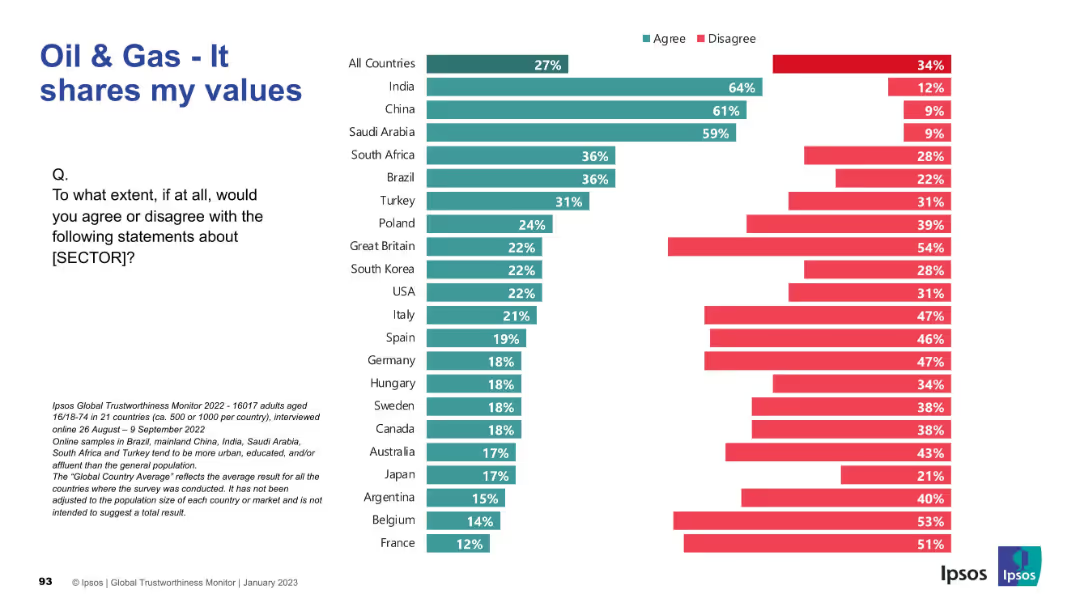
Standard Ipsos visualization with “Agree” and “Disagree” bars by country; values perception theme; survey metadata at bottom.
Market Analysis and Trends
Energy & Utilities
This slide addresses alignment of values between the public and oil & gas sector. Strongest alignment is seen in India, China, and Saudi Arabia, while most Western nations report weak alignment, reflecting cultural and ethical disconnects.
Values Alignment, Oil & Gas, Ipsos, Cultural Fit, Public Opinion, Global Comparison, Sector Trust, Personal Values, Survey Insights
Mixed Chart
IPSOS
Saved
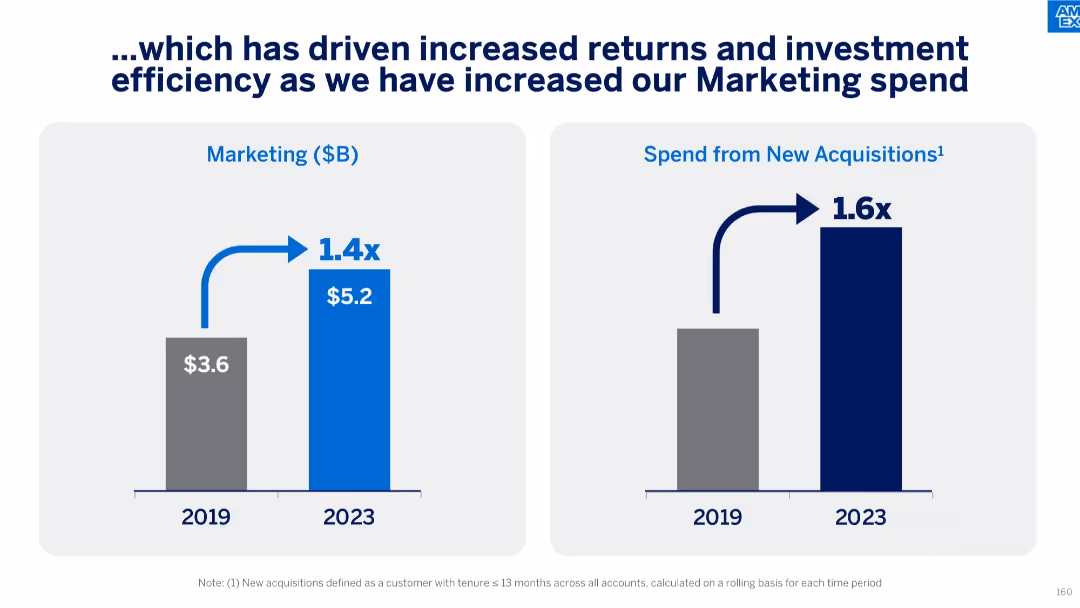
Dual bar charts comparing 2019 vs 2023 marketing spend and spend from new acquisitions. Notable growth highlighted with multipliers (1.4x, 1.6x).
Strategic Planning
Financial Services
The slide shows a strategic increase in marketing investment, growing from $3.6B in 2019 to $5.2B in 2023, with a 1.6x boost in returns from new acquisitions. It signals enhanced marketing efficiency and improved ROI on customer acquisition efforts.
marketing investment, ROI, acquisition spend, customer growth, budget efficiency, strategic marketing, financial growth
Single Chart
McKinsey
Saved
This slide offers a variety of data visualizations, including column and bar charts, detailing spending and credit use.
Risk Assessment and Management
Financial Services
Analyzes consumer spending patterns and credit card usage, providing insights on discretionary and non-discretionary spending.
consumer spending, credit usage, balance sheets, discretionary spending, JPMorgan Chase & Co, financial analysis
Multiple Chart
JP Morgan
Saved
Bar charts depicting the percentage difference between R&D and marketing budgets across different company sizes and industries.
Market Analysis and Trends
Professional Services
Analyzes how companies allocate funds between R&D and marketing, highlighting industry-specific strategies. This slide is key for strategic financial decisions and understanding industry trends in investment priorities.
R&D, marketing, budgets, comparison, industry, strategy, allocation, trends
Multiple Chart
Deloitte
Saved
Bar and patterned bar charts compare the deal values of FGA acquisitions in technology M&A, with highlights on major deals such as Google's and Facebook's acquisitions.
Mergers and Acquisitions
Technology & Software
The slide compares FGA acquisitions against overall technology M&A deal values, underscoring their relatively small proportion with emphasis on notable exceptions. Suitable for M&A trend analysis.
M&A, FGA, Technology, Deal Value, Acquisitions
Mixed Chart
Oliver Wyman
Saved
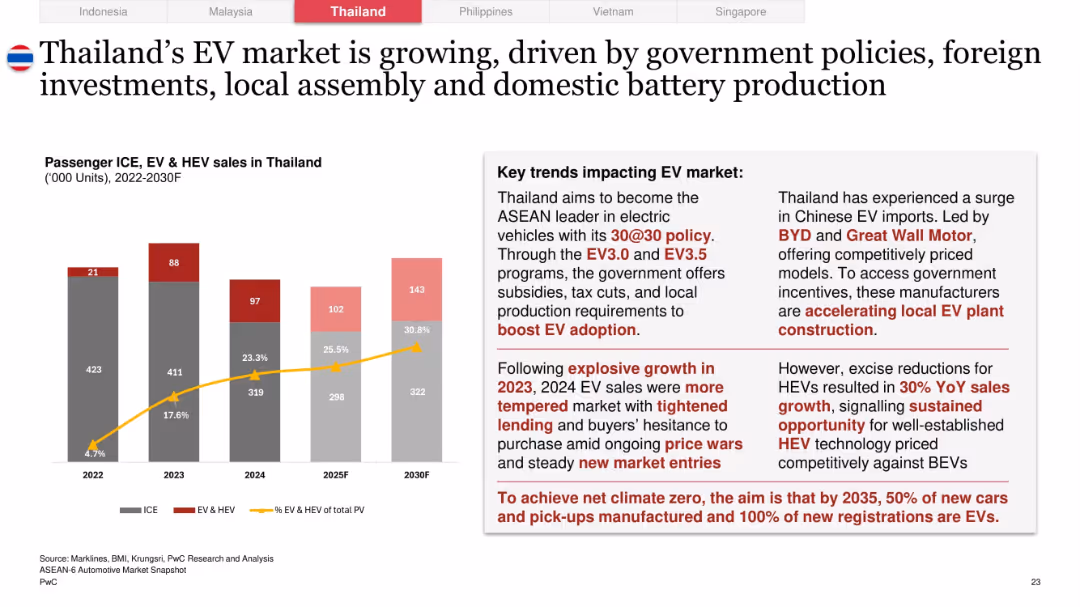
Left section features bar and line graph for EV/ICE trends 2022–2030F; right section has detailed narrative on EV policies and challenges
Technology and Digital Transformation
Industrial & Manufacturing
Thailand’s EV market sees strong growth in 2023, with 30% EV target by 2030. Government subsidies, local production, and rising Chinese imports fuel the transition. Market cooling in 2024 due to price sensitivity and lending tightness is noted.
Thailand, EV policy, BEV vs HEV, 30@30, Chinese EVs, BYD, price sensitivity, local assembly, carbon goals
Mixed Chart
PwC/Strategy&
Saved
Bar graph comparing gross and operating margins for durables and nondurables with a clear visual contrast.
Financial Performance
Financial Services
Compares profitability across verticals in the distribution industry, highlighting differences in margins.
Profitability, Distribution, Margins, Durables, Nondurables, Comparison
Multiple Chart
EY
Saved
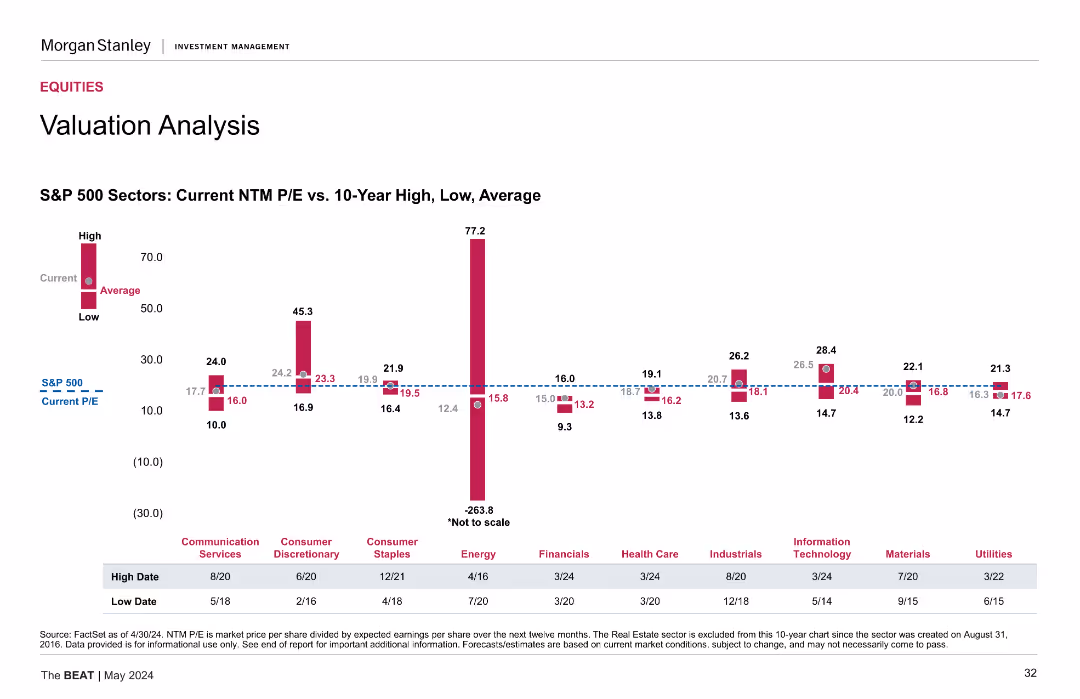
This slide presents a column chart showing the current NTM P/E ratios vs. 10-Year High, Low, and Average for S&P 500 sectors such as Communication Services, Consumer Discretionary, Energy, etc. The chart includes data points for high, current, and low P/E ratios.
Financial Performance
Financial Services
The slide offers a detailed valuation analysis of S&P 500 sectors, comparing current NTM P/E ratios with historical highs, lows, and averages.
Valuation analysis, NTM P/E, S&P 500, sectors, historical data
Mixed Chart
Morgan Stanley
Saved
Previous
Next
If nothing, comes up, please save your slides first
Create a FREE account to continue browsing
Receive Instant Access to 1,000+ slides from companies like McKinsey, Google, and Goldman Sachs
First Name
Last Name
Email
Password
I agree to all
Terms & Privacy Policy
Thank you! Your submission has been received!
Oops! Something went wrong while submitting the form.
Have an account?
Sign in
Column Chart
Heatmap
Chevron
Org Chart
Infographic
Callouts
Timeline
List
Graphic
Picture
Process Flow
Diagram
Paragraph
Map
Table
Framework
Subtitle
Takeaway Box
Icon
Other Chart
Radar Chart
Waterfall Chart
Mekko Chart
Pie Chart
Scatter Plot
Line Chart
Bar chart
Bullet points