My Account
My Slides
Search by Category
Templates
View All Templates
Download Template Slides
✦ AI Search
Feedback
Login
Logout
Get Started
Browse all Slides
Browse all Slides
Create a FREE Account
Instant access to 1,000+ real slides from top companies like McKinsey, BCG, Goldman Sachs, Google and many more!
First Name
Last Name
Email
Password
I agree to all
Terms & Privacy Policy
Thank you! Your submission has been received!
Oops! Something went wrong while submitting the form.
Have an account?
Sign in
Saved Slides
Features a structured layout with icons and four colored blocks outlining different strategic interventions in the solar market.
Strategic Planning
Energy & Utilities
Summarizes strategies derived from stakeholder consultations aimed at enhancing the solar energy market through financial, institutional, customer-focused, and regulatory interventions.
solar energy, market strategy, stakeholder consultations, regulatory reforms, financial enablement
Pillar
BCG
Saved
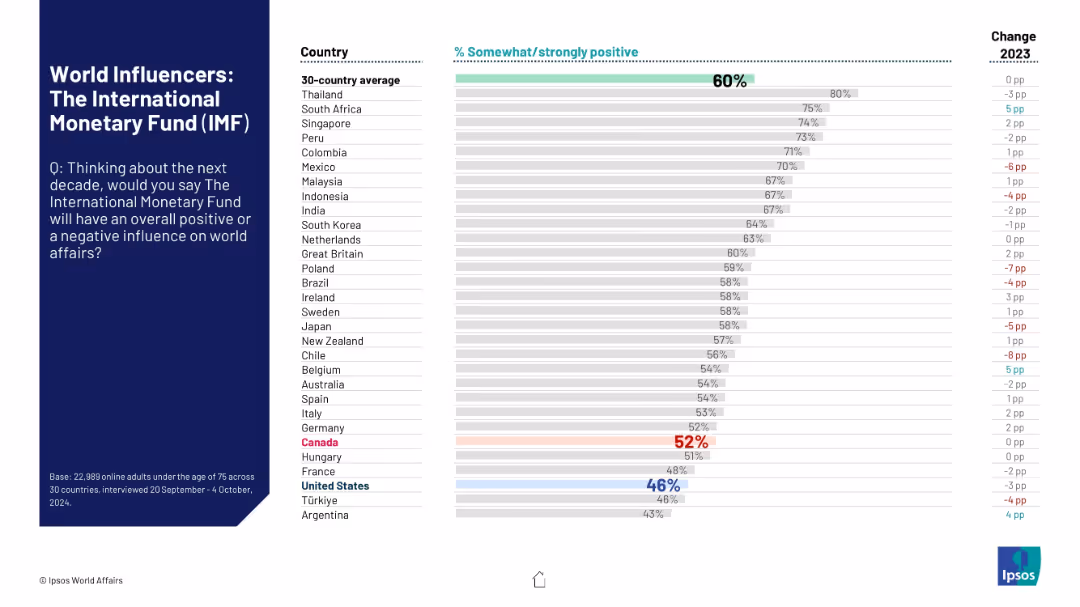
Uses standard layout with question on left and horizontal sentiment comparison by country on the right.
Market Analysis and Trends
Financial Services
The slide highlights how different countries rate the IMF’s potential global impact in the next decade. It visualizes approval ratings and the change from 2023, illustrating mixed global sentiment.
IMF, public sentiment, international finance, perception, influence, Ipsos, country comparison, bar chart, approval rating, 2024 survey
Mixed Chart
IPSOS
Saved
Text and infographic on the left; vibrant hiking photo on the right. Descriptive, with teal accent colors.
Customer and Market Segmentation
Media & Entertainment
Hiking is profiled as the UK’s second most popular participation sport. The slide emphasizes its gender balance, youth appeal, and adjacency to lifestyle and retail sectors as growth levers.
hiking, participation, UK sport, gender balanced, lifestyle, youth, growth opportunities
Mixed Chart
EY
Saved
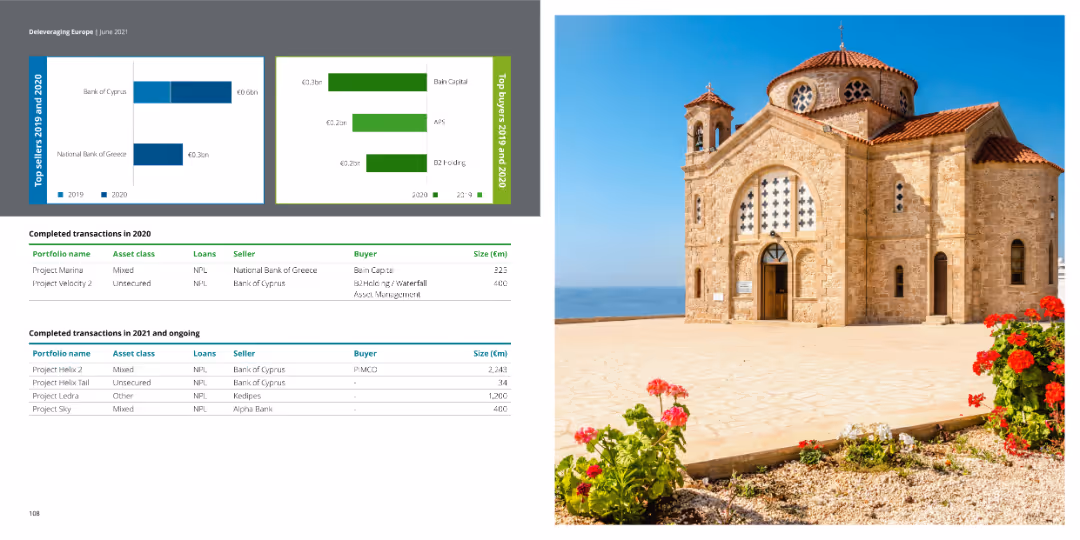
The slide features tables of completed transactions for 2020 and ongoing ones in 2021, with bar charts showing top sellers and buyers for 2019 and 2020. The right side contains an image of a historical site.
Market Analysis and Trends
Financial Services
The slide provides comprehensive data on completed and ongoing financial transactions, listing portfolio names, asset classes, loan types, sellers, buyers, and transaction sizes.
transactions, financial, market, buyers, sellers
Multiple Chart
Deloitte
Saved
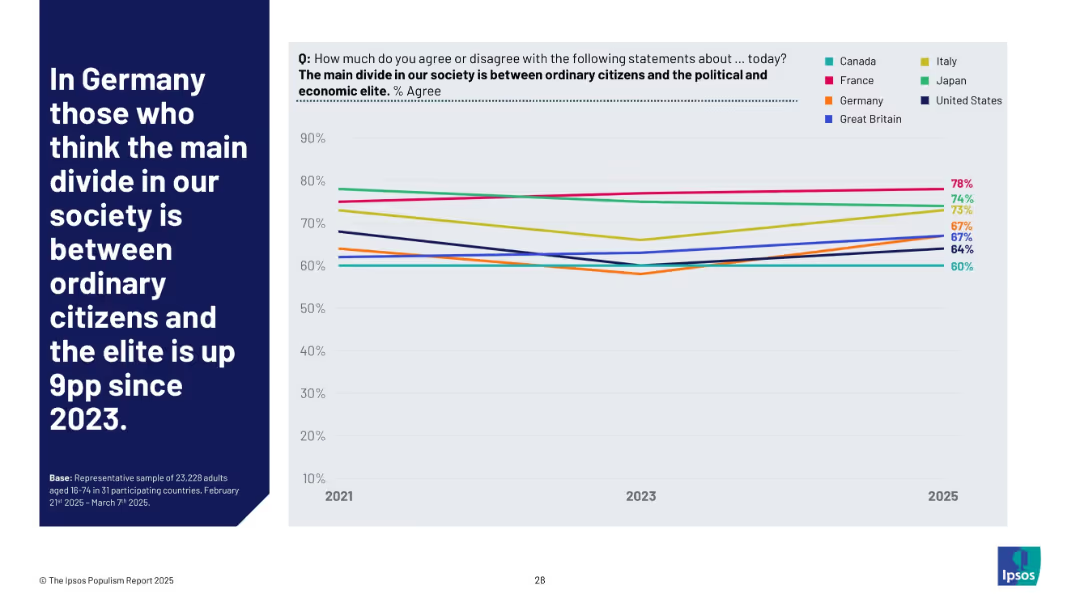
Left-aligned title text; right side shows a line chart tracking changes in Germany and peer nations for 2021–2025.
Market Analysis and Trends
Government & Public Sector
Germany has seen a 9 percentage point increase since 2023 in the belief that the main societal divide is between ordinary citizens and elites, aligning with broader populist concerns tracked globally.
Germany, elite divide, trend, societal perception, Ipsos, populism, 2025, comparison, inequality, citizens
Mixed Chart
IPSOS
Saved
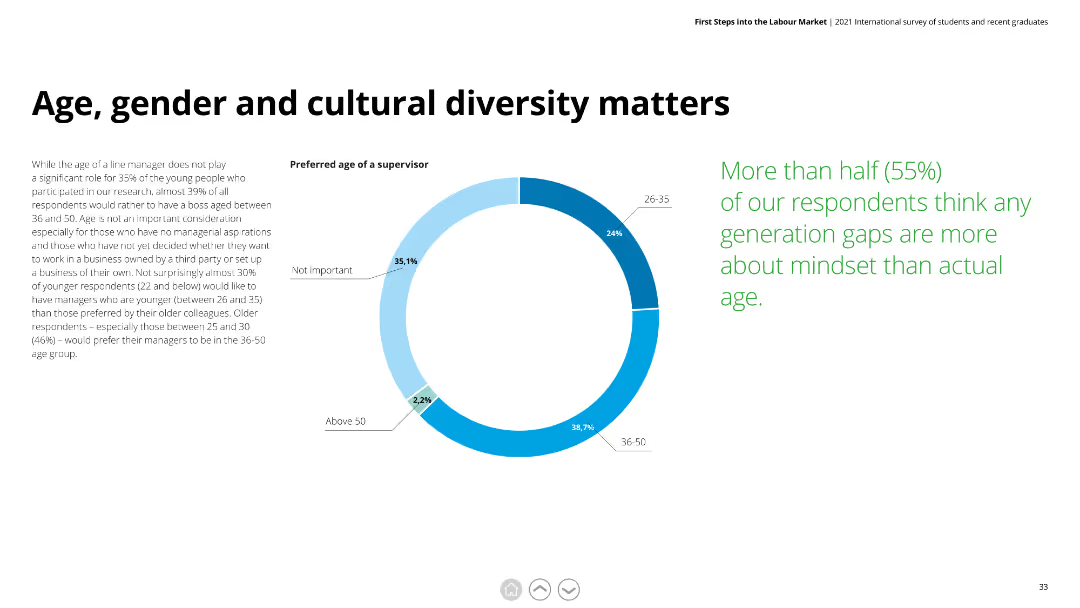
Donut chart showing preferred age of supervisors and detailed text on the importance of age, gender, and cultural diversity in the workplace.
Human Resources and Talent Management
Education & Training
This slide explores preferences for the age of supervisors among young professionals and discusses the significance of mindset over age in workplace diversity.
diversity, age preference, gender, cultural diversity, workplace mindset
Mixed Chart
Deloitte
Saved
A bar chart presents the prioritization of factors by investors for ensuring financial health in companies, emphasizing revenue protection and cash flow management.
Strategic Planning
Financial Services
Discusses key strategies that investors believe should be prioritized to maintain financial health in companies, especially in challenging economic conditions. Useful for strategic financial planning.
financial health, strategies, investors, prioritization, resilience
Single Chart
BCG
Saved
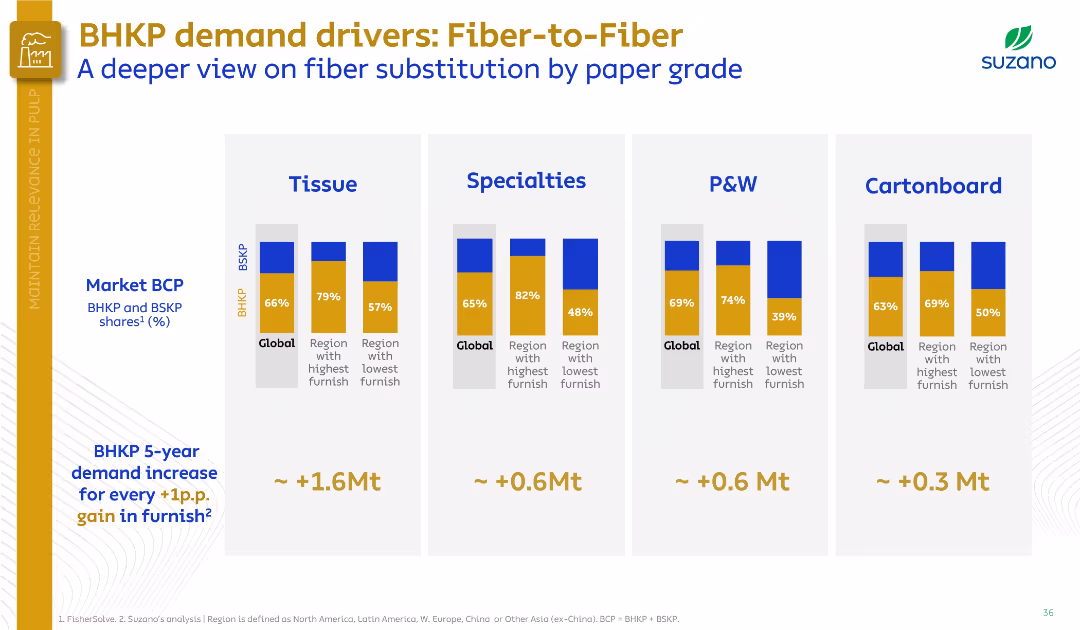
Four vertical bar clusters show fiber substitution by paper grade (Tissue, Specialties, P&W, Cartonboard). Visual-heavy and comparative.
Customer and Market Segmentation
Industrial & Manufacturing
This slide dives deeper into fiber substitution across paper grades, comparing global and regional BHKP/BSKP usage. It estimates demand increases based on furnish shifts, with the highest growth potential in tissue and specialties.
fiber substitution, BHKP, paper grades, tissue, specialties, P&W, cartonboard, furnish
Single Chart
Goldman Sachs
Saved
A column chart representing the count of shows in the Nielsen Top 10 by platform over several weeks. The chart uses different colors to represent platforms like Apple TV+, Hulu, Amazon, and Disney+, with a legend on the right for reference.
Competitive Landscape
Media & Entertainment
This slide shows the weekly count of shows in the Nielsen Top 10 by platform from October to February. It highlights the presence and performance of various streaming services in producing top-rated shows.
top 10 shows, platform performance, weekly count, Nielsen ratings, streaming services
Single Chart
Nielsen
Saved
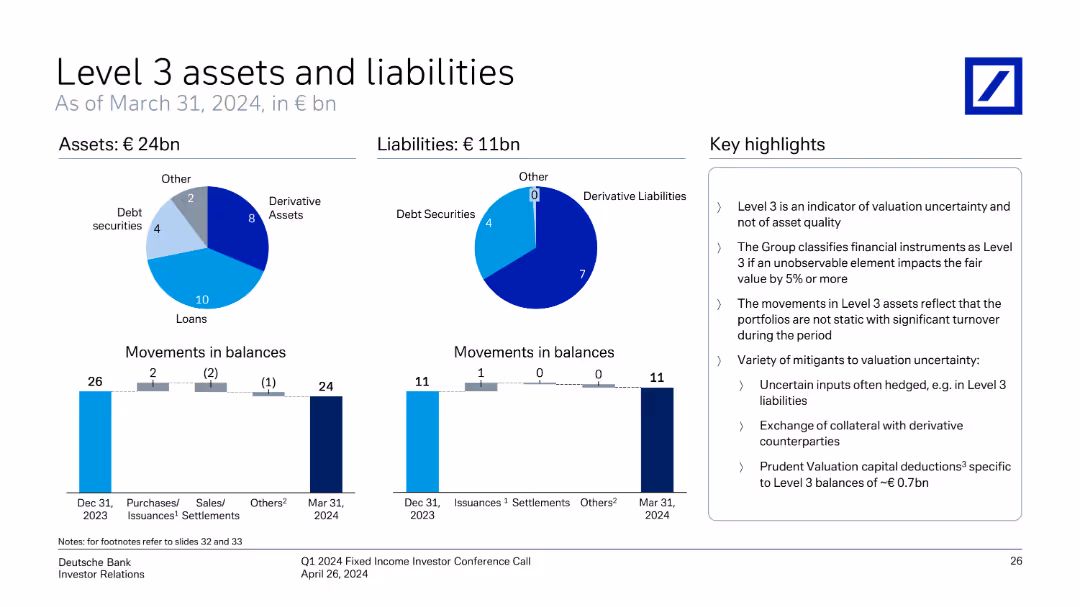
Pie charts for assets and liabilities distribution, bar charts for movements in balances, with key highlights on the right.
Financial Performance
Financial Services
Provides an overview of Level 3 assets and liabilities, including movements in balances and valuation uncertainty mitigation.
Level 3, assets, liabilities, balances, valuation, uncertainty, financial instruments
Multiple Chart
Deutsche Bank
Saved
This slide contains two visualizations: a column chart showing consensus forecasts for real GDP growth and a line chart illustrating Composite Purchasing Managers’ Index (PMI) for the UK, Eurozone, Japan, US, and China.
Market Analysis and Trends
Financial Services
The slide provides data on global GDP growth forecasts for 2023 and 2024, along with PMI trends for major economies, useful for understanding economic performance and future expectations.
GDP growth, PMI, global economy, economic performance, trends
Multiple Chart
JP Morgan
Saved
This slide features four images, each representing a different development project, with corresponding cost estimates and timelines from 2022 to 2035. The images have an 'artist impression' label, indicating they are conceptual representations. There is also a footnote about the manager's monitoring of development under contract compliance with regulations.
Strategic Planning
Real Estate & Construction
Depicts a timeline of major construction projects within a real estate portfolio, showing investment in development projects currently underway or in planning stages.
Development Pipeline, Real Estate Projects, Construction Investment, Projected Costs, Timeline, Regulatory Compliance
Image
Morgan Stanley
Saved
Features column charts showing inter- and intraregional merchandise export growth from 2000 to 2016 for various regions. The charts are color-coded to distinguish between years and include percentage changes.
Market Analysis and Trends
Financial Services
Provides an analysis of growth in merchandise exports over 16 years, segmented by region. Key for evaluating market trends and developing regional trade strategies.
trade, growth, exports, regional, interregional
Graphic
Roland Berger
Saved
The slide features a blue and white color scheme with sections highlighting financial statistics and textual descriptions. It uses bullet points for clarity, and red text is employed to emphasize certain key figures.
Financial Performance
Financial Services
It outlines the financial highlights of the third quarter of 2023, focusing on revenues, net income, EPS, and effective tax rate. This slide is essential for a quick overview of financial health and operational effectiveness, likely targeting investors and financial analysts.
financial overview, highlights, Q3, revenues, net income, EPS, tax rate
Header Vertical
Citigroup
Saved
A graphically dense slide with statistics on internet downloads, preferences for network reliability, and illustrations that emphasize user engagement with the nbn™ network.
Technology and Digital Transformation
Telecommunications
Highlights the preferred status of the nbn™ network in Australia, its value to users, and the significant amount of internet traffic it handles.
Internet, Downloads, nbn, Connectivity, User Preference, Traffic
Pillar
Accenture
Saved
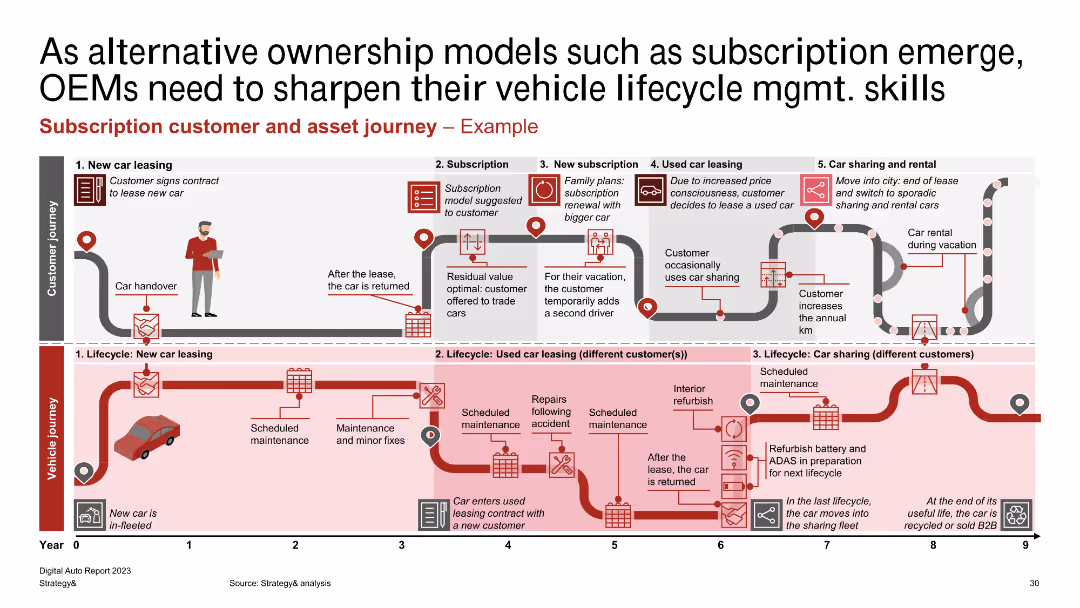
A detailed process flow diagram showing customer and vehicle journey stages for subscription-based ownership models.
Customer and Market Segmentation
Transportation & Logistics
Depicts the stages of customer and vehicle journeys in subscription models, from new car leasing to car sharing and rental, highlighting key activities and touchpoints.
subscription, customer journey, asset management, vehicle journey
Linear Flow
PwC/Strategy&
Saved
Detailed horizontal bar chart showcasing the percentage of respondents planning major technology upgrades in areas like ERP and supply chain analytics.
Technology and Digital Transformation
Retail & E-commerce
Focuses on the growing emphasis on technology upgrades in inventory and warehouse management, crucial for improving operational efficiency in businesses.
technology upgrades, inventory management, ERP, warehouse management, operational efficiency, business, analytics, supply chain
Mixed Chart
Deloitte
Saved
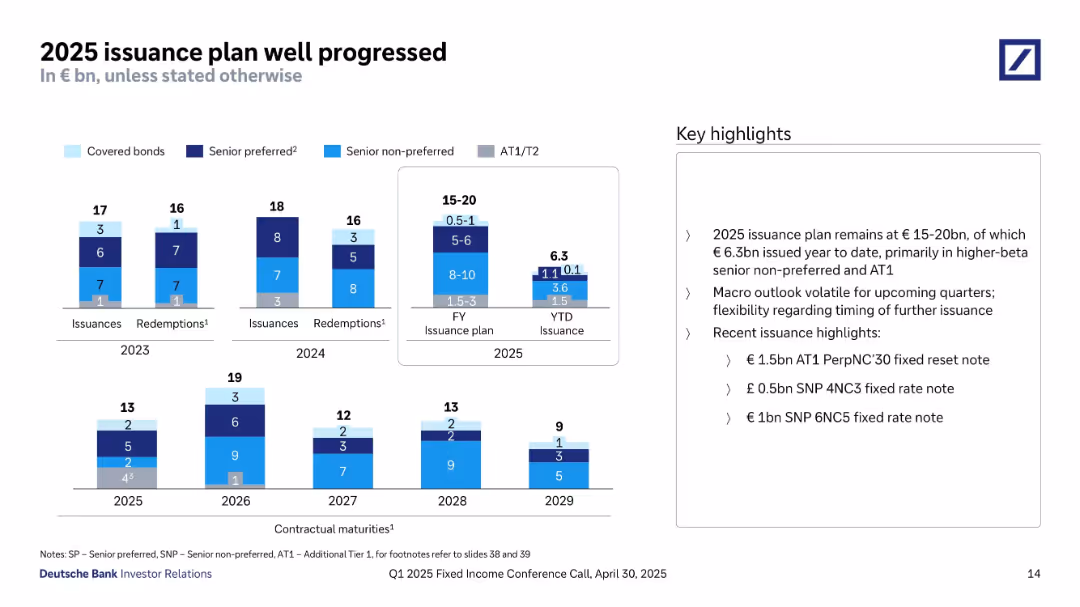
Multiple stacked bar charts show annual and YTD issuances, redemptions, and contractual maturities for various bond types through 2029. Uses color-coded categories and a central summary chart. Highlights on the right summarize plans and recent transactions.
Strategic Planning
Financial Services
The slide shows Deutsche Bank’s 2025 issuance plan (€15–20bn), of which €6.3bn has been issued, primarily in higher-beta senior non-preferred and AT1. It breaks down issuance and redemption by bond type over recent years, with a forward look at future maturities. Highlights mention recent successful AT1 and SNP issuances and describe macro volatility as a consideration in timing future issuances.
issuance plan, senior preferred, senior non-preferred, AT1, T2, redemptions, bond maturities, fixed rate
Mixed Chart
Deutsche Bank
Saved
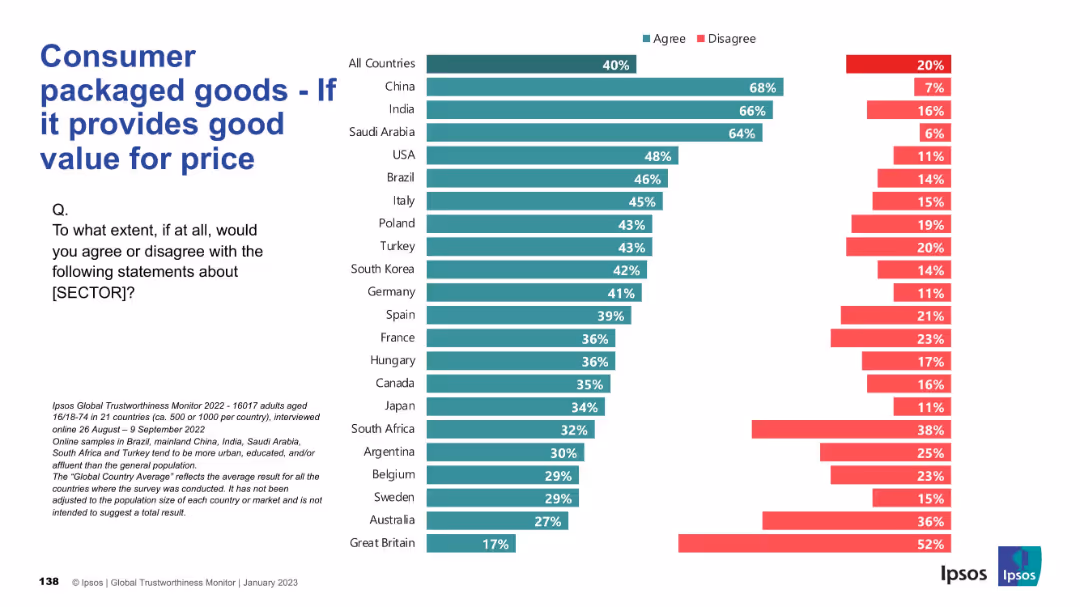
Value perception chart comparing agreement rates that CPG products offer good value for money across countries.
Pricing Strategies
Consumer Goods
This slide shows public agreement/disagreement with the idea that the CPG sector offers good value for money, a key factor in pricing strategy evaluation.
pricing, value, perception, affordability, CPG, trust, Ipsos, consumer evaluation, international data
Mixed Chart
IPSOS
Saved
Timeline showing legislative milestones affecting the North Carolina Department of Transportation's financial balances, with brief descriptions and impacts noted under each legislative act.
Regulatory and Compliance
Government & Public Sector
Reviews the legislative history affecting the financial status of NCDOT, useful for discussions on public administration, finance, and policy making.
legislation, finance, government, NCDOT, impact
Linear Flow
McKinsey
Saved
The slide features a column chart illustrating global GHG emissions per sector in 2010 and the applicability of bioenergies in decarbonizing these sectors, including energy, industry, buildings, and transport.
Technology and Digital Transformation
Energy & Utilities
This slide highlights the potential of bioenergy to decarbonize various sectors, showing that bioenergy could address about 50% of global GHG emissions by applying it across energy, industry, buildings, and transport sectors.
GHG emissions, bioenergies, decarbonization, 2010, energy, industry, buildings, transport
Single Chart
Kearney
Saved
This slide features a header, body text, and four circular percentage indicators. Each indicator highlights consumer willingness to use technology-enhanced care methods such as genetic testing, wearable sensors, non-urgent care at retail locations, and personalized medications.
Technology and Digital Transformation
Healthcare & Pharmaceuticals
The slide discusses the openness of Irish consumers to adopt technology-enhanced care for personalized healthcare experiences. It emphasizes the willingness to use genetic testing, wearable sensors, and non-urgent care in retail settings.
healthcare, personalized care, technology, Ireland, genetic testing
Mixed Chart
EY
Saved
Slide with images and lists highlighting key players in FinTechs, Financial Institutions, and Telcos.
Competitive Landscape
Financial Services
Describes the competitive environment across FinTechs, financial institutions, and telecommunications.
competition, FinTech, financial institutions, telcos
Table
BCG
Saved
Slide presents a series of blue column charts tracking EBIT Margin Benefit from Cost Savings over several years.
Financial Performance
Consumer Goods
This slide demonstrates the company’s financial efficiency over time, highlighting consistent cost savings as reflected in EBIT margin improvements.
cost savings, EBIT margin, financial, yearly, analysis
Single Chart
Barclays
Saved
Features a line graph depicting various business strategies companies are considering in response to COVID-19, like hiring freezes and salary reductions, overlaid with a large COVID-19 virus image for impact.
Human Resources and Talent Management
Professional Services
Explores how companies plan to adapt their talent strategies in light of the pandemic, with a focus on reducing costs. Useful for HR and strategic planning.
COVID-19, talent acquisition, business strategy, cost reduction, planning
Single Chart
McKinsey
Saved
Previous
Next
If nothing, comes up, please save your slides first
Create a FREE account to continue browsing
Receive Instant Access to 1,000+ slides from companies like McKinsey, Google, and Goldman Sachs
First Name
Last Name
Email
Password
I agree to all
Terms & Privacy Policy
Thank you! Your submission has been received!
Oops! Something went wrong while submitting the form.
Have an account?
Sign in
Column Chart
Heatmap
Chevron
Org Chart
Infographic
Callouts
Timeline
List
Graphic
Picture
Process Flow
Diagram
Paragraph
Map
Table
Framework
Subtitle
Takeaway Box
Icon
Other Chart
Radar Chart
Waterfall Chart
Mekko Chart
Pie Chart
Scatter Plot
Line Chart
Bar chart
Bullet points