My Account
My Slides
Search by Category
Templates
View All Templates
Download Template Slides
Leave Feedback
Login
Logout
Get Started
Browse all Slides
Browse all Slides
Create a FREE Account
Instant access to 1,000+ real slides from top companies like McKinsey, BCG, Goldman Sachs, Google and many more!
First Name
Last Name
Email
Password
I agree to all
Terms & Privacy Policy
Thank you! Your submission has been received!
Oops! Something went wrong while submitting the form.
Have an account?
Sign in
Saved Slides
The slide is divided into six sections, each describing different services PwC offers: acquisition strategy, M&A advisory, operational assessment, tax support, post-acquisition support, and value identification.
Strategic Planning
Professional Services
The slide outlines PwC's comprehensive service offerings to support clients before, during, and after deals. Services include strategy development, M&A advisory, operational improvements, tax and legal support, and post-acquisition integration.
PwC, services, strategic planning, advisory, support
Pillar
PwC/Strategy&
Saved
The slide features a pie chart and several smaller charts detailing the investment focus on cloud security, cyber resilience, and related initiatives.
Risk Assessment and Management
Technology & Software
The slide discusses the increasing investment in cybersecurity, highlighting cloud security and cyber resilience as top priorities for organizations.
cybersecurity, cloud security, resilience, data privacy, cyber initiatives
Multiple Chart
EY
Saved
This slide contains a set of mini column charts and descriptive statistics detailing the performance of various regions in Asia, Europe, and the Americas.
Market Analysis and Trends
Consumer Goods
Discusses the luxury goods market performance in various regions, emphasizing Asia's growth and challenges in Europe and America due to socio-political issues.
Regional analysis, Asia, Europe, Americas
Mixed Chart
Bain
Saved
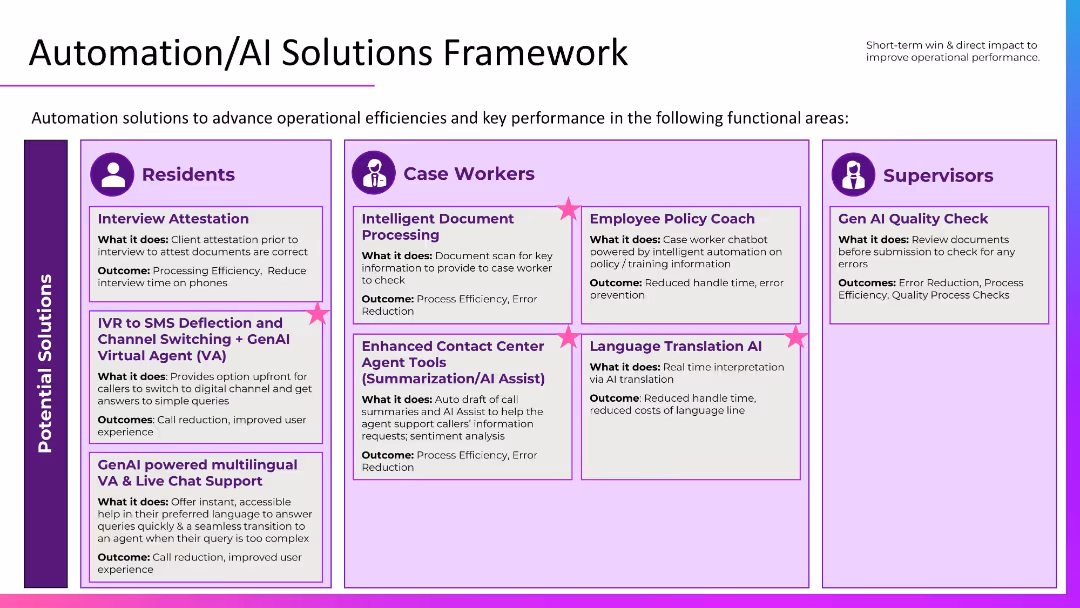
Grid layout segmented by audience: Residents, Case Workers, Supervisors. Uses icons and callouts with bolded titles and outcomes in purple boxes.
Operational Efficiency
Government & Public Sector
Outlines AI-based automation solutions targeted at residents, case workers, and supervisors. Use cases include virtual agents, document processing, policy coaching, and translation AI, each aiming to improve efficiency, reduce errors, and enhance the user experience.
automation, AI framework, GenAI tools, public services, efficiency
Table
Accenture
Saved
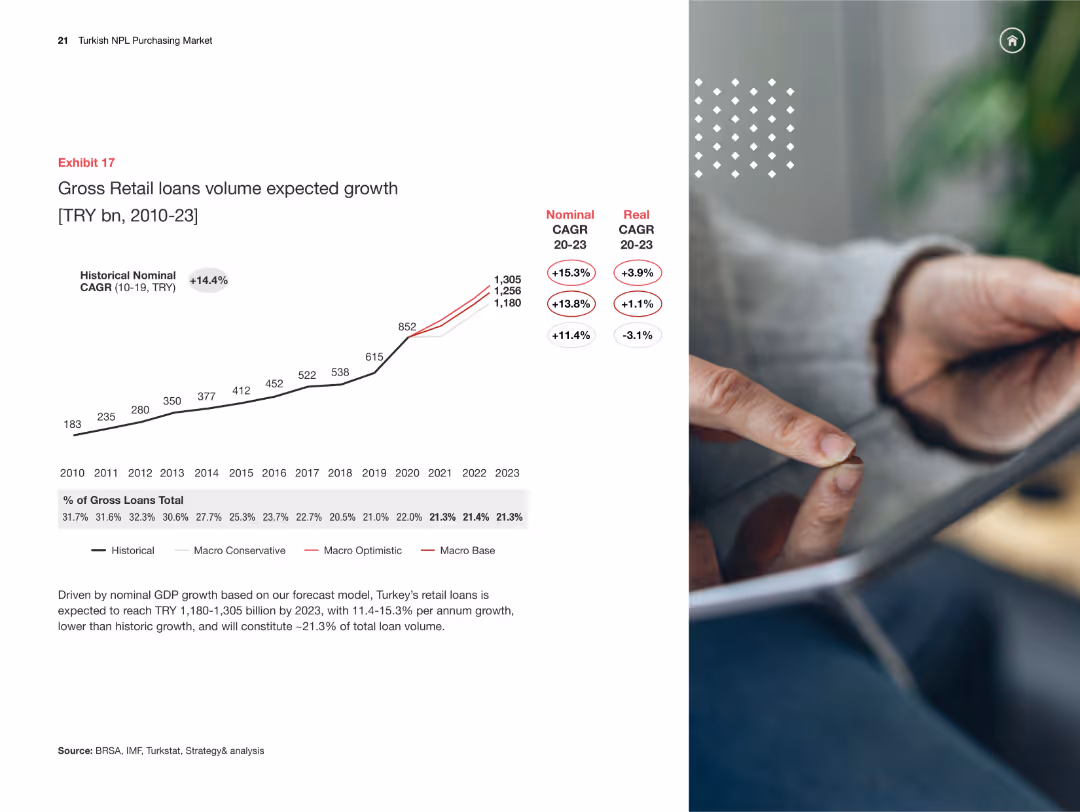
Line chart predicting gross retail loans volume growth from 2010-2023, with various growth scenarios.
Market Analysis and Trends
Financial Services
The slide projects the growth of retail loan volumes in Turkey from 2010-2023, analyzing different growth rates and economic conditions.
retail loans, growth forecast, macroeconomic analysis, financial trends, Turkey
Mixed Chart
PwC/Strategy&
Saved
A large pie chart on the left and a bar graph on the right against a purple background with descriptive text boxes.
Strategic Planning
Telecommunications
Examines how the nbn™ network aligns with user values, indicating a significant agreement on its positive impact on their lives.
user values, nbn network, life impact, agreement percentage, life goals, value alignment, network benefits, survey data
Multiple Chart
Accenture
Saved
Clean layout with bullet points and icons representing various strategic opportunities. Each opportunity is numbered and comes with a brief description.
Market Analysis and Trends
Financial Services
Focuses on identifying latent opportunities within the Limpa Nome framework, such as improving money flow, marketing efficiency, and market expansion.
Strategy, opportunities, efficiency
Header Vertical
Barclays
Saved
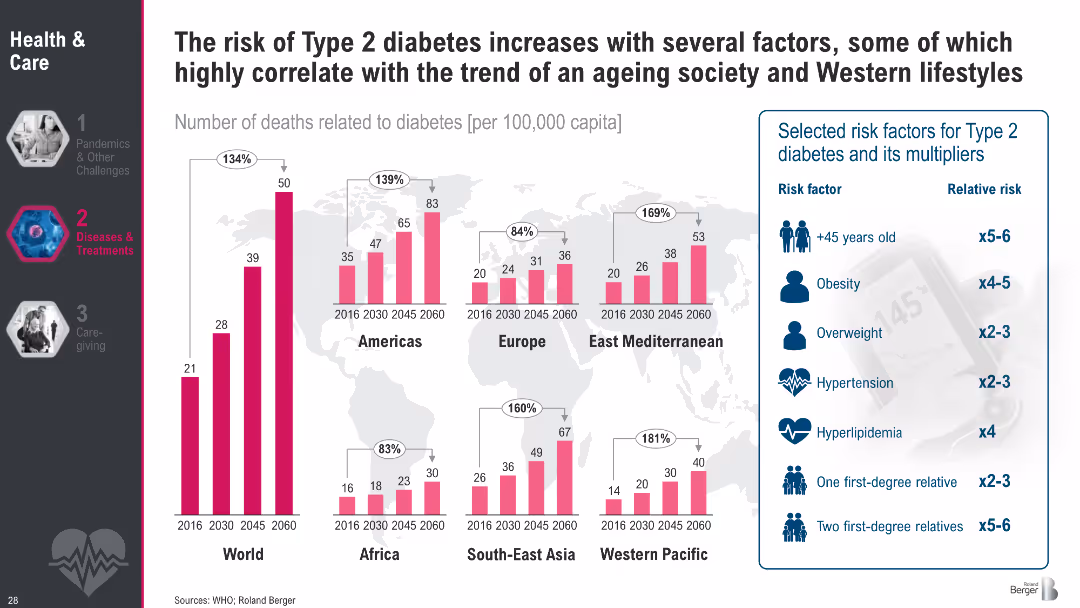
Regional bar charts showing diabetes death rates (2016–2060); sidebar lists key risk factors with relative risks
Risk Assessment and Management
Healthcare & Pharmaceuticals
This slide illustrates the correlation between Type 2 diabetes mortality and contributing risk factors such as age, obesity, and hypertension. It highlights regional trends and emphasizes how modern lifestyles amplify diabetes risk.
Type 2 diabetes, obesity, aging, risk factors, hypertension, mortality, lifestyle diseases, public health, metabolic disorders
Multiple Chart
Roland Berger
Saved
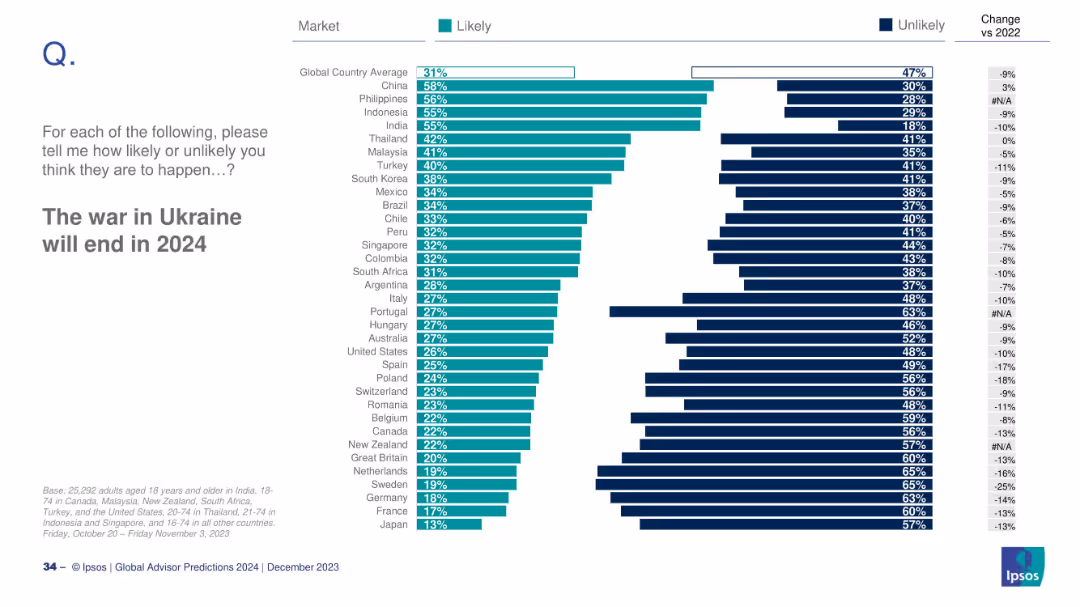
Bar chart showing global likelihood ratings by country; right side displays change from 2022.
Strategic Planning
Government & Public Sector
This slide presents the perceived likelihood of the Ukraine war ending in 2024. China and the Philippines express the most optimism, while Japan and France are among the least optimistic. The slide includes year-over-year shifts in public sentiment.
Ukraine war, geopolitics, global opinion, 2024 prediction, survey, conflict resolution
Mixed Chart
IPSOS
Saved
Stacked bar graph showing the expected personalization approach across industries, with a focus on the move away from mass production.
Market Analysis and Trends
Retail & E-commerce
Details the shift towards personalization in industry product strategies by 2026, signaling a move away from solely mass-produced goods.
Industry Trends, Personalization, Mass Production, Strategic Planning, Bar Graph
Single Chart
Kearney
Saved
This slide contains a series of column charts and a bar chart representing mobility pattern changes globally and for various countries (US, UK, Germany, France, Italy, China, Japan) during three survey waves. The column charts use shades of blue to indicate degrees of mobility increase, and grey for decrease. Each country's flag is shown for identification.
Market Analysis and Trends
Transportation & Logistics
The slide examines the changes in travel frequency and trip length among global respondents since COVID-19, highlighting recovery signs in specific markets.
mobility trends, COVID-19 impact, global survey, travel patterns, market analysis, data visualization, recovery tracking, comparative analysis
Multiple Chart
McKinsey
Saved
Slide includes a column chart projecting revenue growth and other financial metrics through 2025.
Financial Performance
Transportation & Logistics
Analyzes past performance and future projections of revenue growth influenced by global market trends.
revenue growth, financial projections, market trends, electrification, automotive industry
Single Chart
Deutsche Bank
Saved
Features column charts comparing graduates in technology-related fields versus business administration across Brazil, the US, Germany, Estonia, and India. Each country's flag is displayed above the respective columns.
Human Resources and Talent Management
Education & Training
Focuses on the proportion of tech to non-tech graduates in various countries, highlighting Brazil's large disparity. Useful for discussions on educational reforms or workforce development strategies.
education, Brazil, tech talent, graduates, comparison
Single Chart
McKinsey
Saved
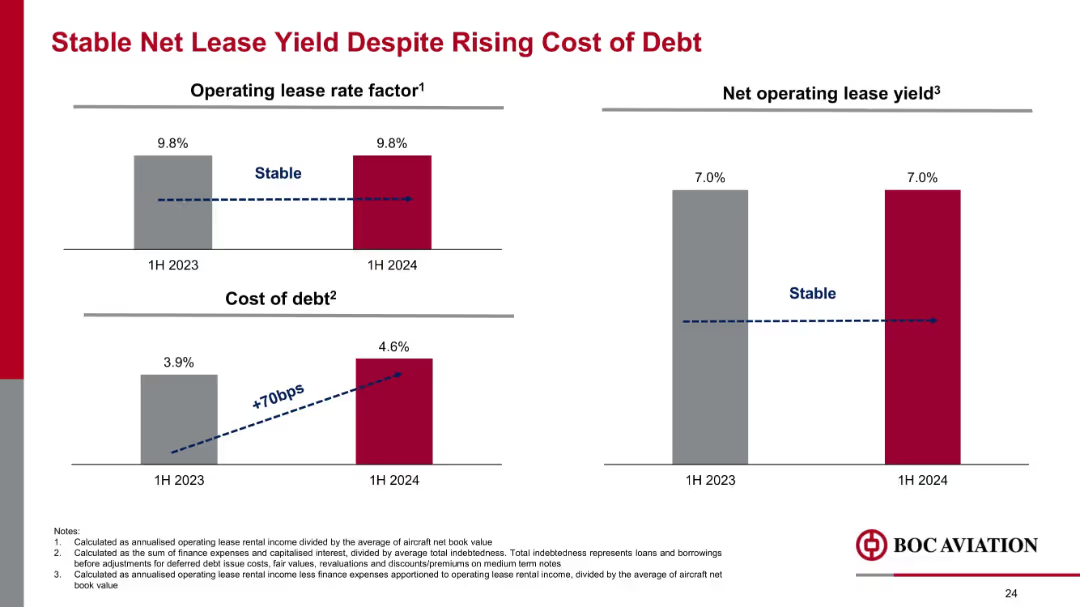
Two-panel financial bar chart layout; includes visual trend indicators with dotted arrows; red and grey palette
Financial Performance
Financial Services
Despite a 70bps increase in the cost of debt from 3.9% to 4.6%, BOC Aviation maintained a stable lease rate factor and net operating lease yield at 9.8% and 7.0% respectively between 1H 2023 and 1H 2024.
lease yield, debt cost, operating lease, financial stability, aviation, finance expense, lease rate, 1H 2024
Single Chart
Goldman Sachs
Saved
The slide features flowcharts with different stages of a customer journey in car buying. It integrates text blocks with directional arrows.
Industry Overview
Technology & Software
This slide visualizes the customer journey in car buying, highlighting market understanding, customer acquisition, risk management, and relationship enhancement as key stages, aimed at optimizing customer experience.
customer journey, car buying, market understanding, risk management, relationship building
Linear Flow
Barclays
Saved
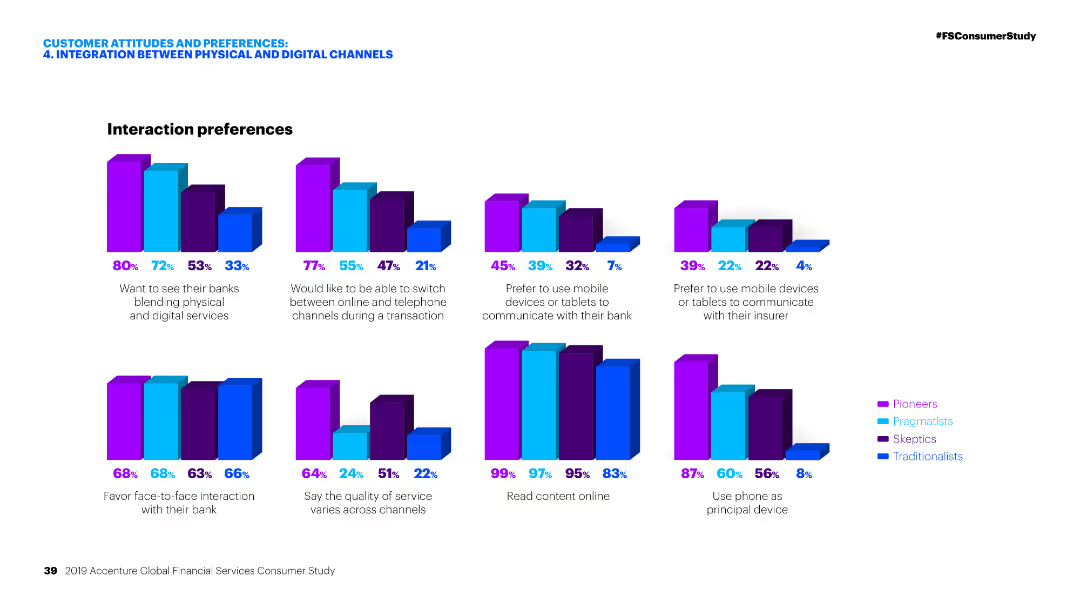
Multiple column charts depicting interaction preferences of different customer segments in banking and insurance contexts.
Customer and Market Segmentation
Financial Services
This slide presents various interaction preferences of customers when engaging with financial services, emphasizing the integration between physical and digital channels.
Interaction preferences, Financial services, Digital channels, Banking, Insurance
Multiple Chart
Accenture
Saved
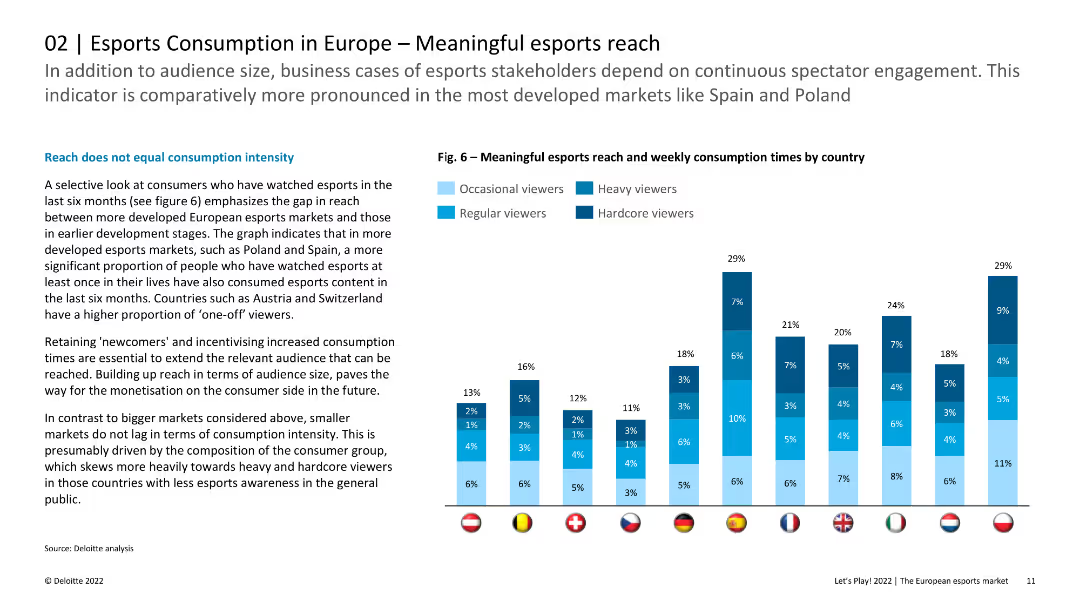
The slide includes a column chart illustrating meaningful esports reach and weekly consumption times by country. The layout is informative with clear data presentation.
Market Analysis and Trends
Media & Entertainment
The slide analyzes the reach of esports content in Europe, emphasizing that larger markets show higher consumption intensity. It highlights the importance of retaining new viewers and incentivizing increased consumption times for monetization.
Esports, Reach, Consumption, Europe, Audience
Mixed Chart
Deloitte
Saved
Features a bar graph with different industries represented by colored bars, indicating the percentage breakdown of survey respondents.
Market Analysis and Trends
Media & Entertainment
Provides an industry breakdown of survey participants, which can be used for analyzing market distribution and consumer segments.
Industry Breakdown, Survey Respondents, Market Distribution, Consumer Segments, Percentage Breakdown
Single Chart
Kearney
Saved
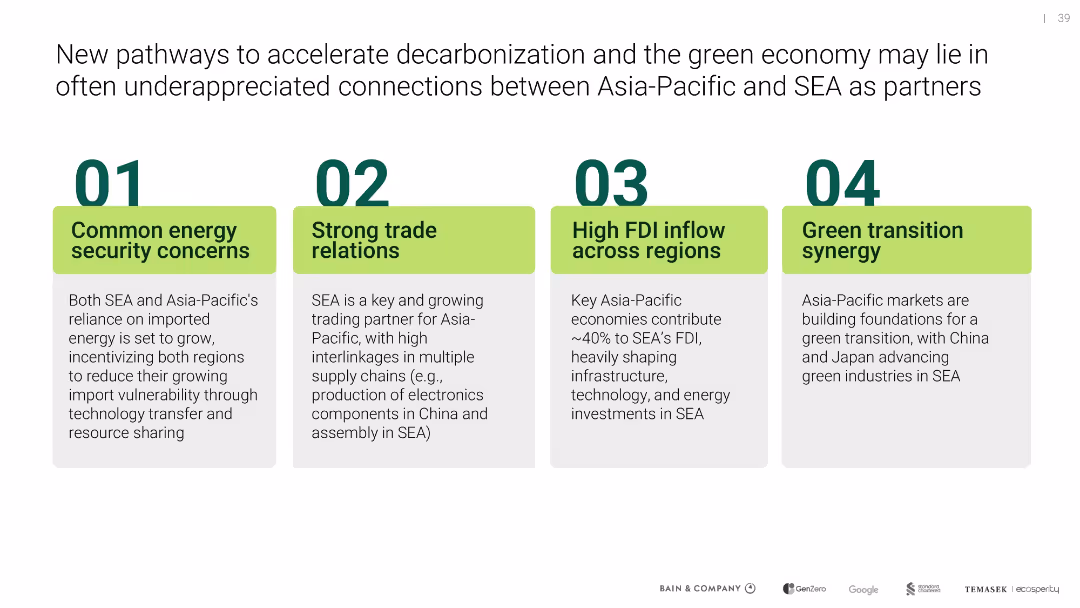
Four-column layout with green-highlighted section headers, icons, and explanatory text in blocks
Strategic Planning
Environmental Services & Sustainability
The slide outlines four underappreciated synergies between Asia-Pacific and Southeast Asia that can accelerate decarbonization, including energy security, trade relations, FDI inflow, and green transition alignment.
decarbonization, energy security, FDI, trade, green transition, SEA, APAC
Uncategorized
Bain
Saved
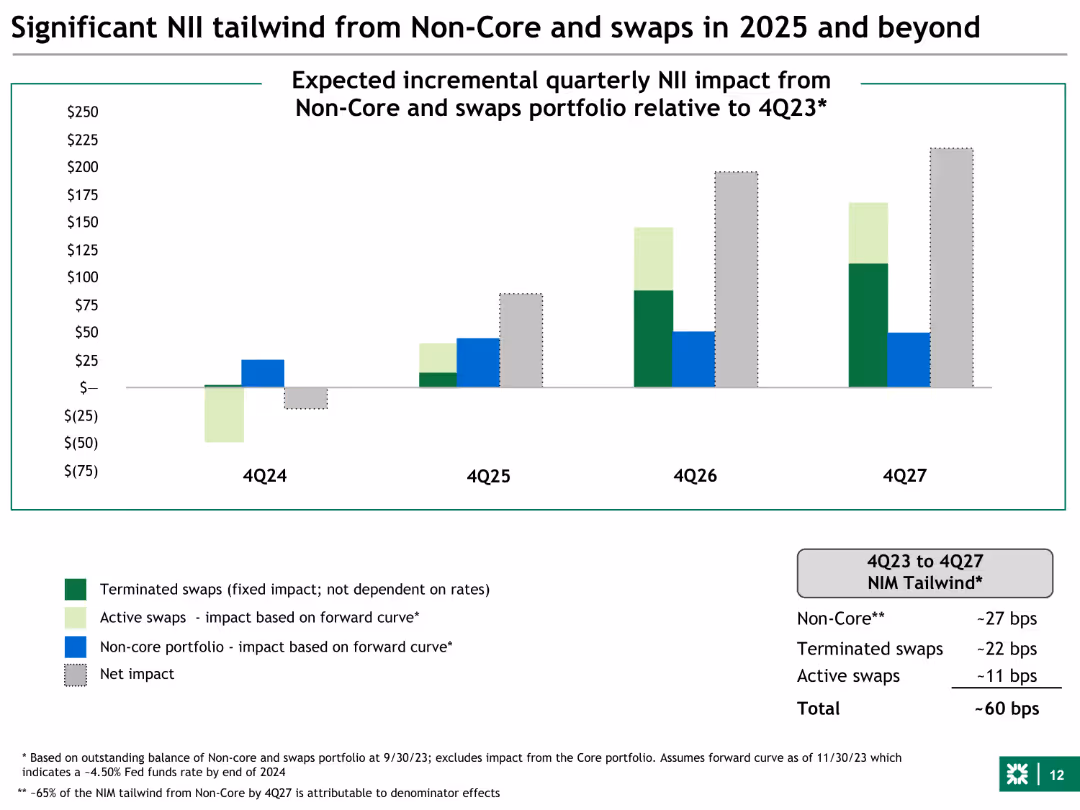
The slide features a column chart with four sets of bars representing expected quarterly NII impacts from non-core and swaps portfolios relative to 4Q23, spanning from 4Q24 to 4Q27. The bars are color-coded for terminated swaps, active swaps, non-core portfolio, and net impact.
Financial Performance
Financial Services
This slide shows the projected quarterly NII (Net Interest Income) impact from non-core and swaps portfolios for the years 2025 to 2027. It is used to illustrate the financial benefits of maintaining these portfolios, highlighting the substantial positive effects on the overall financial performance.
NII, non-core, swaps, financial performance, projections, 2025, 2026, 2027, portfolio, impact
Mixed Chart
Goldman Sachs
Saved
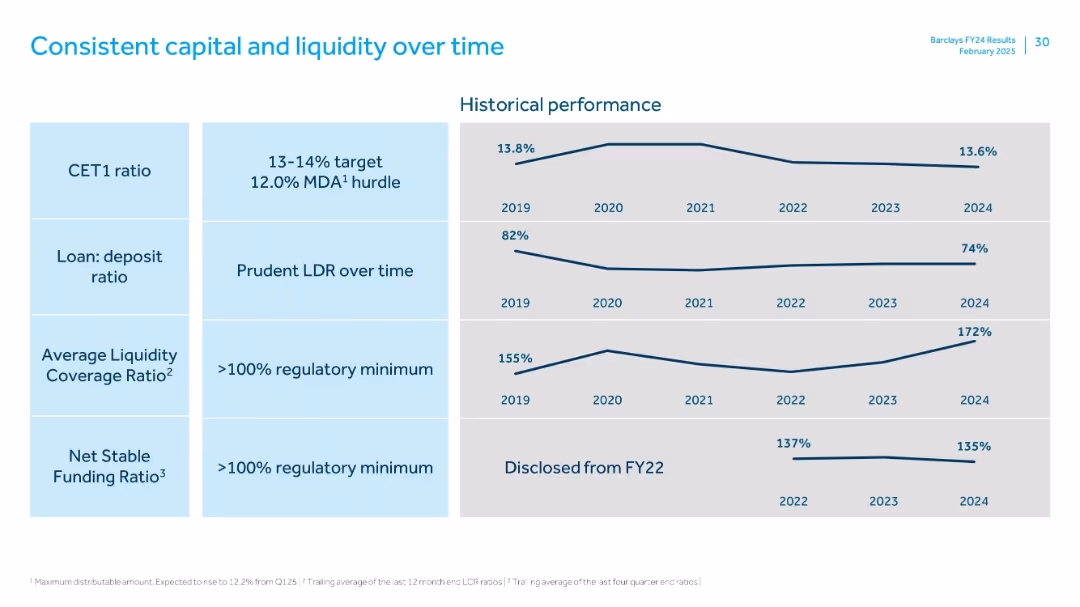
Grid layout with four metrics: CET1 ratio, loan:deposit ratio, liquidity coverage ratio, and funding ratio. Each metric has a trend line from 2019–2024.
Regulatory and Compliance
Financial Services
The slide highlights long-term stability in Barclays' capital and liquidity metrics. CET1 ratio stays within target range; LDR remains conservative; liquidity and funding ratios consistently exceed regulatory minimums.
CET1, LDR, LCR, NSFR, capital, liquidity, funding, 2024 trends
Single Chart
Barclays
Saved
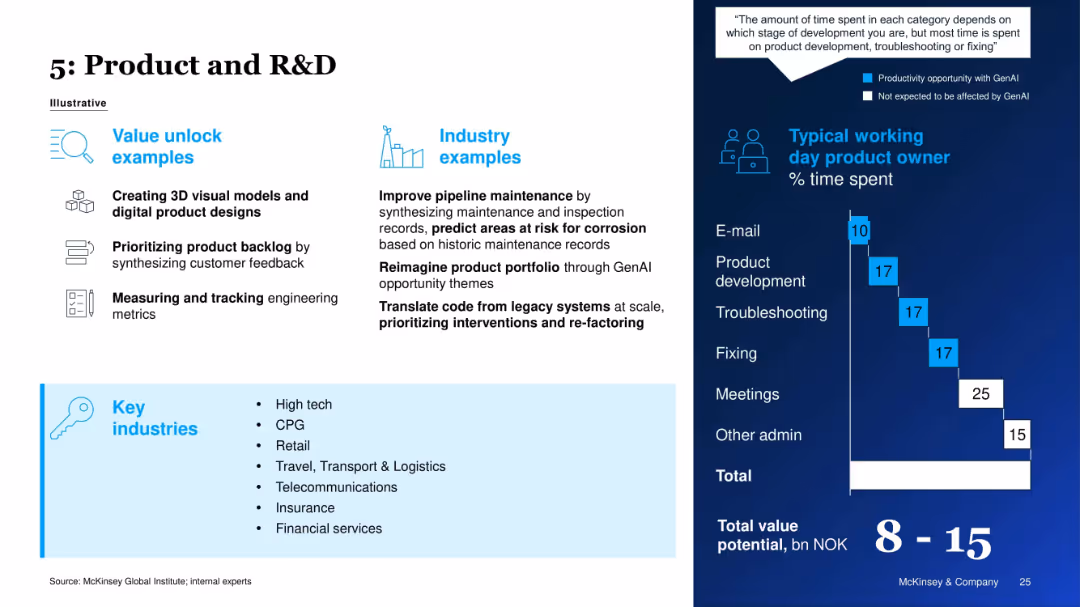
Layout shows value unlock examples and industry relevance on left; right visualizes product owner’s time usage.
Product and Service Analysis
Technology & Software
The slide explains GenAI's potential in product development and R&D, such as creating visual models, prioritizing backlogs, and translating legacy code. A daily activity breakdown for a product owner emphasizes GenAI’s role in development and troubleshooting.
R&D, Product Development, GenAI, Backlog Management, AI in Engineering, Tech Industry, Time Distribution, Innovation
Mixed Chart
McKinsey
Saved
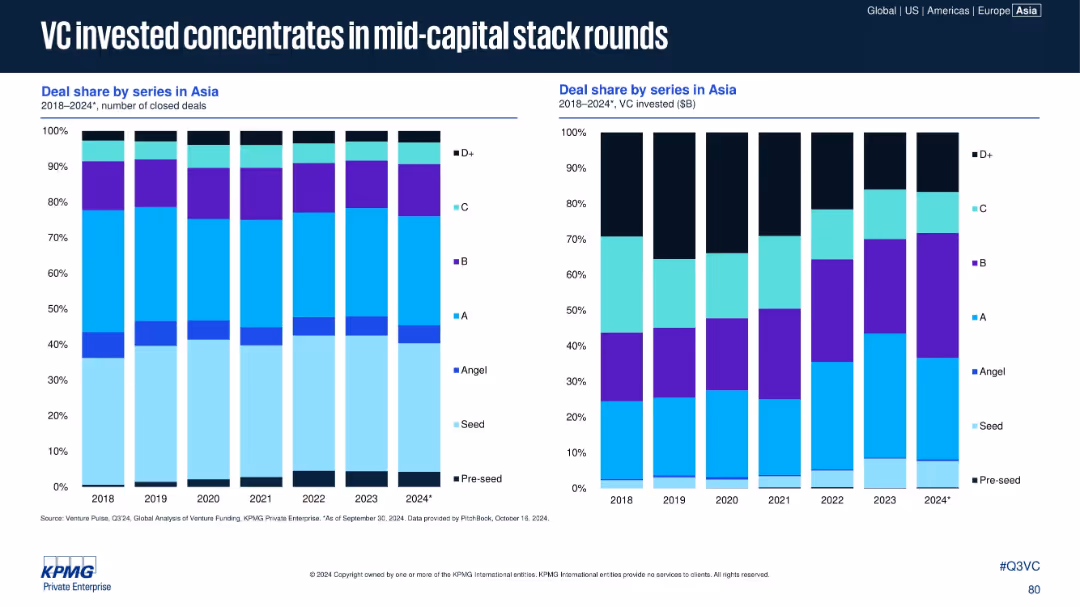
Two stacked bar charts: left for number of closed deals by series; right for VC invested ($B). Color-coded by series (Pre-seed to D+).
Customer and Market Segmentation
Financial Services
Depicts how venture investment in Asia from 2018–2024 has shifted toward mid-stage funding rounds (Series A–C). Although early-stage deals remain numerous, the bulk of capital now concentrates in mid-capital stack investments.
Series Share, VC Investment, Asia, Deal Share, Mid-stage, Series A-C, 2024
Multiple Chart
KPMG
Saved
The slide is divided into two sections: a detailed text on the left discussing CFO roles, and a column chart on the right showing the importance of various roles to CFOs' success.
Strategic Planning
Professional Services
The slide highlights the evolving role of CFOs as strategic partners, detailing how they contribute to setting company direction and the importance of their relationships with other business leaders.
strategy, CFO, CEO, business, board, roles, importance, success, direction, strategic partner
Mixed Chart
Deloitte
Saved
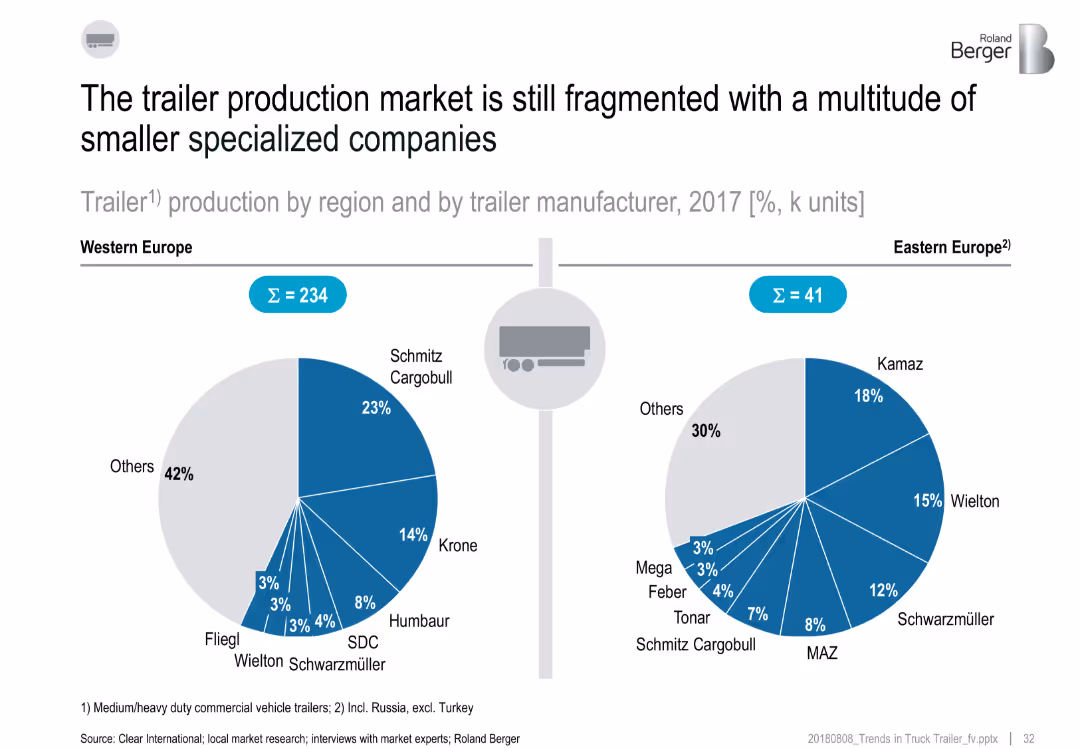
Split layout with two pie charts comparing trailer production market shares (2017) in Western and Eastern Europe; includes manufacturer names and percentages
Market Analysis and Trends
Transportation & Logistics
This slide compares the trailer manufacturing landscape in Western and Eastern Europe. Western Europe shows more dominance by major players like Schmitz Cargobull and Krone, while Eastern Europe is slightly less fragmented. Both regions show a high share of production by "Others," highlighting a fragmented market with many smaller manufacturers.
trailer production, market fragmentation, Western Europe, Eastern Europe, manufacturers, 2017, Schmitz, Krone, Kamaz
Multiple Chart
Roland Berger
Saved
Previous
Next
If nothing, comes up, please save your slides first
Create a FREE account to continue browsing
Receive Instant Access to 1,000+ slides from companies like McKinsey, Google, and Goldman Sachs
First Name
Last Name
Email
Password
I agree to all
Terms & Privacy Policy
Thank you! Your submission has been received!
Oops! Something went wrong while submitting the form.
Have an account?
Sign in
Column Chart
Heatmap
Chevron
Org Chart
Infographic
Callouts
Timeline
List
Graphic
Picture
Process Flow
Diagram
Paragraph
Map
Table
Framework
Subtitle
Takeaway Box
Icon
Other Chart
Radar Chart
Waterfall Chart
Mekko Chart
Pie Chart
Scatter Plot
Line Chart
Bar chart
Bullet points