My Account
My Slides
Search by Category
Templates
View All Templates
Download Template Slides
✦ AI Search
Feedback
Login
Logout
Get Started
Browse all Slides
Browse all Slides
Create a FREE Account
Instant access to 1,000+ real slides from top companies like McKinsey, BCG, Goldman Sachs, Google and many more!
First Name
Last Name
Email
Password
I agree to all
Terms & Privacy Policy
Thank you! Your submission has been received!
Oops! Something went wrong while submitting the form.
Have an account?
Sign in
Saved Slides
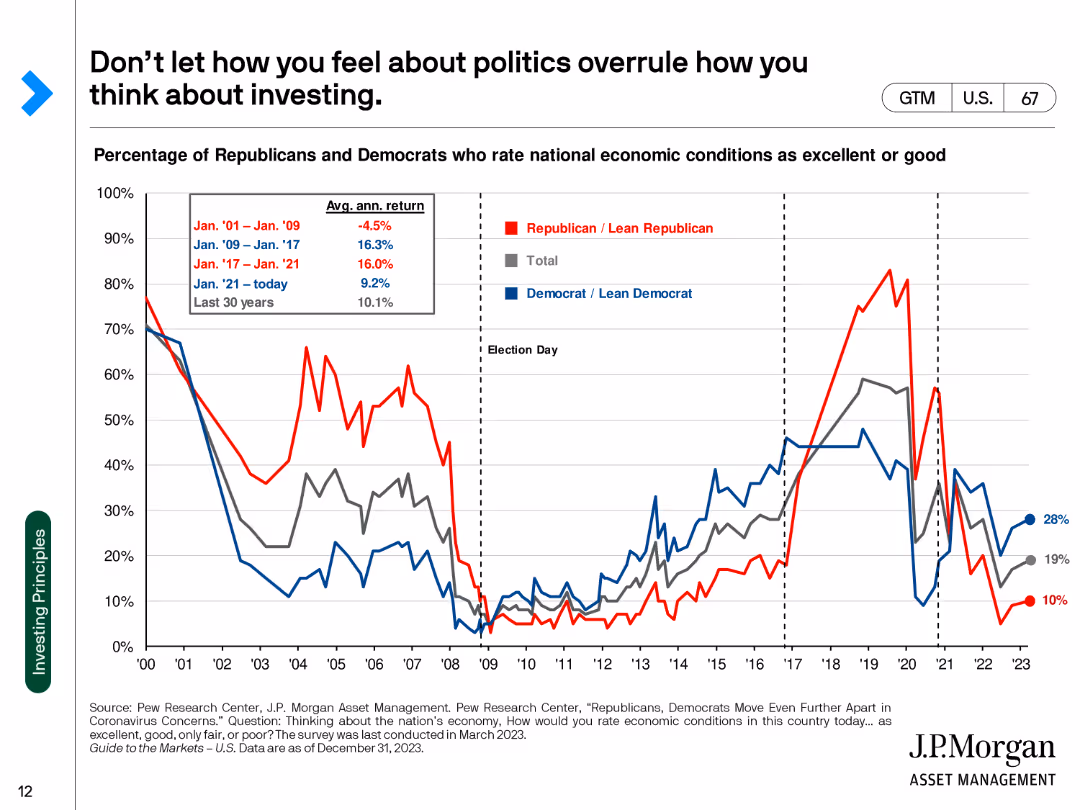
The slide contains a line chart showing the percentage of Republicans and Democrats who rate national economic conditions as excellent or good from 2000 to 2023.
Market Analysis and Trends
Financial Services
This slide analyzes the correlation between political affiliation and perception of national economic conditions, emphasizing that investment decisions should not be influenced by political biases.
Politics, Investing, Economic Conditions, Perception, Analysis
Single Chart
JP Morgan
Saved
A table with rows for different financial services and columns showing rankings in EMEA, Asia Pacific, and Latin America.
Market Analysis and Trends
Financial Services
Highlights Goldman Sachs' rankings across various financial services sectors globally, emphasizing its leading market position.
Goldman Sachs, Investment Banking, Global Markets, EMEA, Asia Pacific, Latin America, Market Position
Table
Goldman Sachs
Saved
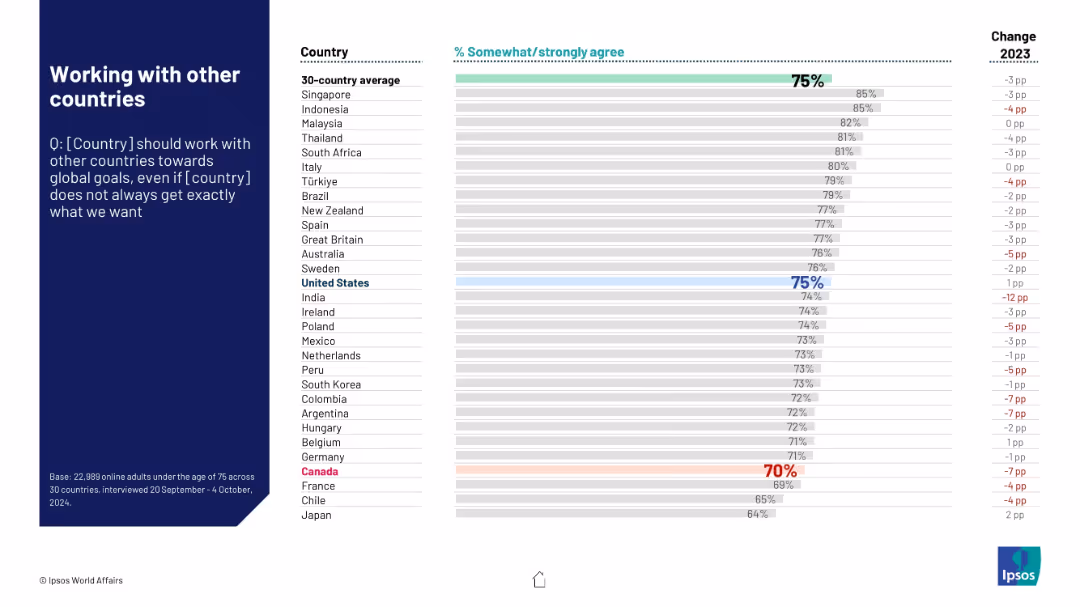
Similar layout. Assesses support for global cooperation even without perfect outcomes. Canada shown near bottom.
Strategic Planning
Government & Public Sector
Evaluates international attitudes toward cooperation with other nations on global issues. Despite some skepticism, most countries show strong support. Canada's support is relatively low at 70%.
global cooperation, diplomacy, international policy, strategic alignment, Ipsos research
Mixed Chart
IPSOS
Saved
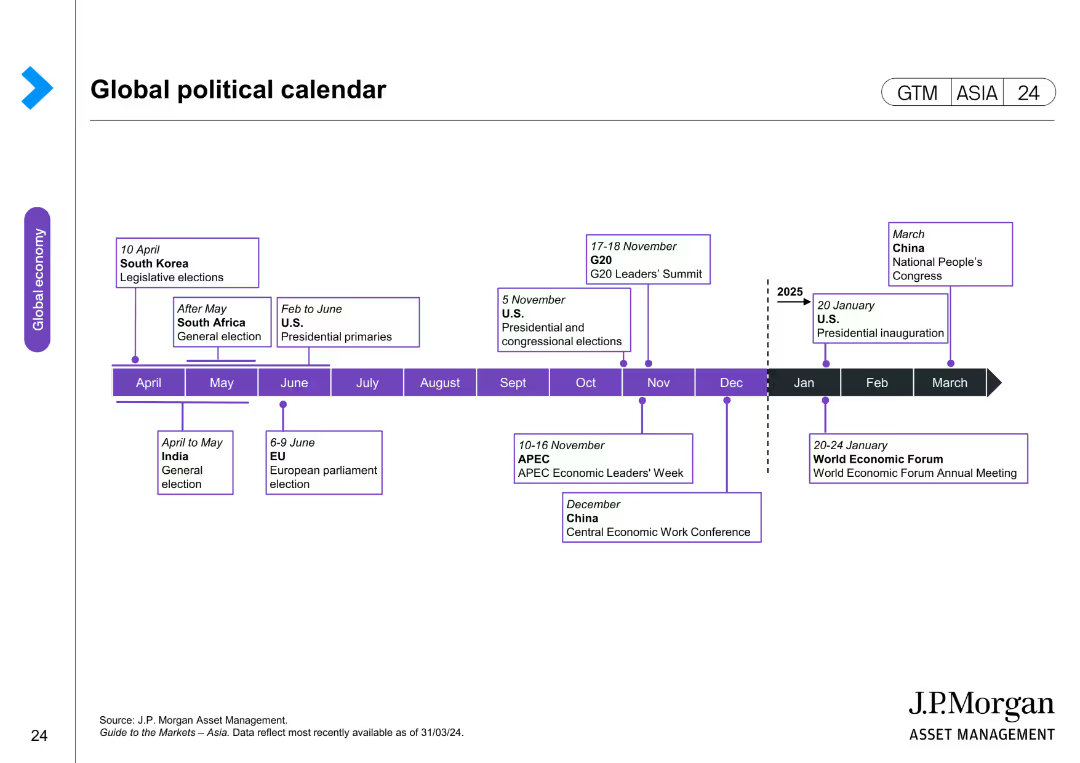
The slide displays a timeline with key global political events, including elections and summits, marked on a monthly basis. Events are categorized by country and type, with brief descriptions of each.
Strategic Planning
Government & Public Sector
The slide outlines a global political calendar, highlighting important political events and their timelines. It is used for strategic planning and understanding geopolitical impacts on markets.
political events, global timeline, elections, summits, geopolitical analysis, strategic planning, government calendar
Linear Flow
JP Morgan
Saved
A bar graph slide with horizontal bars of varying lengths indicating levels of focus on different types of work and collaboration. The background is clean, allowing the graph and the descriptive text on the left to stand out. The use of grayscale with selective yellow highlights creates visual interest.
Organizational Structure and Change
Professional Services
This slide examines shifts in collaboration and independent work trends over the past two years. It employs a bar graph to display the proportionate change in focus, serving as an analytical tool for companies reassessing their collaborative practices in light of remote and hybrid work experiences.
Collaboration, Trends, Remote Work, Hybrid Work, Organizational Change
Single Chart
EY
Saved
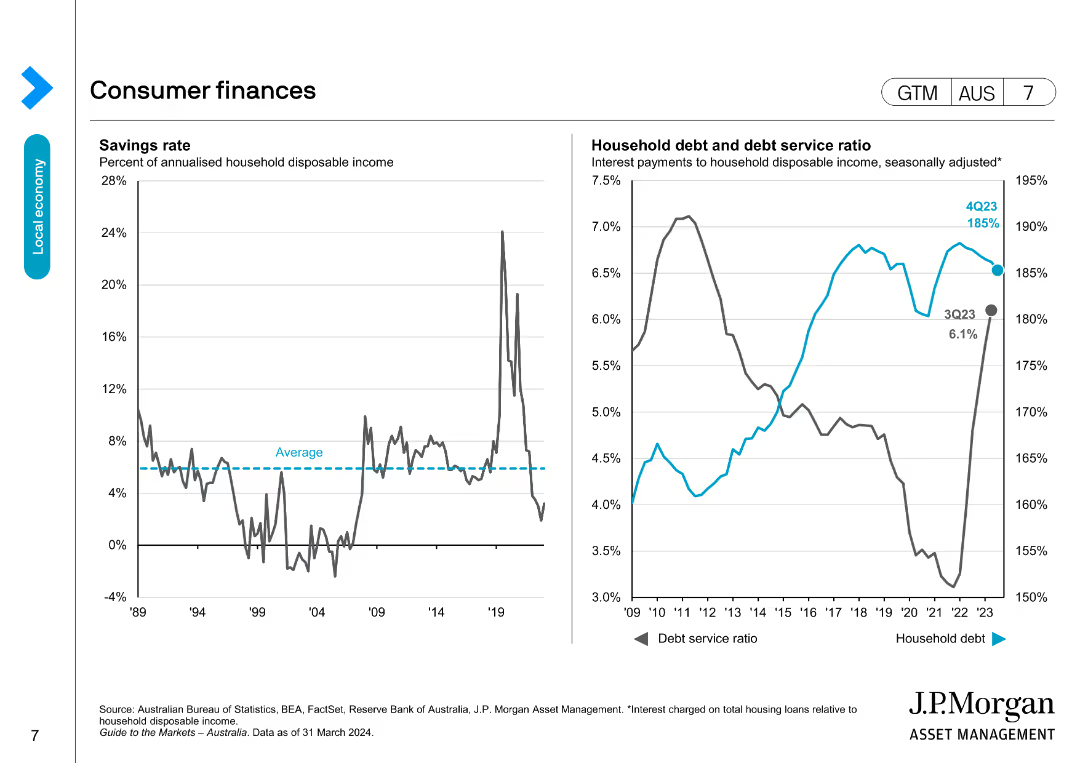
The slide includes a line chart of savings rates and a dual-axis line chart of household debt and debt service ratios, indicating financial health trends.
Market Analysis and Trends
Financial Services
This slide assesses consumer financial health in Australia by analyzing savings rates, household debt levels, and debt service ratios over time.
consumer finances, savings rate, household debt, debt service ratio, Australia
Multiple Chart
JP Morgan
Saved
Features dual graphs showing consumer confidence indices. The design is minimalistic, emphasizing the data through contrast against the white background.
Risk Assessment and Management
Financial Services
Discusses consumer sentiment as a significant economic indicator, pertinent for risk assessment in financial services. The slide's dual graphs provide a comparative look at consumer confidence in the US and EU, valuable for market sentiment analysis.
Consumer, Confidence, Index, Economy
Multiple Chart
Morgan Stanley
Saved
Features column charts, percentage change indicators, and key financial metrics highlighted in boxes. It contrasts Personal Banking & Wealth Management Results with specific highlights for easy comparison of year-over-year and quarter-over-quarter changes.
Financial Performance
Financial Services
This slide details the financial results of Personal Banking & Wealth Management, covering net income, revenues, credit costs, etc. It’s intended for financial reviews, investor relations, and management discussions, providing insights into sector performance and customer-focused financial strategies.
Wealth Management, Banking, Credit Costs, Revenue, Net Income
Mixed Chart
Citigroup
Saved
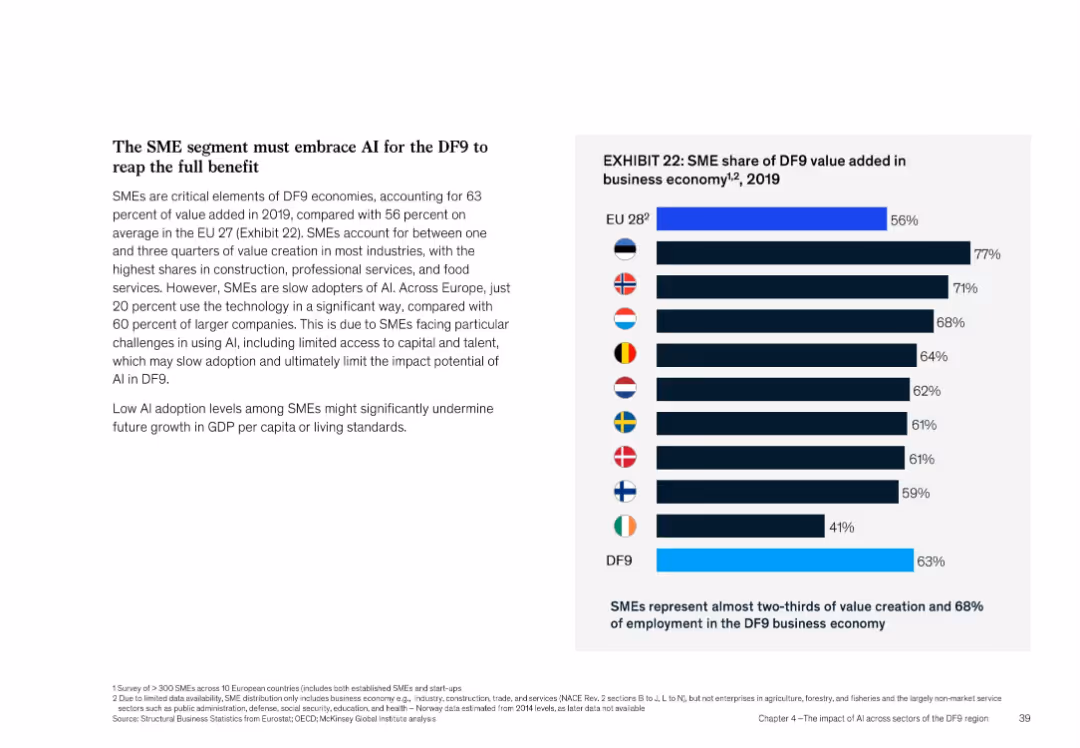
Bar chart comparing SME contribution in DF9 with EU countries, supported by narrative text on left
Organizational Structure and Change
Artificial Intelligence
Describes the role of SMEs in DF9 economies, highlighting their large contribution to value creation (63%) and employment (68%). Notes that SME AI adoption is low (~20%), which could hinder growth. Bar chart ranks SME contributions across EU nations.
SMEs, AI adoption, DF9, EU comparison, value creation, employment
Mixed Chart
McKinsey
Saved
This simple layout slide displays a three-point agenda, each with a title and sub-points, set against a backdrop of a molecular structure graphic.
Strategic Planning
Financial Services
The agenda outlines the main topics for the presentation, including an executive summary, financial and business details, and additional backup information.
Agenda, Executive Summary, Details, Backup
Agenda
Morgan Stanley
Saved
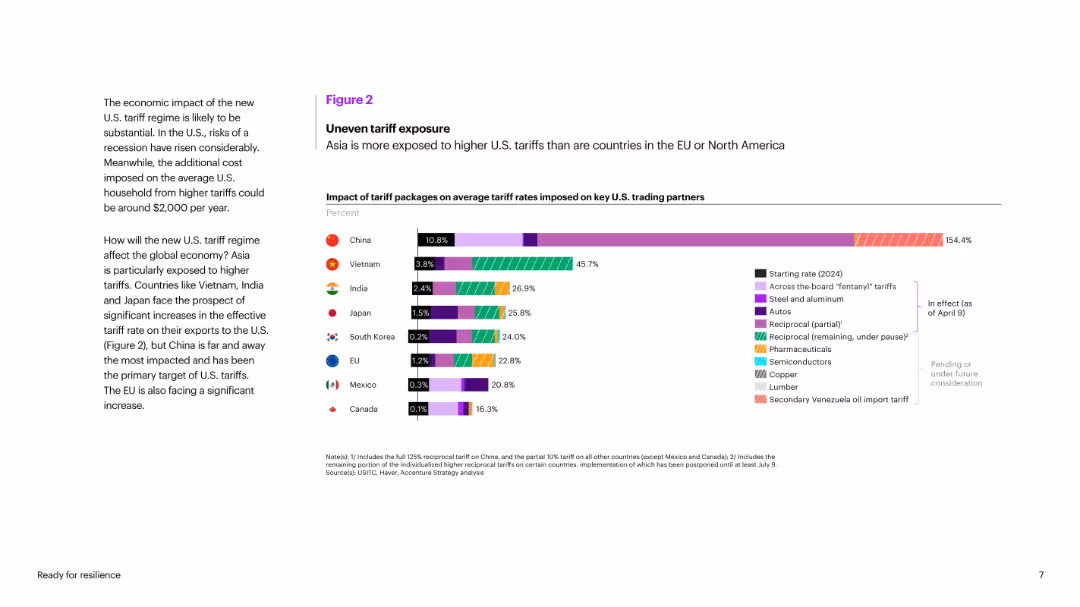
Bar chart comparing average tariff rate increases for key U.S. trading partners, color-coded by tariff category.
Risk Assessment and Management
Government & Public Sector
Illustrates asymmetric exposure of countries to U.S. tariffs, showing Asia is more affected than EU/North America. China faces the highest increase (154.4%), with Vietnam and India also highly impacted. Shows segmentation of tariffs across industries.
tariffs, China, trade exposure, Vietnam, India, trade war, U.S. partners, risk, import duties, policy impact
Mixed Chart
Accenture
Saved
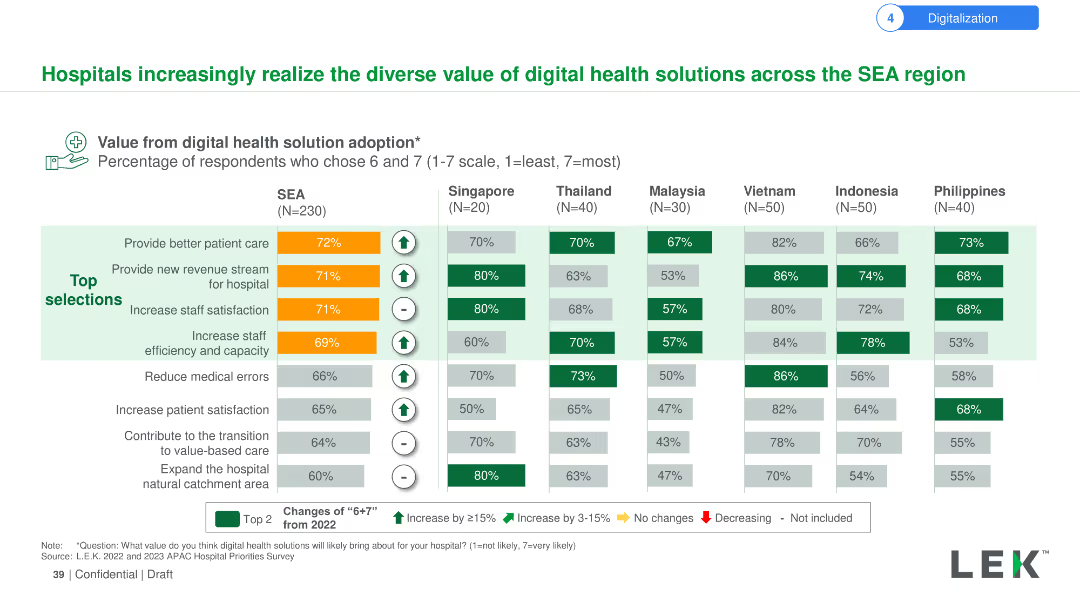
The slide uses a column chart to illustrate the perceived value from digital health solution adoption among hospitals in SEA, including better patient care, new revenue streams, and increased satisfaction. Percentages and trends are shown for multiple countries.
Technology and Digital Transformation
Healthcare & Pharmaceuticals
The slide presents the various benefits hospitals in SEA perceive from adopting digital health solutions, such as better patient care and new revenue streams. It compares these perceptions across different countries, highlighting key trends and changes from 2022.
Digital health, value, hospitals, SEA, patient care, revenue, satisfaction, adoption, countries, trends
Multiple Chart
LEK
Saved
Two columns of bulleted lists, contrasting elements of a strategy on the left and its impacts on the right.
Strategic Planning
Professional Services
Explains a strategic growth plan and its operational, technical, and market impacts.
Strategy, growth, performance, innovation, talent retention, market expansion
Header Horizontal
Booz Allen Hamilton
Saved
This slide features a bar chart showing the relevance of various SDGs among Danish executives, coupled with a key takeaway box emphasizing SDG 12, 8, 13, 9, and 3 as most relevant to businesses.
Market Analysis and Trends
Professional Services
The slide displays survey results from Danish executives highlighting the perceived relevance of SDGs to their businesses, emphasizing SDGs related to responsible production, economic growth, and climate action as most pertinent.
SDGs, survey, Danish executives, business relevance
Single Chart
McKinsey
Saved
This slide consists of several small graphics representing different financial contributions, alongside percentage comparisons for two consecutive years. The slide is visually balanced, with easy-to-understand icons and clear text descriptions.
Market Analysis and Trends
Financial Services
It outlines the shift in employee contributions to various savings and debt repayment plans, potentially serving as a discussion starter for financial planning trends and HR benefits design in the context of economic changes.
savings contributions, financial planning, employee behavior
Boxed
Goldman Sachs
Saved
Slide contains multiple infographics and text blocks summarizing key survey findings about global business services.
Strategic Planning
Professional Services
Discusses the main findings from a global business services survey, focusing on cost reduction and the role of ESG in business strategy.
business services, ESG, survey findings, cost reduction, infographics
Header Horizontal
Deloitte
Saved
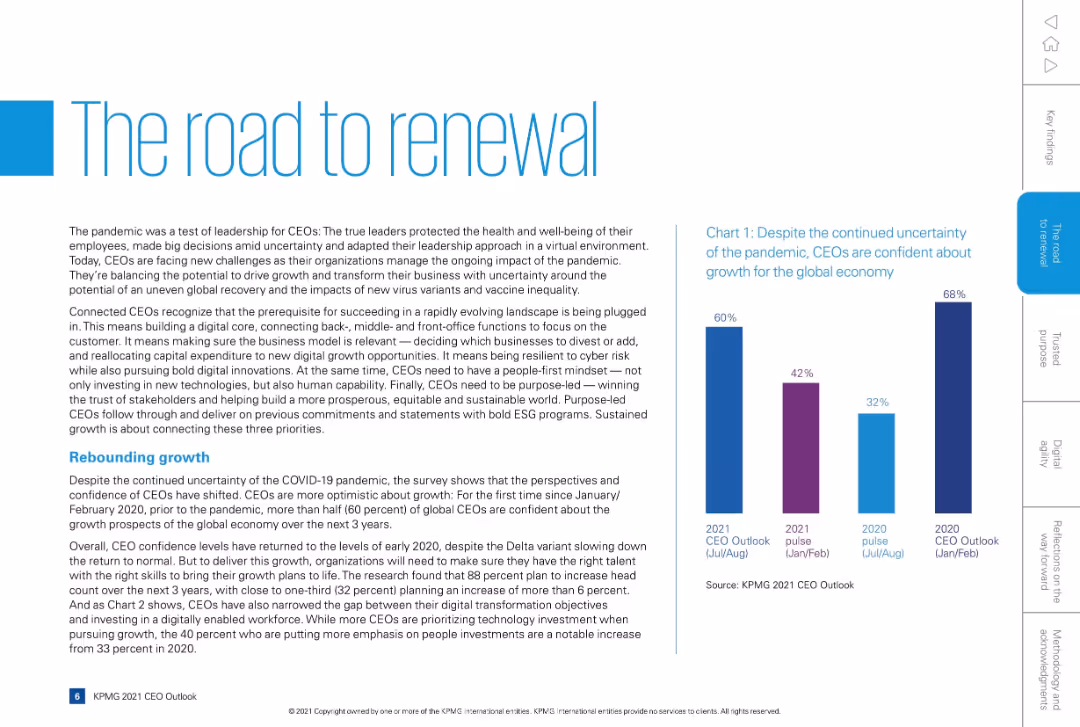
Two-column layout with large title on left, supporting text below, and a vertical bar chart on the right. Navigation tabs on the far right margin.
Strategic Planning
Professional Services
This slide discusses how CEOs have adapted to the pandemic by balancing growth opportunities with human and digital transformation. It emphasizes connected leadership, digital innovation, human capability, and ESG-driven purpose. A chart highlights rising CEO confidence in economic growth from 2020 to 2021.
CEOs, leadership, transformation, pandemic recovery, ESG, digital growth
Mixed Chart
KPMG
Saved
Bar chart showing agreement levels across countries on the need to increase national military spending due to global dangers. Same layout structure.
Risk Assessment and Management
Government & Public Sector
This slide reveals global sentiment on whether governments should invest more in military power given current global threats. Country-specific results are compared with the 30-country average and previous year's data.
military spending, global security, defense investment, public opinion, Ipsos, international threat, national defense, survey data, geopolitical risks
Mixed Chart
IPSOS
Saved
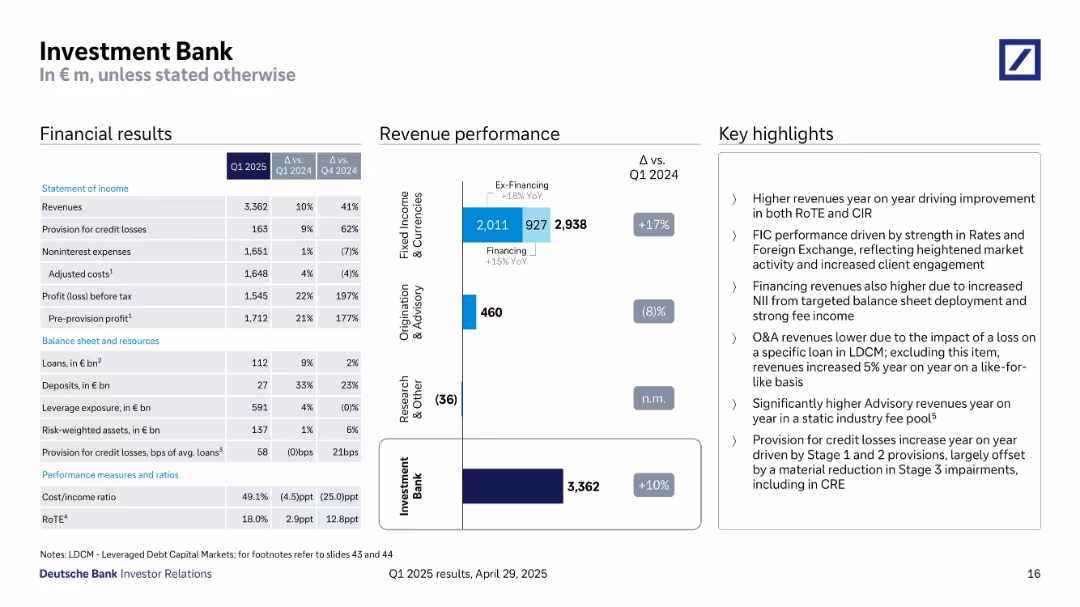
Similar layout as 18341: financials, revenue bar charts by segments, and key highlights.
Financial Performance
Financial Services
Q1 2025 financials for the Investment Bank show strong year-on-year revenue growth (+10%), improved RoTE (18%), and higher profit before tax (€1.55B). Key growth in Fixed Income & Currencies segment, while Origination & Advisory declined.
investment bank, fixed income, advisory, revenue growth, RoTE, credit loss, Q1 2025, client engagement
Mixed Chart
Deutsche Bank
Saved
This slide has a mix of text and data presentations, including a column chart and several key financial metrics listed in a blue and white theme. The chart visualizes financial trends over quarters, with annotations for significant changes or highlights.
Financial Performance
Financial Services
A detailed review of Citigroup's financial results for the quarter, including revenue, expenses, and net income. It is likely intended for stakeholders interested in understanding the company's financial health and performance over time, with a focus on quarterly trends and key financial highlights.
Citigroup, Financial Overview, Q2, Revenues, Expenses, Net Income, Diluted EPS, RoE, RoTCE, Capital Ratio, Performance Analysis
Mixed Chart
Citigroup
Saved
Slide presents a combination of column charts and text analysis, focusing on Q2 financial results. Visual elements are well-organized, with blue tones highlighting key data points, accompanied by concise textual explanations.
Financial Performance
Financial Services
Reviews Deutsche Bank's financial performance for Q2 2023, emphasizing revenue growth and cost management within different bank divisions. It provides an in-depth quarterly financial breakdown.
Q2 2023, financial performance, revenue growth, cost management
Mixed Chart
Deutsche Bank
Saved
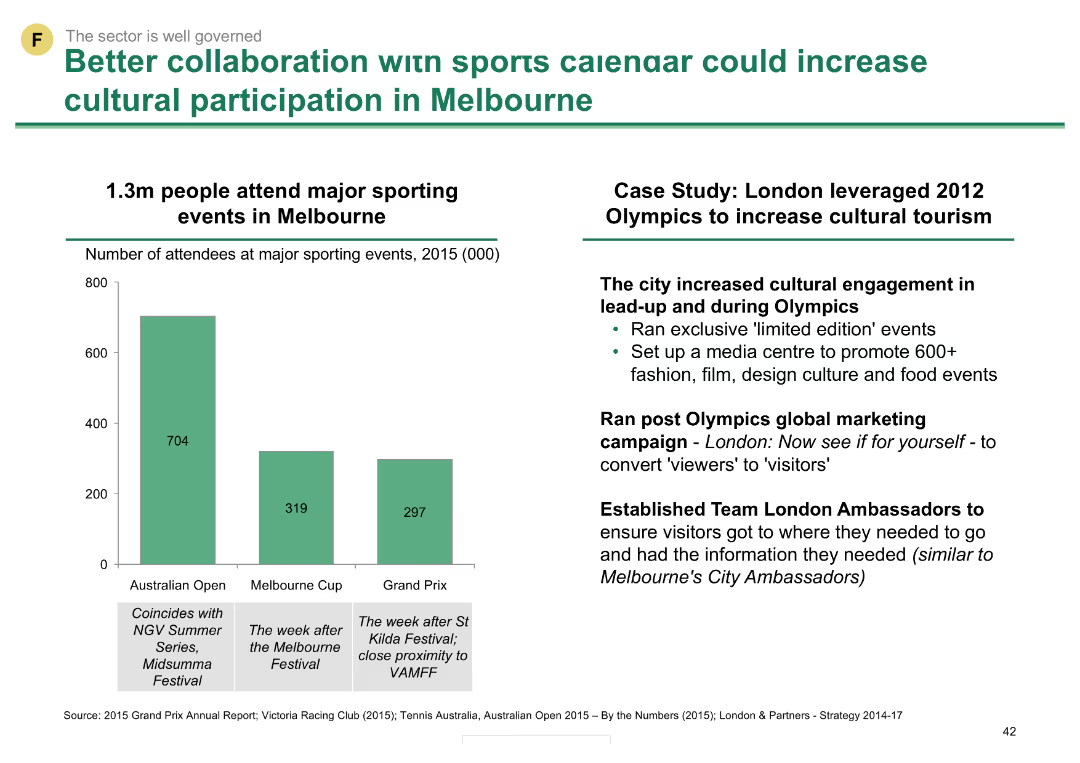
Column chart showing attendance numbers for major sporting events in Melbourne in 2015, alongside a case study of the London 2012 Olympics' impact on cultural tourism.
Strategic Planning
Hospitality & Tourism
This slide highlights the potential of leveraging sports events to boost cultural participation, using Melbourne and the London 2012 Olympics as examples.
sports, cultural participation, Melbourne, London, Olympics, tourism, events, collaboration, strategic planning
Mixed Chart
BCG
Saved
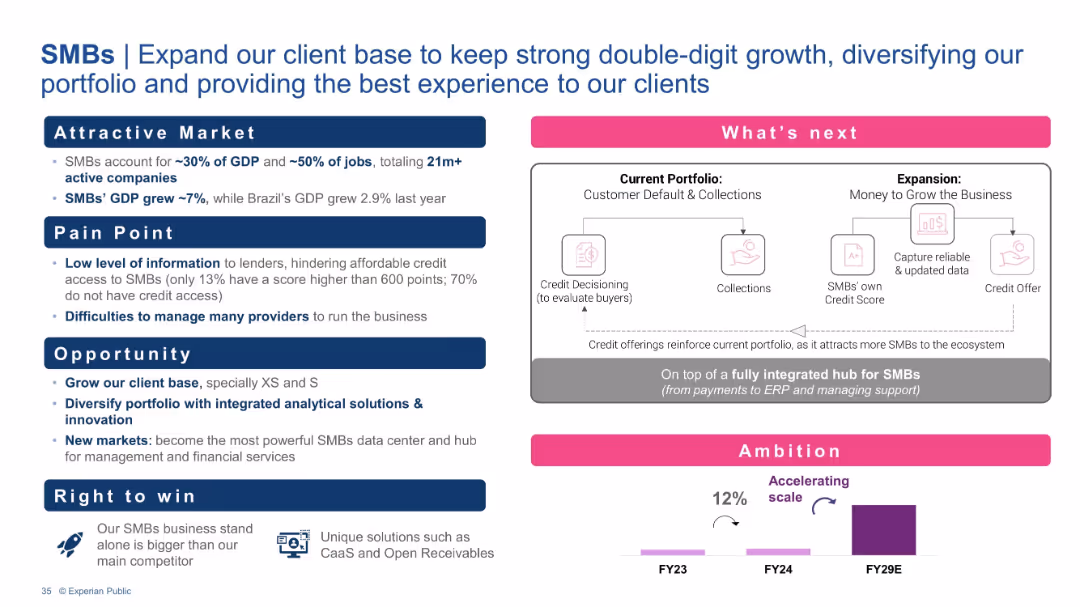
Pain-point/opportunity structure with market stats, a process diagram of Experian’s integrated hub, and an ambition chart.
Customer and Market Segmentation
Financial Services
This slide emphasizes the significance of SMBs in the economy and their challenges in accessing credit. Experian’s solution is a comprehensive data and financial hub, enabling expanded credit access and business growth, aiming for strong double-digit growth and market leadership.
SMBs, Credit access, Financial hub, Integrated solutions, GDP contribution, Data platform
Mixed Chart
Barclays
Saved
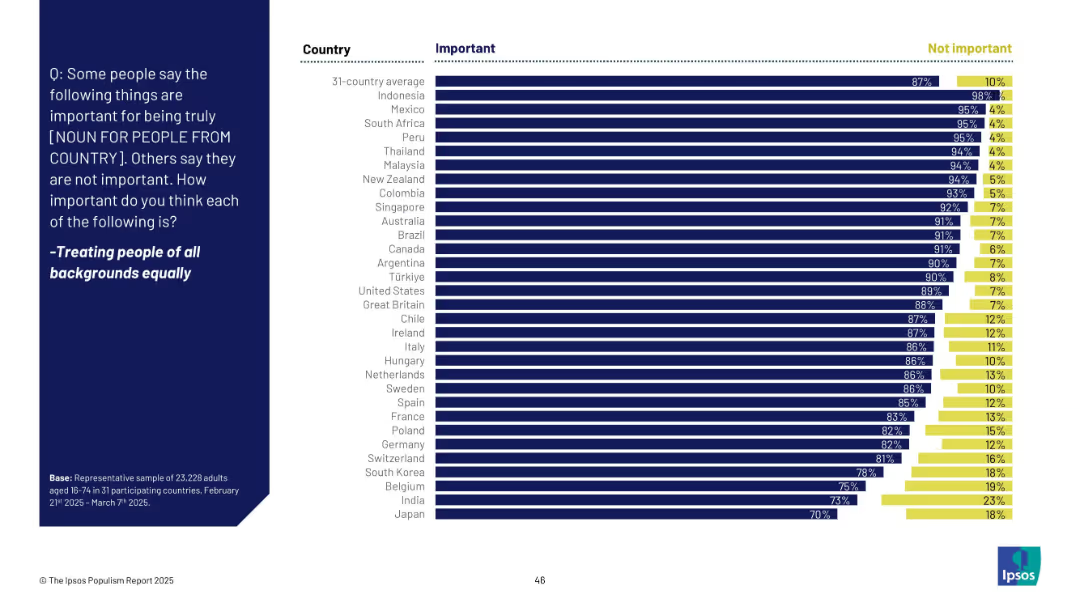
Horizontal bar chart similar in structure to slide 18911, comparing "Important" and "Not important" across countries.
Market Analysis and Trends
Government & Public Sector
The slide compares global public opinion across 31 countries regarding the importance of treating people from all backgrounds equally. Overwhelming majorities in nearly all countries consider this important, especially Indonesia (98%).
equality, diversity, inclusion, national values, public opinion, global, Ipsos, bar chart, fairness
Mixed Chart
IPSOS
Saved
The slide includes two charts: a line chart on growth and value forward P/E ratios, and a bar chart showing equity sector correlation changes in bond yields.
Investment Analysis
Financial Services
Examines global equity trends, comparing growth vs. value P/E ratios and sector performance relative to bond yields, useful for investment decision-making.
equities, growth, value, P/E ratios, bond yields
Multiple Chart
JP Morgan
Saved
Previous
Next
If nothing, comes up, please save your slides first
Create a FREE account to continue browsing
Receive Instant Access to 1,000+ slides from companies like McKinsey, Google, and Goldman Sachs
First Name
Last Name
Email
Password
I agree to all
Terms & Privacy Policy
Thank you! Your submission has been received!
Oops! Something went wrong while submitting the form.
Have an account?
Sign in
Column Chart
Heatmap
Chevron
Org Chart
Infographic
Callouts
Timeline
List
Graphic
Picture
Process Flow
Diagram
Paragraph
Map
Table
Framework
Subtitle
Takeaway Box
Icon
Other Chart
Radar Chart
Waterfall Chart
Mekko Chart
Pie Chart
Scatter Plot
Line Chart
Bar chart
Bullet points