My Account
My Slides
Search by Category
Templates
View All Templates
Download Template Slides
✦ AI Search
Feedback
Login
Logout
Get Started
Browse all Slides
Browse all Slides
Create a FREE Account
Instant access to 1,000+ real slides from top companies like McKinsey, BCG, Goldman Sachs, Google and many more!
First Name
Last Name
Email
Password
I agree to all
Terms & Privacy Policy
Thank you! Your submission has been received!
Oops! Something went wrong while submitting the form.
Have an account?
Sign in
Saved Slides
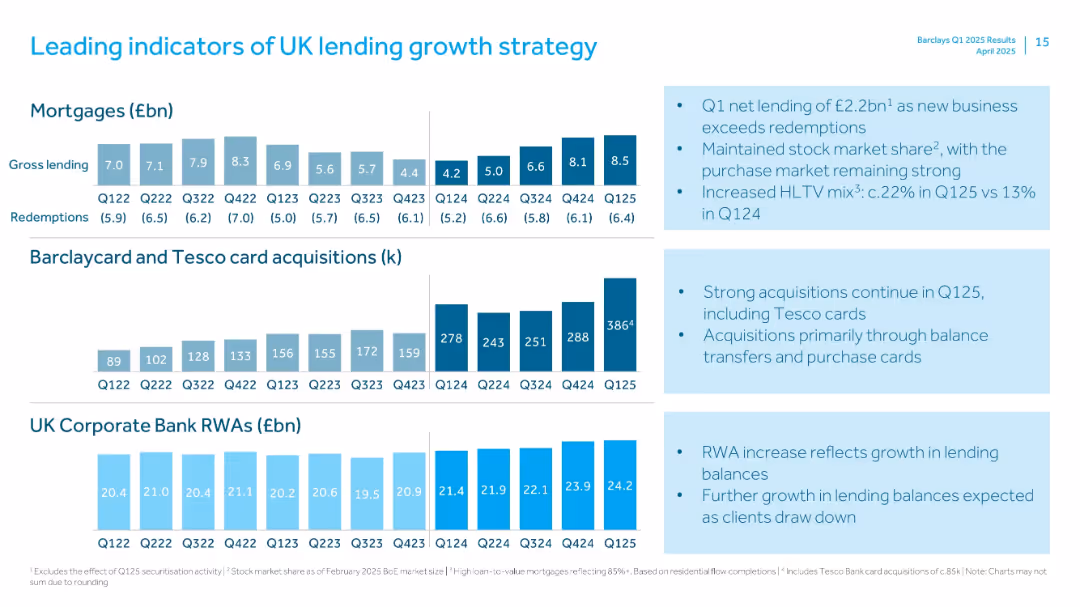
Three rows of small bar charts for mortgages, card acquisitions, and RWA, alongside bulleted insights.
Strategic Planning
Financial Services
Highlights key metrics driving Barclays' UK lending strategy, including mortgage gross lending, Barclaycard & Tesco card acquisitions, and Corporate Bank RWA. Notes continued market strength and higher loan-to-value mortgages.
Lending, Strategy, Mortgages, RWAs, Tesco, Cards, HLTV, Growth, UK Market
Multiple Chart
Barclays
Saved
The slide contains a column chart depicting the net investment change in Russia since 4Q22. Text sections detail Citi's Russia franchise update and investment changes.
Investment Analysis
Financial Services
This slide provides an overview of Citi's net investment changes in Russia, outlining financial impacts and updates on the franchise.
Investment, Russia, Franchise, Financial Impact, Net Income
Mixed Chart
Citigroup
Saved
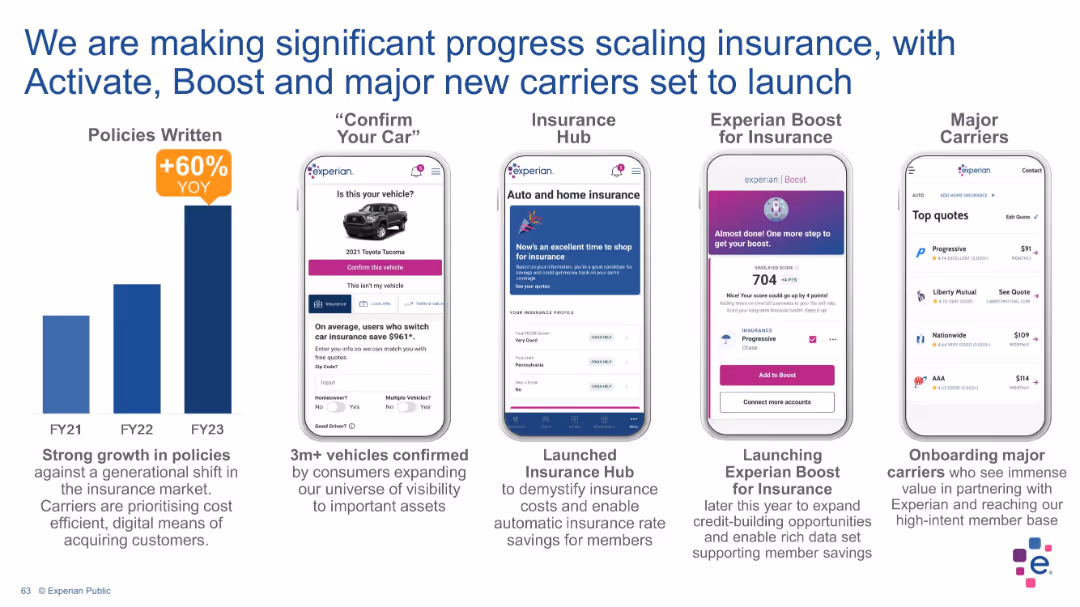
Horizontally aligned panels with bar chart on the left and four mobile screen mockups on the right; includes product feature highlights and YOY growth stat.
Product and Service Analysis
Financial Services
This slide showcases Experian’s insurance-related digital products and highlights a 60% YoY growth in policy volume. Features like “Confirm Your Car,” “Insurance Hub,” “Boost for Insurance,” and carrier onboarding illustrate digital innovation, consumer utility, and market adoption.
insurance, digital innovation, Experian Boost, growth, policy volume, mobile platform, customer acquisition, auto insurance, product launch, financial tech
Mixed Chart
Barclays
Saved
The slide features a column chart showing adjusted revenue progression in USD mn from 3Q16 to 2019, with segmented revenue sources and costs.
Financial Performance
Financial Services
This slide outlines expected improvements in revenue loss by 2019, driven by de-risking and legacy funding reduction.
revenue progression, adjusted revenue, de-risking, legacy funding, financial performance
Single Chart
Credit Suisse
Saved
The slide presents a series of column charts on revenue, net income, and return on capital, using a blue color scheme. The graphics are accompanied by bullet points with key financial metrics.
Financial Performance
Financial Services
This slide exhibits the solid financial results of Global Wealth & Investment Management with revenue, net income, and return on capital figures over a four-year period.
Wealth Management, Revenue, Net Income, Return on Capital, Financial Results, Pre-tax Margin, Capital Efficiency
Multiple Chart
Morgan Stanley
Saved
Image of the Taj Mahal with accompanying text about India's UPI system, and a line chart showing the exponential growth of UPI transactions.
Market Analysis and Trends
Financial Services
Highlights the growth of UPI in India, showing its increasing use and impact on the payment landscape, with a focus on transaction volumes and values.
India, UPI, payments, growth, transactions, exponential, financial, services, system
Mixed Chart
PwC/Strategy&
Saved
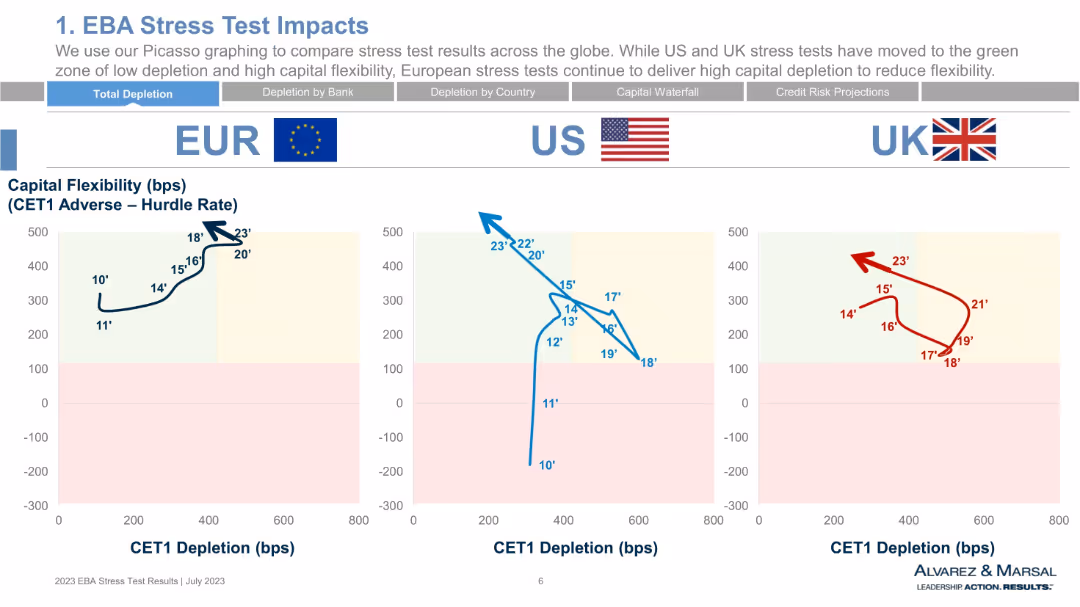
Line chart comparisons across EUR, US, and UK regions with national flags and CET1 depletion vs. capital flexibility axes. Uses color-coded backgrounds for impact zones.
Risk Assessment and Management
Financial Services
This slide compares CET1 depletion and capital flexibility by region (EU, US, UK) from 2010 to 2023. It shows regional trends and positions banks in “green” or “red” zones based on stress test outcomes. The EU shows high capital flexibility with moderate depletion, unlike the UK and US.
CET1, capital flexibility, EU vs US vs UK, stress testing, depletion, risk zones
Single Chart
Alvarez & Marsal
Saved
The slide features a column chart showing the total size of disclosed education deals by region in Africa from 2014-2018. It includes annotations and highlights of capital deployment, with specific details about investments in Southern, Northern, Eastern, and Western Africa.
Investment Analysis
Education & Training
This slide provides a regional breakdown of investment activity in the African education sector, detailing the total disclosed capital and the number of deals from 2014-2018. It highlights significant investments in Southern and Northern Africa, underscoring regional differences in investment levels.
investment, education, Africa, regional, capital
Mixed Chart
LEK
Saved
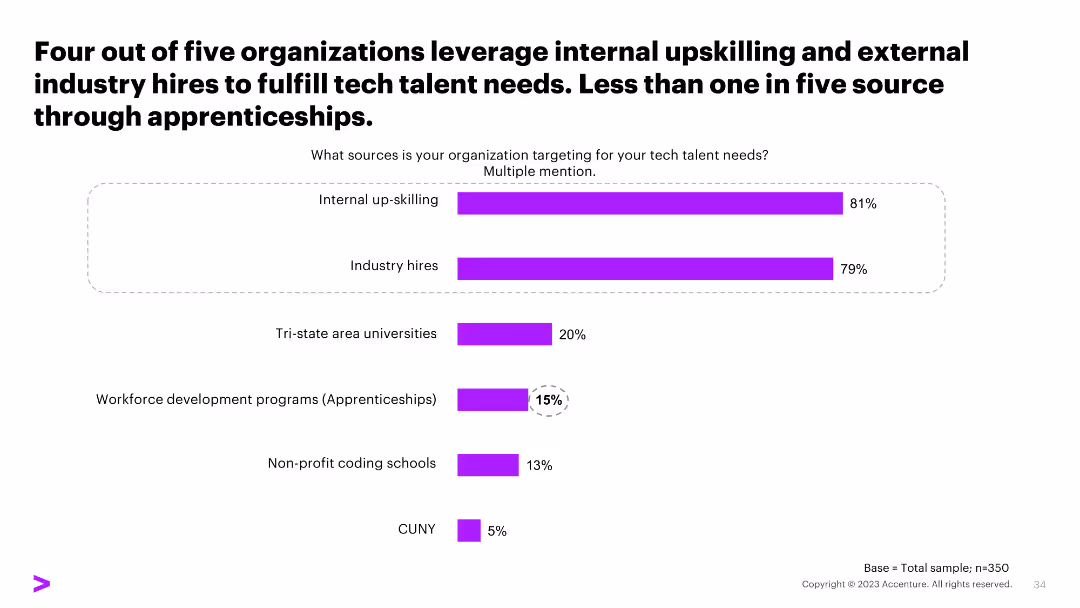
A column chart showing sources organizations target for tech talent, including internal upskilling, industry hires, and apprenticeships, with percentage values.
Human Resources and Talent Management
Professional Services
The slide illustrates the sources organizations use to fulfill tech talent needs, highlighting the importance of internal upskilling and industry hires over apprenticeships.
tech talent sources, internal upskilling, industry hires, apprenticeships
Single Chart
Accenture
Saved
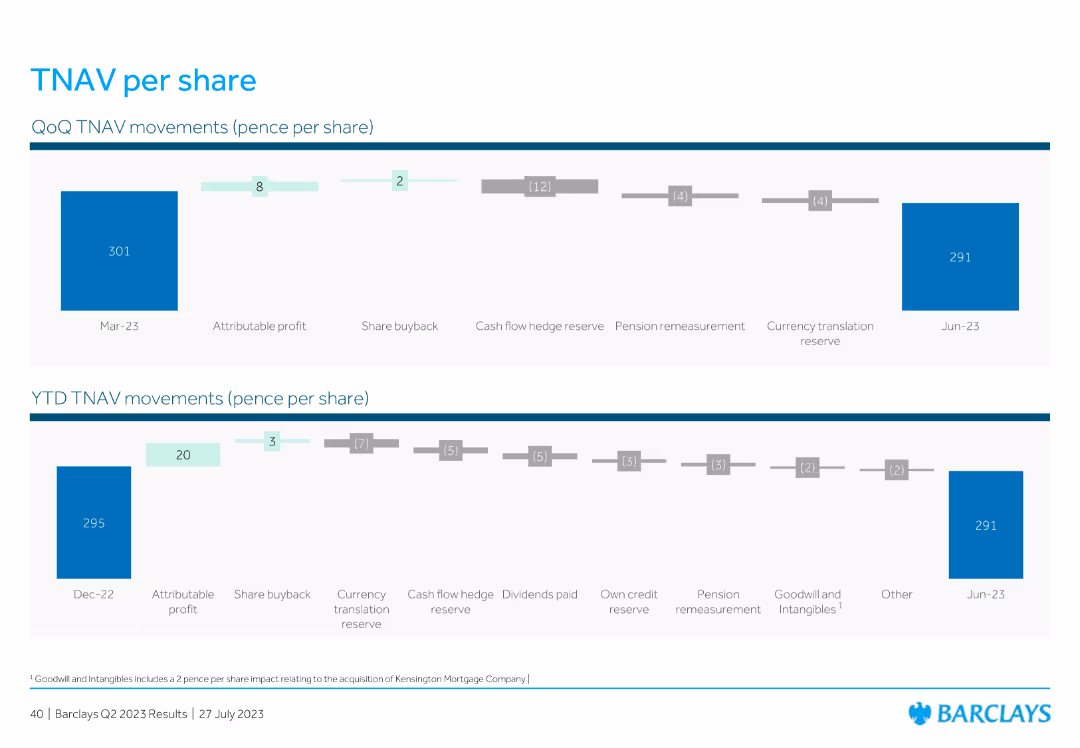
This slide features two horizontal charts: one for QoQ TNAV (Tangible Net Asset Value) movements and another for YTD TNAV movements, showing various contributing factors such as profit, share buyback, reserves, and translation reserves.
Financial Performance
Financial Services
The slide details the TNAV per share movements for the quarter and year-to-date, highlighting factors like profit, buybacks, reserves, and other elements impacting the TNAV value.
TNAV, share movements, profit, buyback, reserves
Multiple Chart
Barclays
Saved
Split-screen: Left has infographics and text summary, right has a large action photo. Black, teal, and white theme.
Customer and Market Segmentation
Media & Entertainment
Swimming is highlighted as the UK’s top participation sport and third in overall engagement, with strong gender and youth representation. The slide also emphasizes its Olympic impact and future growth opportunities.
swimming, participation, gender balance, Olympics, youth, engagement, UK sports
Mixed Chart
EY
Saved
Slide features two pie charts comparing portfolio composition from 2014 and 2021 with key data points listed above.
Investment Analysis
Transportation & Logistics
Details changes in Aircastle’s aircraft portfolio composition over seven years, focusing on investment strategy.
aircraft, portfolio, investment, capital, narrow-body, wide-body, freighter
Multiple Chart
Deutsche Bank
Saved
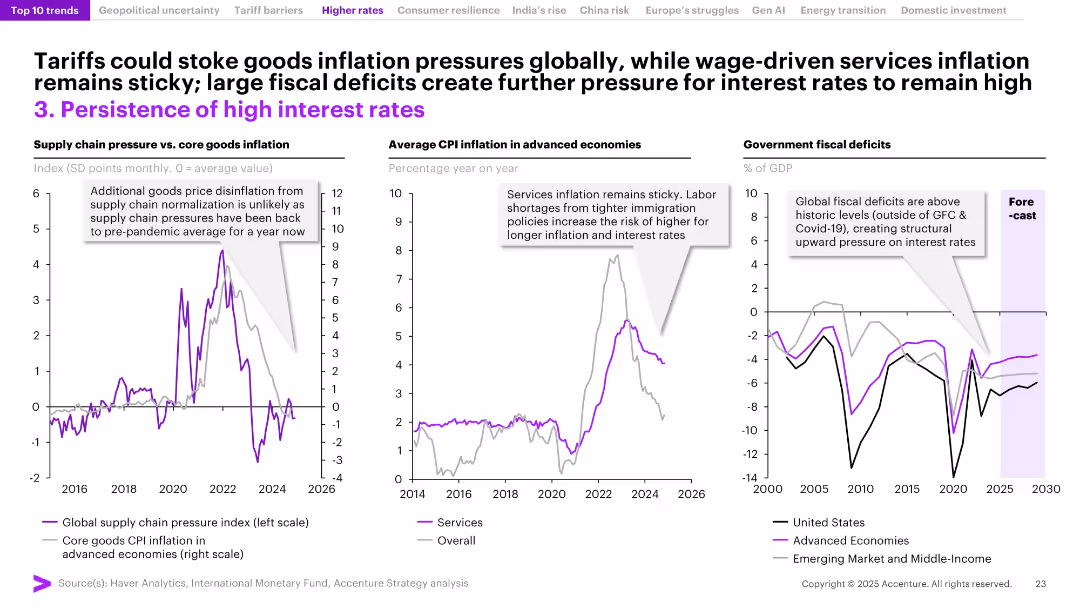
Three-panel layout with annotated line graphs on supply chain pressure vs. inflation, CPI inflation, and fiscal deficits. Purple accents highlight key data trends.
Market Analysis and Trends
Financial Services
This slide explores the persistence of high interest rates globally, driven by sticky services inflation, limited supply chain disinflation, and rising fiscal deficits. It emphasizes that structural factors like labor shortages and government debt are contributing to sustained inflationary pressure, preventing interest rates from dropping.
interest rates, inflation, fiscal deficits, supply chain, services CPI, global economy, sticky inflation, monetary policy, labor shortages, advanced economies
Multiple Chart
Accenture
Saved
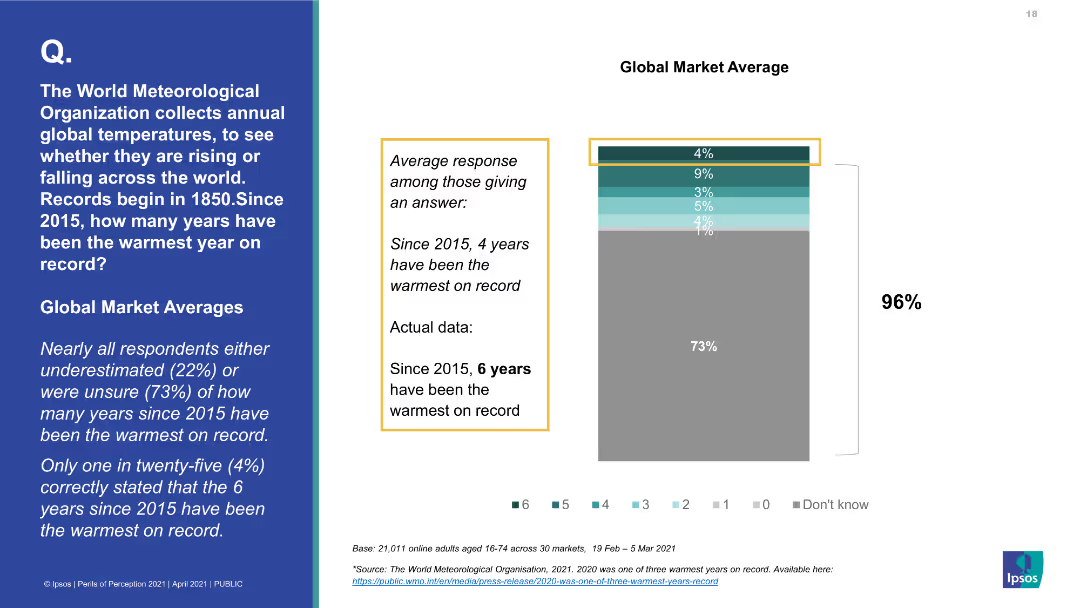
A bar chart for Great Britain, showing the average response to the number of warmest years since 2015, with a significant portion unsure. Accompanying text provides the actual data.
Market Analysis and Trends
Environmental Services & Sustainability
This slide shows how the public in Great Britain significantly underestimates the number of warmest years since 2015, with a majority being unsure or incorrect, compared to the actual data provided by the World Meteorological Organization.
global warming, temperature records, public awareness, Great Britain, World Meteorological Organization, survey response, actual data
Mixed Chart
IPSOS
Saved
The slide contains a column chart showing total funds raised over months and a line chart overlay indicating the number of funds raised. The visual is moderately dense, with detailed numerical data that highlights trends and patterns in fundraising activities.
Market Analysis and Trends
Financial Services
This slide provides an overview of monthly fundraising trends in PE/VC, showing the total funds raised and the number of fundraising activities. It helps in analyzing the fundraising landscape and identifying trends, useful for strategic financial planning and analysis.
PE/VC, fundraising, trends, total funds, number of funds
Single Chart
EY
Saved
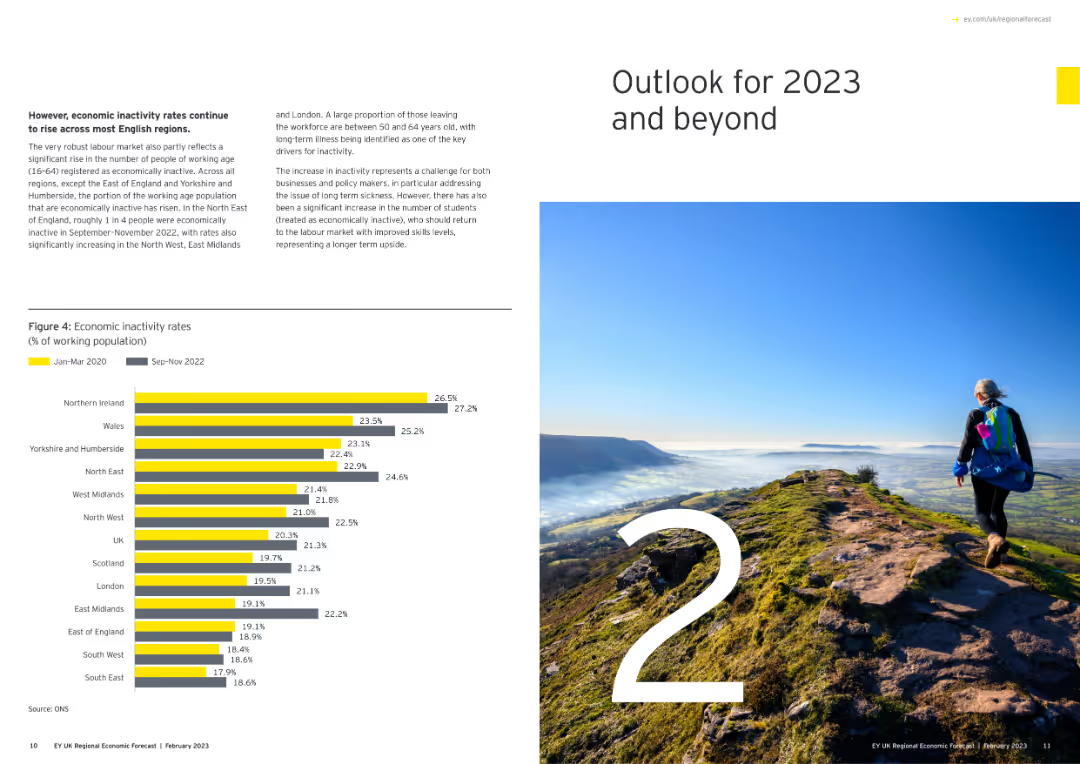
Features a large number "2" with an image of a person hiking on a mountain, and a column chart showing economic inactivity rates.
Strategic Planning
Government & Public Sector
Outlines the economic outlook for 2023 and beyond, focusing on inactivity rates among the working population across various regions.
economic outlook, 2023, inactivity rates, regional, column chart
Mixed Chart
EY
Saved
Features a column chart displaying 'Asset & Wealth Management Net Revenues' and a financial results table detailing various types of fees and revenues, with year-over-year and quarter-over-quarter comparisons.
Investment Analysis
Financial Services
The slide provides a financial summary of the Asset & Wealth Management sector, showing revenue generation from management fees, private banking, and investments. Useful for evaluating financial health and opportunities in asset management.
Asset Management, Wealth Management, Net Revenue, Management Fees, Private Banking, Investment, Revenue Analysis, Financial Results
Mixed Chart
Goldman Sachs
Saved
The slide shows a comparative analysis using two doughnut charts illustrating global investment values by region for 2012 and 2016.
Market Analysis and Trends
Financial Services
Highlights the growth of Asia in global investment values, showing significant increases from 2012 to 2016, emphasizing Asia’s growing market share.
Asia, Investment, Global Market, Trends
Multiple Chart
Kearney
Saved
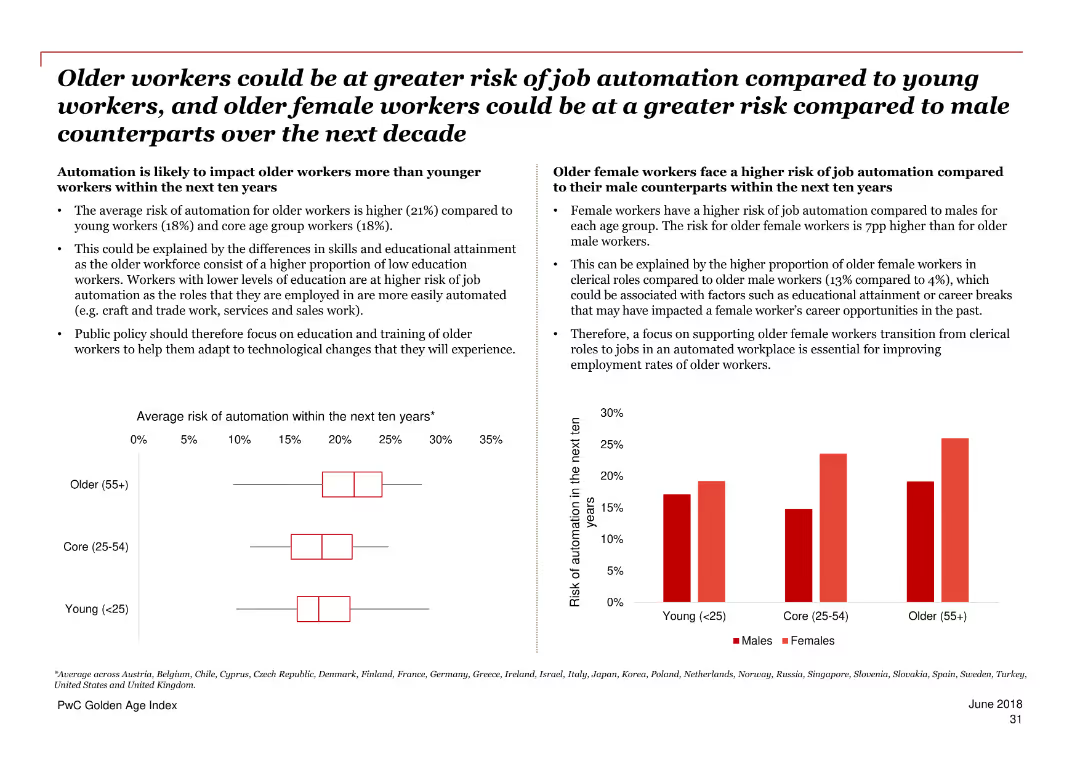
The slide includes two charts: a column chart comparing the average risk of automation for different age groups, and another chart comparing the risk of automation for males and females across various age groups. Text sections provide further details.
Risk Assessment and Management
Government & Public Sector
The slide compares the risk of job automation between older and younger workers and highlights the higher risk for older female workers compared to their male counterparts. It suggests a focus on training and education to mitigate these risks.
automation, age comparison, gender comparison, risk, job automation, older workers, younger workers, policy, training
Multiple Chart
PwC/Strategy&
Saved
The slide outlines team, category, and supplier excellence pillars with icons and a diagram of Kearney's House of Purchasing and SupplySM.
Human Resources and Talent Management
Professional Services
It describes the pillars for sustained procurement performance, highlighting the roles of team excellence, category excellence, and supplier excellence.
Team excellence, category excellence, supplier excellence, procurement, performance, talent
Diagram
Kearney
Saved
A graph slide with a bar chart showing the levels of concern across different sectors for ESG dimensions. The slide is divided into three sections with color-coded bars corresponding to environment, social, and governance concerns.
Risk Assessment and Management
Technology & Software
Analyzes ESG concerns in SEA's core digital economy sectors, highlighting the higher levels of concern in areas like e-commerce, transport, and gaming.
ESG, sustainability, SEA, digital economy, concerns, environment, social, governance, sectors
Table
Bain
Saved
This slide showcases a column chart and a graph overlaid with multiple scenario projections. The chart on the left outlines potential risks, while the right-hand side graph illustrates ROTCE projections across different recessionary scenarios, with color-coded lines representing varying intensities of economic conditions.
Risk Assessment and Management
Financial Services
Slide 18 positions JPMorgan Chase & Co. as capable of delivering strong returns on tangible equity (ROTCE) under various recessionary conditions, underlining robust risk management and strategic resilience.
ROTCE, Risk Management, Recession Scenarios, Projections, Return on Equity, Economic Conditions, Strategic Resilience
Mixed Chart
JP Morgan
Saved
This slide uses a simple design with images and text to announce upcoming reports on industrial automation by Harris Williams and L.E.K., including process industry automation, discrete (factory) automation, and warehouse automation.
Strategic Planning
Industrial & Manufacturing
The slide informs about upcoming reports from Harris Williams and L.E.K. on industrial automation, focusing on process industry automation, discrete (factory) automation, and warehouse automation.
Upcoming Reports, Industrial Automation, Process Automation, Discrete Automation, Warehouse Automation, Harris Williams, L.E.K.
Diagram
LEK
Saved
The slide features a column chart comparing budgets allocated to customer acquisition versus retention, with summary statistics and illustrative arrows.
Market Analysis and Trends
Professional Services
Analyzes the budget allocation between customer acquisition and retention, highlighting a greater focus on acquisition in terms of budgetary spending.
customer acquisition, retention, budgets, analysis, comparison
Mixed Chart
Deloitte
Saved
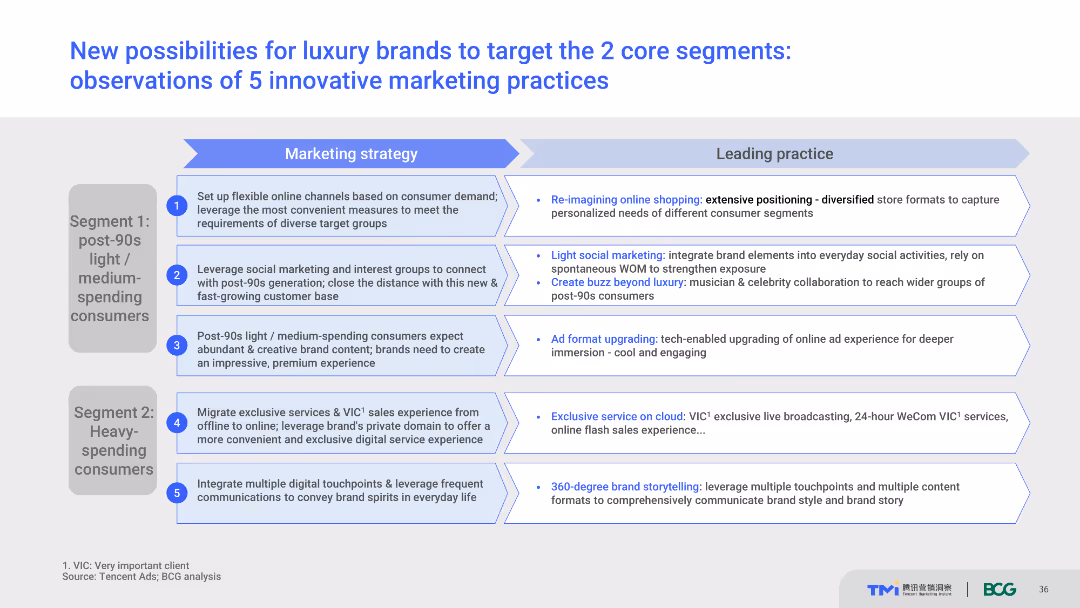
List of five innovative marketing practices for targeting core consumer segments. Each practice is paired with an explanation of its implementation and potential benefits. Text-heavy with supporting visuals.
Strategic Planning
Retail & E-commerce
Provides a strategic overview of innovative marketing practices for luxury brands, focusing on targeting post-90s light/medium-spending consumers and heavy-spending consumers. Highlights practical examples and potential outcomes of these strategies.
Marketing practices, luxury brands, consumer targeting, innovation, strategic planning
Table
BCG
Saved
Previous
Next
If nothing, comes up, please save your slides first
Create a FREE account to continue browsing
Receive Instant Access to 1,000+ slides from companies like McKinsey, Google, and Goldman Sachs
First Name
Last Name
Email
Password
I agree to all
Terms & Privacy Policy
Thank you! Your submission has been received!
Oops! Something went wrong while submitting the form.
Have an account?
Sign in
Column Chart
Heatmap
Chevron
Org Chart
Infographic
Callouts
Timeline
List
Graphic
Picture
Process Flow
Diagram
Paragraph
Map
Table
Framework
Subtitle
Takeaway Box
Icon
Other Chart
Radar Chart
Waterfall Chart
Mekko Chart
Pie Chart
Scatter Plot
Line Chart
Bar chart
Bullet points