My Account
My Slides
Search by Category
Templates
View All Templates
Download Template Slides
Leave Feedback
Login
Logout
Get Started
Browse all Slides
Browse all Slides
Create a FREE Account
Instant access to 1,000+ real slides from top companies like McKinsey, BCG, Goldman Sachs, Google and many more!
First Name
Last Name
Email
Password
I agree to all
Terms & Privacy Policy
Thank you! Your submission has been received!
Oops! Something went wrong while submitting the form.
Have an account?
Sign in
Saved Slides
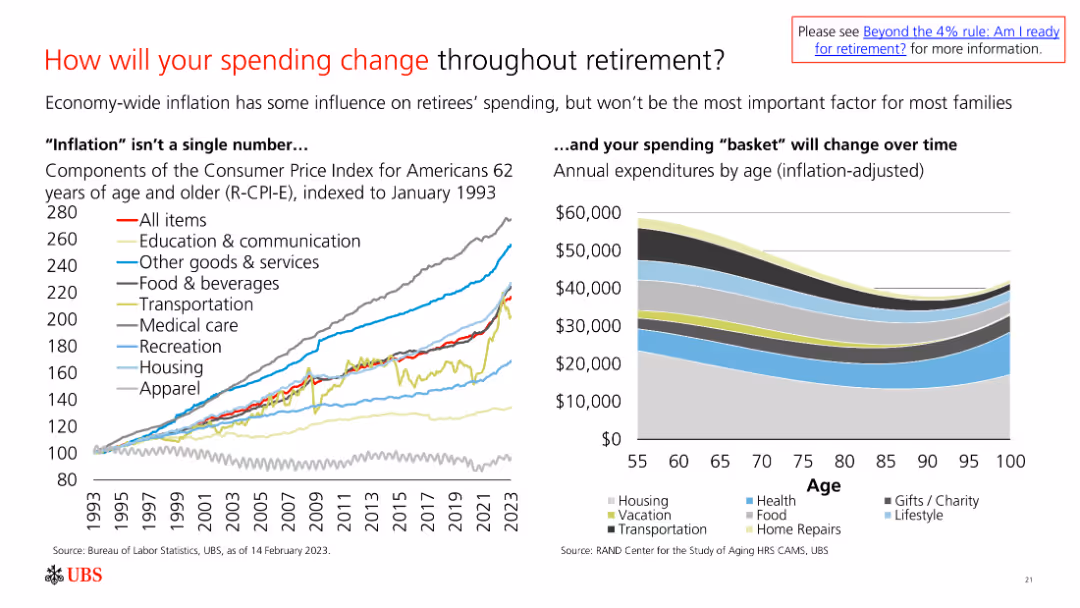
The slide features a line chart showing the Consumer Price Index for different expense categories over time and a bar chart of annual expenditures by age.
Market Analysis and Trends
Financial Services
The slide analyzes spending changes in retirement, influenced by inflation and shifts in expenditure categories, to guide financial planning for retirees.
Retirement, Spending, Inflation, Expenses, Financial Planning
Multiple Chart
UBS
Saved
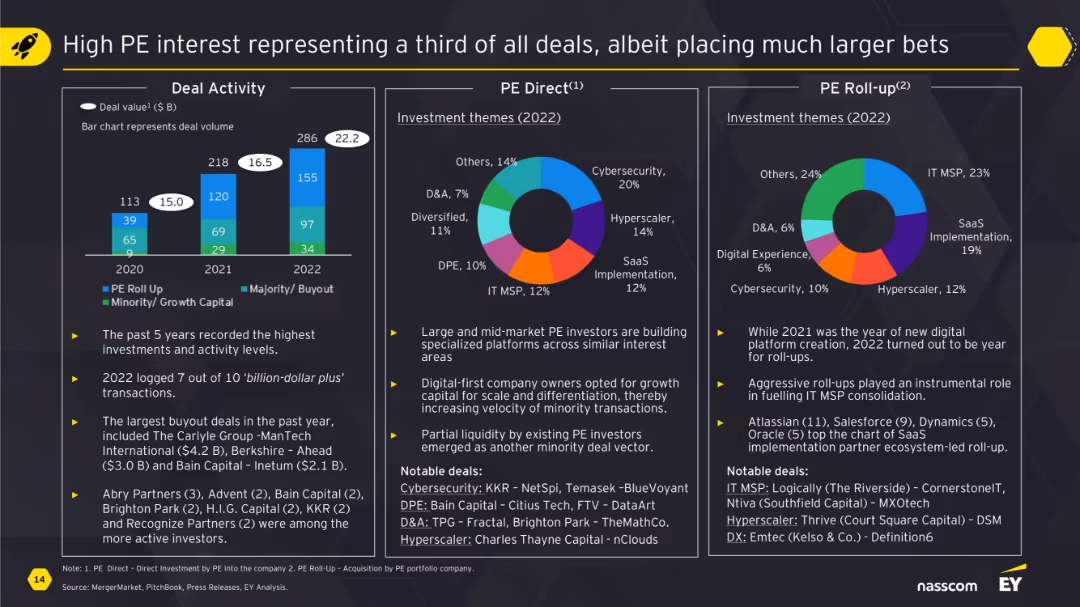
Consists of three visual charts (bar and two pie charts) and related bullet points highlighting deal types, investment themes, and PE roll-up examples.
Investment Analysis
Financial Services
The slide presents insights on private equity investment trends. PE deals formed a significant portion of 2022's M&A landscape, with themes like cybersecurity, SaaS, and IT MSP dominating. It distinguishes between direct investments and roll-ups, listing notable deals in each. Charts display proportions across themes like hyperscalers and digital experience.
private equity, investment, SaaS, cybersecurity, roll-ups, IT MSP
Multiple Chart
EY
Saved
Dual column charts displaying 10-year sovereign bond yields for developed and emerging markets, differentiated by color coding for '1 Mo. Ago' and '12 Mo. Ago'.
Investment Analysis
Financial Services
Comparative analysis of 10-year sovereign bond yields between developed and emerging markets, shown in column charts to visualize changes over time. This slide is useful for investors tracking bond market trends and interest rate changes.
Sovereign Bonds, Yields, Developed Markets, Emerging Markets, Investment, Trends
Multiple Chart
Morgan Stanley
Saved
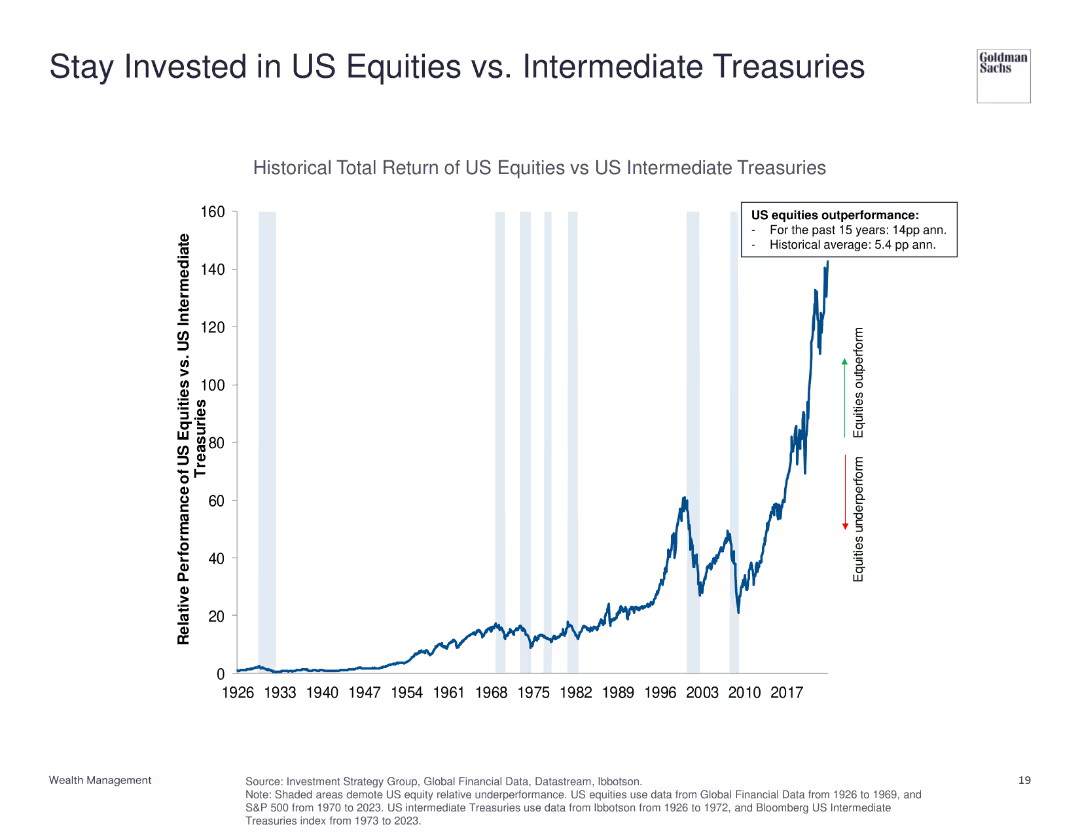
The slide displays a line chart showing the historical total return of US equities versus US intermediate treasuries from 1926 to 2023. Annotations highlight periods of outperformance and underperformance.
Investment Analysis
Financial Services
This slide compares the total return of US equities to US intermediate treasuries, indicating the significant outperformance of equities over the long term.
US equities, intermediate treasuries, historical return, investment, performance comparison
Single Chart
Goldman Sachs
Saved
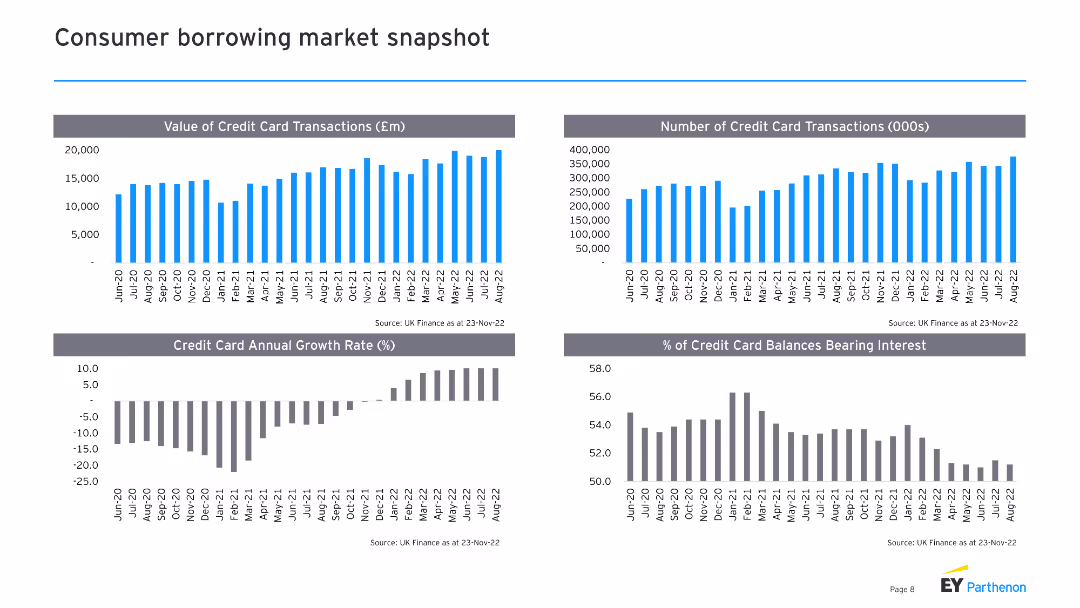
The slide contains four column charts, showing values of credit card transactions, number of credit card transactions, credit card annual growth rate, and percentage of credit card balances bearing interest over time.
Market Analysis and Trends
Financial Services
The slide provides an overview of consumer borrowing trends, focusing on credit card transactions, growth rates, and balances, useful for analyzing market conditions and consumer behavior.
credit card, transactions, growth rate, balances, trends
Multiple Chart
EY
Saved
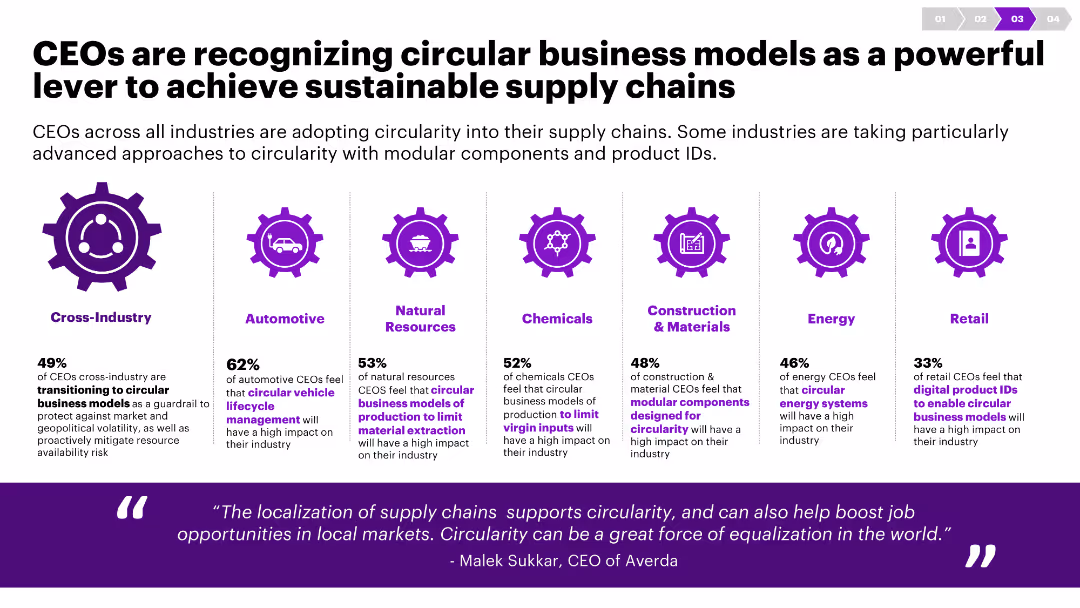
The slide uses icons and column charts to show data on the adoption of circular business models across various industries. It has a clean, balanced layout.
Strategic Planning
Environmental Services & Sustainability
This slide discusses how CEOs from different industries are integrating circular business models into their supply chains to enhance sustainability.
Circularity, CEOs, supply chain, sustainability, industry, business models, modular components, product IDs, transition, approach
Pillar
Accenture
Saved
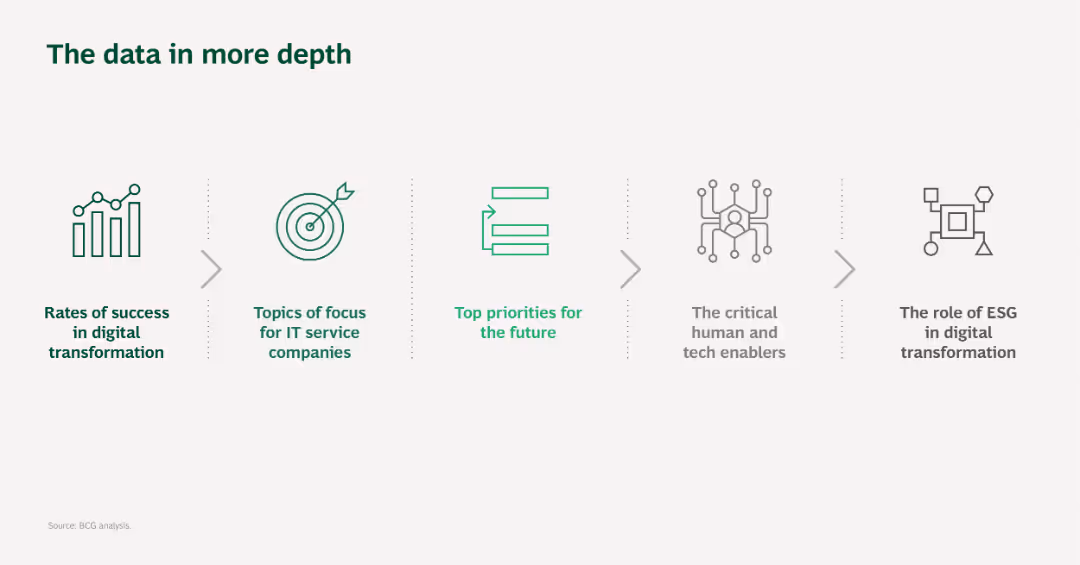
Simple layout with five icons representing different aspects of digital transformation data analysis.
Market Analysis and Trends
Telecommunications
This slide provides an overview of the topics covered in the presentation, including digital transformation success rates, IT service focus areas, and future priorities.
Digital transformation, Data analysis, IT services, Priorities, Topics overview
Pillar
BCG
Saved
This slide uses a timeline format to detail significant events in Tyson's sustainability efforts, marked by circular nodes. The visual arrangement is clear and orderly, using colors to differentiate dates and events, which enhances readability.
Regulatory and Compliance
Environmental Services & Sustainability
Outlines key milestones in Tyson's sustainability journey, including appointments, program rollouts, and strategic partnerships. This slide is likely aimed at stakeholders interested in corporate responsibility, providing a concise overview of Tyson's commitment to environmental and social initiatives.
Sustainability, Tyson, Corporate Responsibility, Milestones, Timeline
Linear Flow
Barclays
Saved
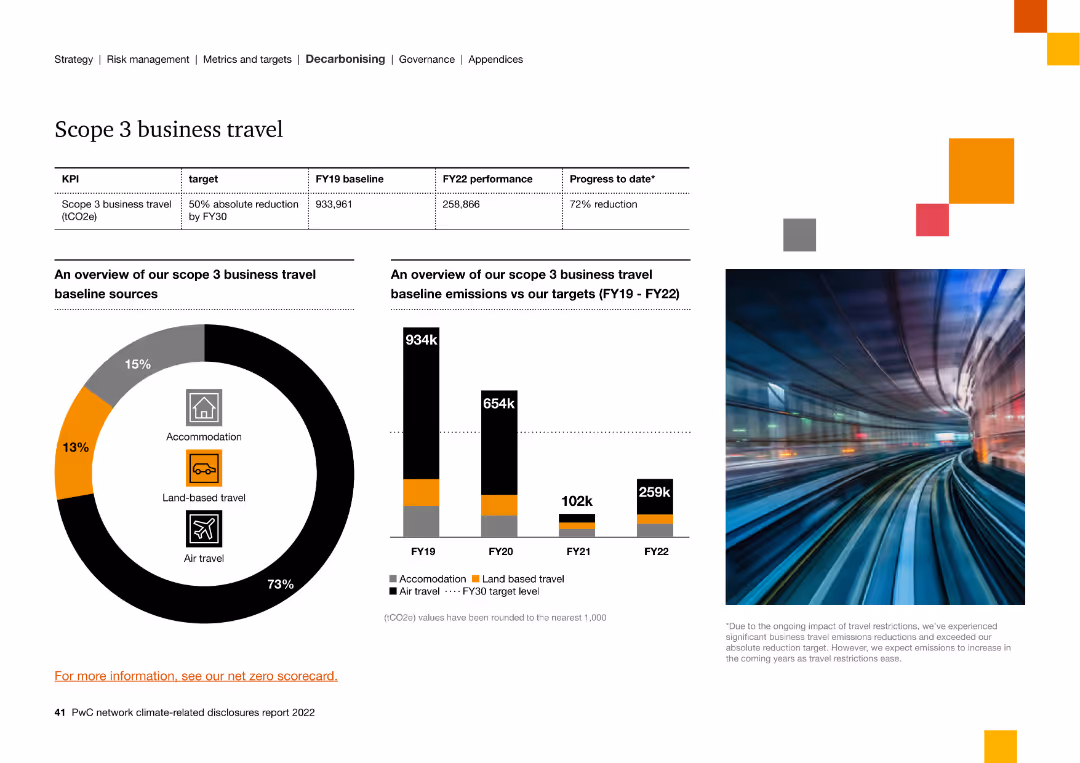
The slide features a circular graph and column charts, showing the sources and reductions of Scope 3 business travel emissions from FY19 to FY22.
Strategic Planning
Energy & Utilities
The slide provides an overview of Scope 3 business travel emissions, showing a 72% reduction target by FY30, and the breakdown of emission sources.
scope 3, business travel, emissions, reduction, sources, targets, overview
Multiple Chart
PwC/Strategy&
Saved
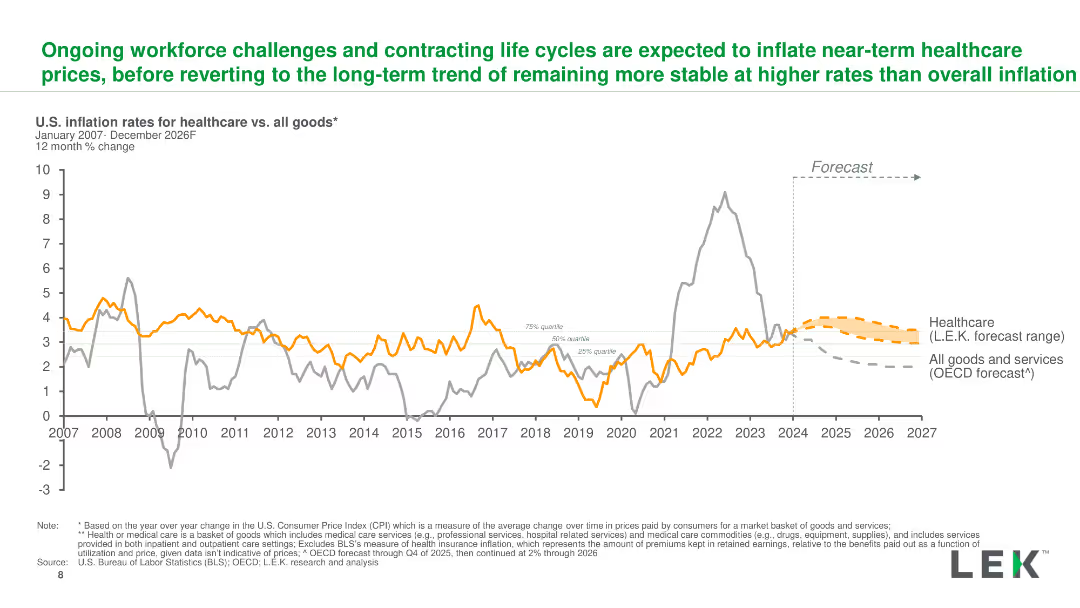
A line chart forecasting U.S. inflation rates for healthcare and all goods from 2024 to 2026, with historical data from 2007 and projections clearly marked.
Risk Assessment and Management
Healthcare & Pharmaceuticals
The slide forecasts healthcare inflation, highlighting the impact of workforce challenges and the expected stabilization of rates compared to overall inflation.
healthcare, inflation, forecast, workforce, trends
Single Chart
LEK
Saved
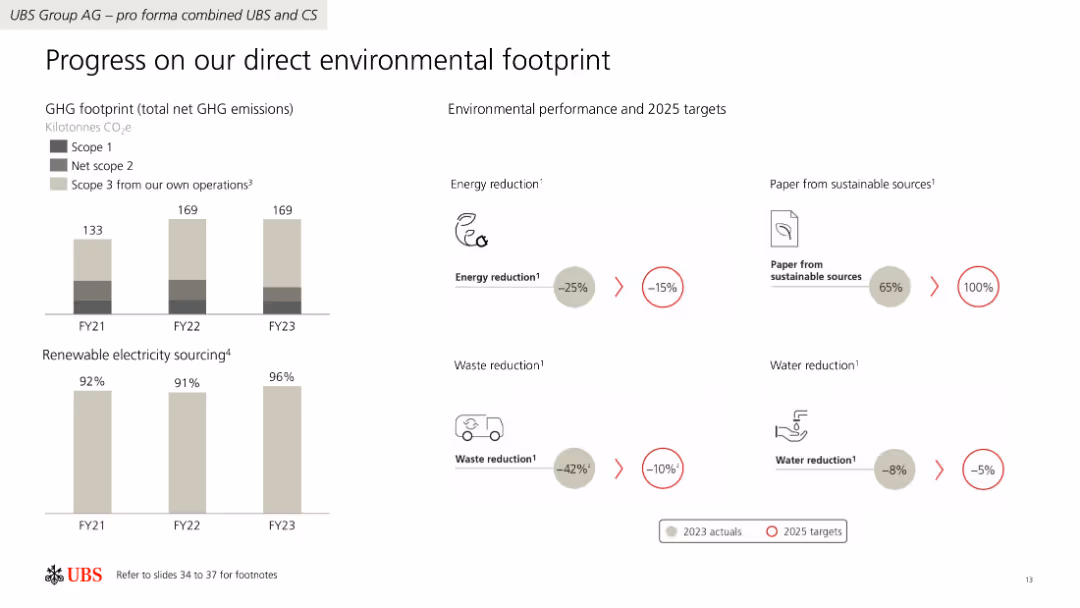
The slide features a combination of column charts and iconography to present data on GHG emissions, renewable electricity sourcing, and environmental performance targets.
Regulatory and Compliance
Financial Services
The slide details UBS Group AG's progress in reducing GHG emissions, increasing renewable electricity use, and achieving environmental performance targets by 2025.
GHG emissions, renewable electricity, targets, UBS, environmental performance
Multiple Chart
UBS
Saved
A text-heavy slide with a three-column layout presenting a pathway to profitability over different time horizons, complemented by performance drivers.
Operational Efficiency
Financial Services
It outlines the strategic approach to profitability in Platform Solutions, including progress markers and goals for upcoming years.
profitability, platform, strategy, efficiency
Table
Goldman Sachs
Saved
This slide has a map of Europe with highlighted countries, and to the left, a series of mini-tables with property details per country.
Market Analysis and Trends
Real Estate & Construction
The slide provides an overview of CEREIT's real estate portfolio by country in Europe as of a specific date. It is useful for analyzing geographical diversification, property valuation, and occupancy rates across various European markets.
Real Estate, Portfolio, Europe, Valuation, Occupancy, Yield, Diversification, Property, Country
Graphic
Morgan Stanley
Saved
Bullet lists for revenue, expenses, cost of credit, and tax rate forecasts
Strategic Planning
Financial Services
Financial projections and strategic guidance for the fiscal year
Guidance, Financial Projections, Strategy, Revenue, Expenses, Tax, Financials
Table
Citigroup
Saved
Column chart displaying the distribution of different campaign types over three years for podcast ad revenues.
Market Analysis and Trends
Media & Entertainment
Analyzes changes in podcast advertising campaign types from 2016 to 2018, emphasizing the growth of brand awareness and branded content.
Podcast, Advertising, Revenue, Brand Awareness, Branded Content, 2016, 2017, 2018
Multiple Chart
PwC/Strategy&
Saved
Multiple charts showing various economic indicators, including restructuring cases, profit warnings, volatility, and early warning indicators.
Market Analysis and Trends
Financial Services
The slide presents the initial consequences of a fragile economic environment, using various indicators to highlight trends in restructuring, profit warnings, market volatility, and early warning signals. It emphasizes the impact of these factors on the overall economic outlook and business climate.
Economic Indicators, Fragile Environment, Market Volatility
Multiple Chart
Roland Berger
Saved
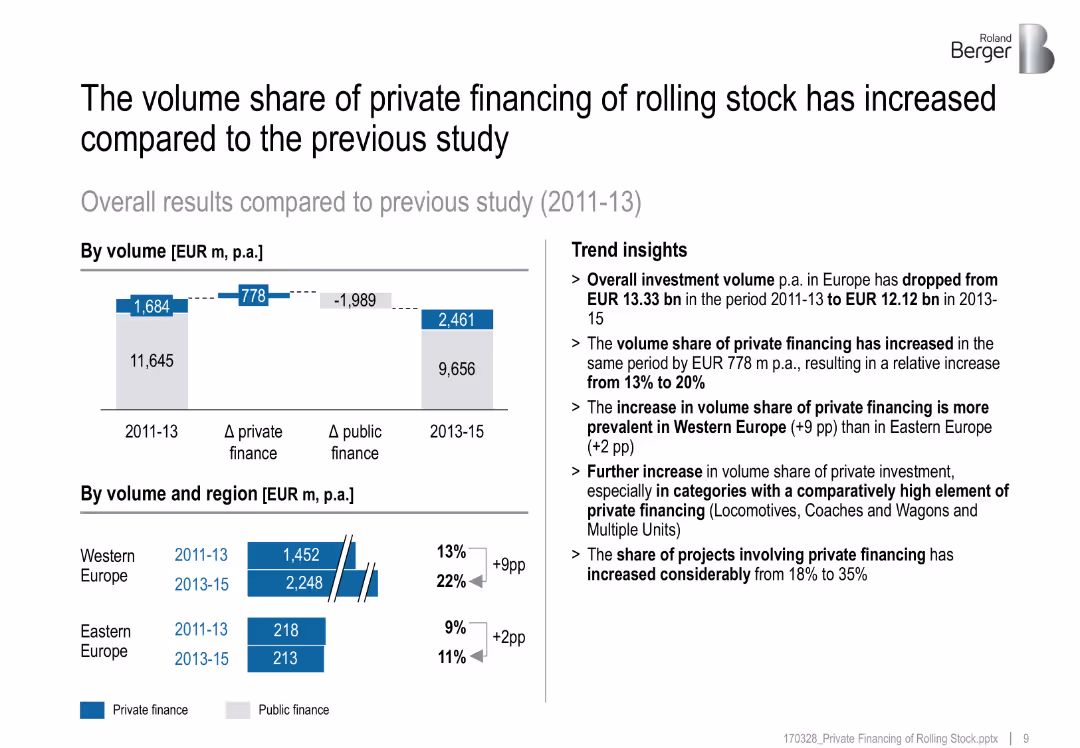
Comparative column chart and bar chart with percentage changes; trend summary on right
Investment Analysis
Transportation & Logistics
Shows how private financing has grown in share and volume from 2011–13 to 2013–15, with regional and segment-level breakdowns and implications for rolling stock procurement.
financing trends, investment share, rail infrastructure, regional split, procurement
Multiple Chart
Roland Berger
Saved
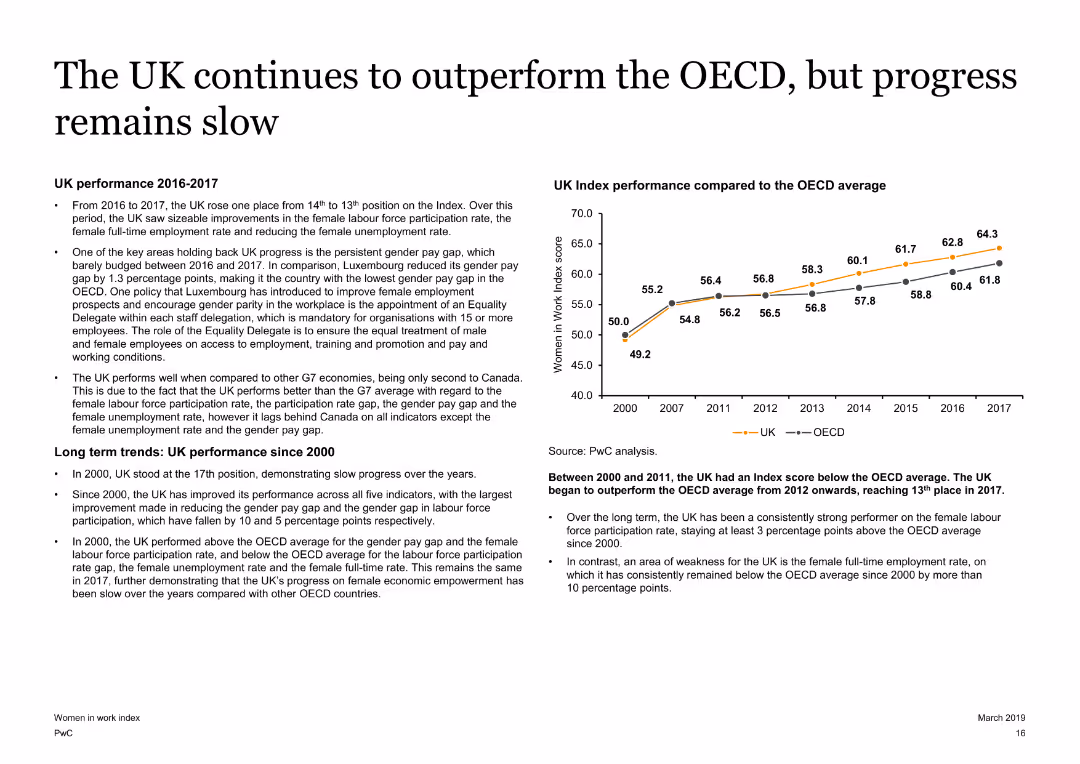
A slide with text on the left and a line chart on the right. The line chart compares the UK Index performance with the OECD average from 2000 to 2017. The slide has a moderate amount of text and visual elements.
Market Analysis and Trends
Government & Public Sector
Analyzes the UK's performance on the Women in Work Index, showing improvements over time and comparing it with the OECD average. Highlights key factors affecting progress, such as the gender pay gap and female labor force participation rates.
UK, Women in Work Index, OECD, gender pay gap, labor force participation
Mixed Chart
PwC/Strategy&
Saved
The slide features three separate text boxes with icons, titled '1. Revenue growth management', '2. Assortment, innovation and design to value', and '3. Cost-based assessment'. Each section has bullet points below. On the right, there's an overlay of faint graphic elements.
Strategic Planning
Financial Services
Discusses strategic responses to inflation, offering three key strategies for businesses to manage revenue, redefine value propositions, and assess costs. These strategies are presented as practical measures to build resilience and prepare for future economic conditions. The slide provides a concise guide for businesses to proactively address inflation through revenue growth management, value proposition redesign, and cost-based assessments, focusing on areas like procurement, labor force, supply chain reinvention, and building resilience.
Inflation, Strategy, Revenue, Cost, Value, Resilience
Header Horizontal
Bain
Saved
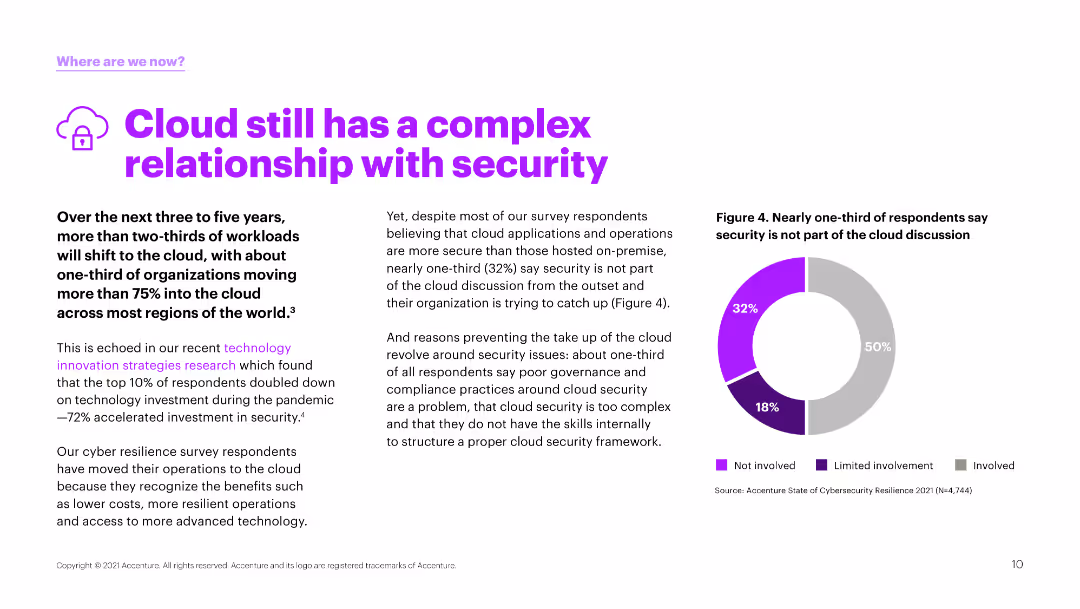
Text and a pie chart illustrating survey responses about the involvement of security in cloud discussions. The chart uses purple and gray to show different involvement levels.
Risk Assessment and Management
Technology & Software
The slide explores the ongoing challenges of cloud security, indicating that a significant portion of respondents feel that security is not adequately involved in cloud strategy discussions.
cloud, security, involvement, challenges, survey
Mixed Chart
Accenture
Saved
Split block layout separating motor and controller components with localization, cost %, and opportunity/risk sections. National flag icons denote sourcing.
Operational Efficiency
Industrial & Manufacturing
This slide outlines the domestic manufacturing potential for electric vehicle motors and controllers, showcasing localization levels, cost structures, and sourcing countries. It identifies key opportunities in customization, software design, and material innovation, while also flagging risks like rare earth dependence and limited semiconductor capabilities.
motors, EV, localization, manufacturing, India, components, electronics, rare earths, cost structure, R&D
Mixed Chart
BCG
Saved
Contains multiple circular flow diagrams with icons and text. In the center, there are four main categories connected by arrows showing a continuous cycle. The layout is clean with moderate visual complexity.
Market Analysis and Trends
Retail & E-commerce
Discusses the future of retail, focusing on empowered consumers, disruptive technologies, and societal impacts. Explains the transformation of business models and the increase in value for society.
Retail, Consumer Empowerment, Disruptive Technologies, Business Models, Societal Impact
Framework
Accenture
Saved
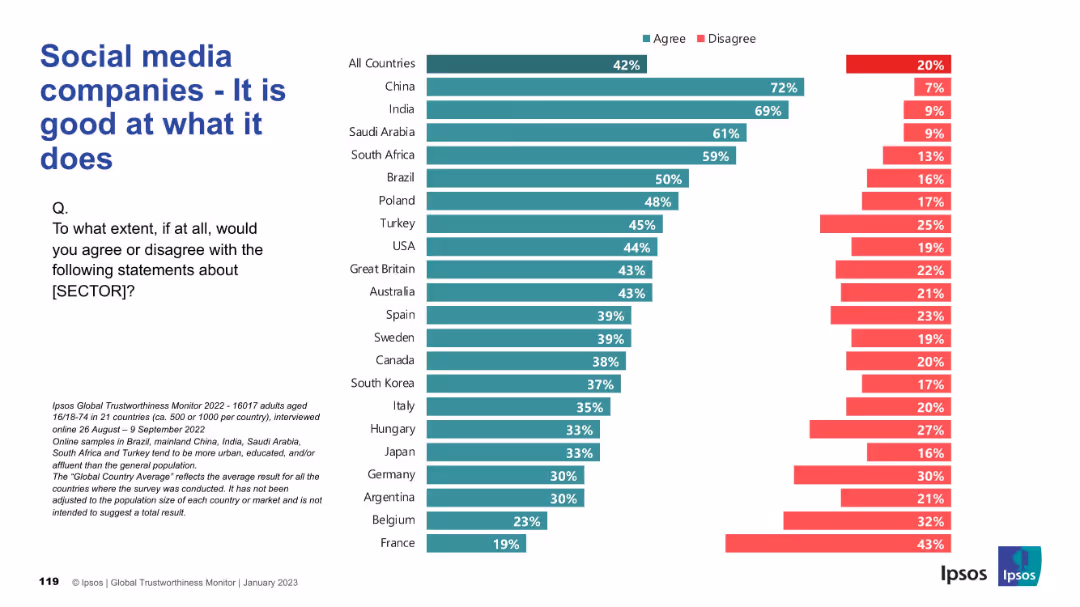
Similar chart format showing agreement/disagreement on performance of social media companies globally.
Product and Service Analysis
Technology & Software
This slide shows public agreement with the competence of social media companies. While emerging markets show strong belief in performance, Western nations like France and Belgium express more skepticism.
social media, performance, public perception, global opinion, Ipsos survey, competence, tech industry, country comparison
Mixed Chart
IPSOS
Saved
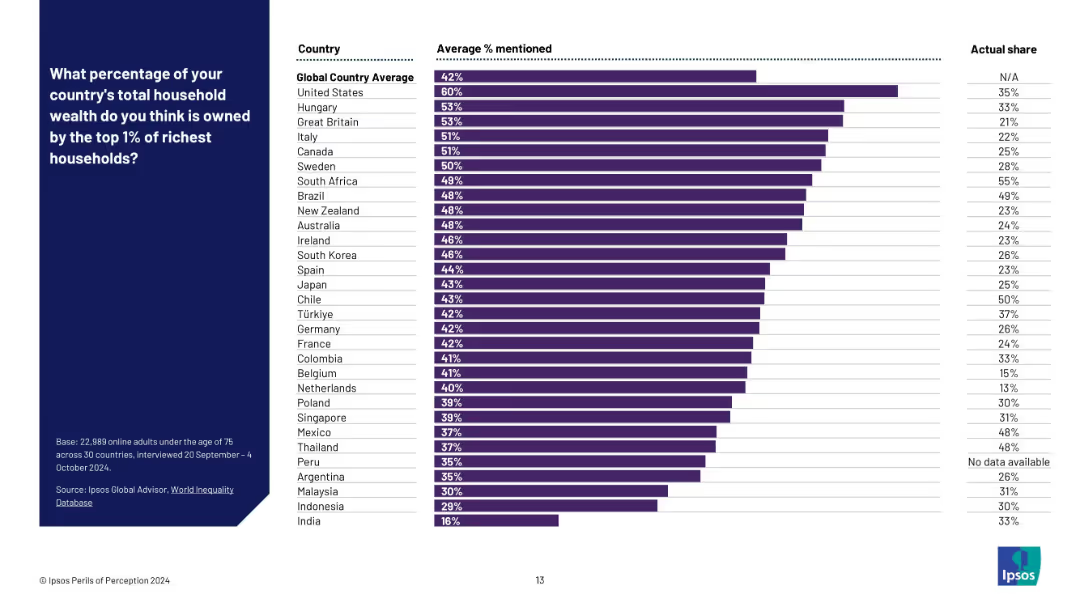
Bar chart with three columns: country, average % mentioned, and actual share; purple bars represent perceived values.
Market Analysis and Trends
Professional Services
This slide compares perceived versus actual estimates of wealth concentration among the top 1% richest households in various countries. It highlights a global trend of overestimating inequality, with perception gaps illustrated via a side-by-side format.
wealth perception, inequality, global survey, household wealth, top 1%, Ipsos, country comparison, data visualization, perception vs reality, public opinion
Mixed Chart
IPSOS
Saved
Contains line and column charts showing the Net Interest Margin (NIM) development for Corporate and Private Banks. Includes data points over multiple quarters.
Financial Performance
Financial Services
Details trends in Net Interest Margin for Deutsche Bank's Corporate and Private Banking sectors, analyzing shifts in financial management strategies and market conditions.
NIM, banking, interest rates, financial analysis, trends
Multiple Chart
Deutsche Bank
Saved
Previous
Next
If nothing, comes up, please save your slides first
Create a FREE account to continue browsing
Receive Instant Access to 1,000+ slides from companies like McKinsey, Google, and Goldman Sachs
First Name
Last Name
Email
Password
I agree to all
Terms & Privacy Policy
Thank you! Your submission has been received!
Oops! Something went wrong while submitting the form.
Have an account?
Sign in
Column Chart
Heatmap
Chevron
Org Chart
Infographic
Callouts
Timeline
List
Graphic
Picture
Process Flow
Diagram
Paragraph
Map
Table
Framework
Subtitle
Takeaway Box
Icon
Other Chart
Radar Chart
Waterfall Chart
Mekko Chart
Pie Chart
Scatter Plot
Line Chart
Bar chart
Bullet points