My Account
My Slides
Search by Category
Templates
View All Templates
Download Template Slides
✦ AI Search
Feedback
Login
Logout
Get Started
Browse all Slides
Browse all Slides
Create a FREE Account
Instant access to 1,000+ real slides from top companies like McKinsey, BCG, Goldman Sachs, Google and many more!
First Name
Last Name
Email
Password
I agree to all
Terms & Privacy Policy
Thank you! Your submission has been received!
Oops! Something went wrong while submitting the form.
Have an account?
Sign in
Saved Slides
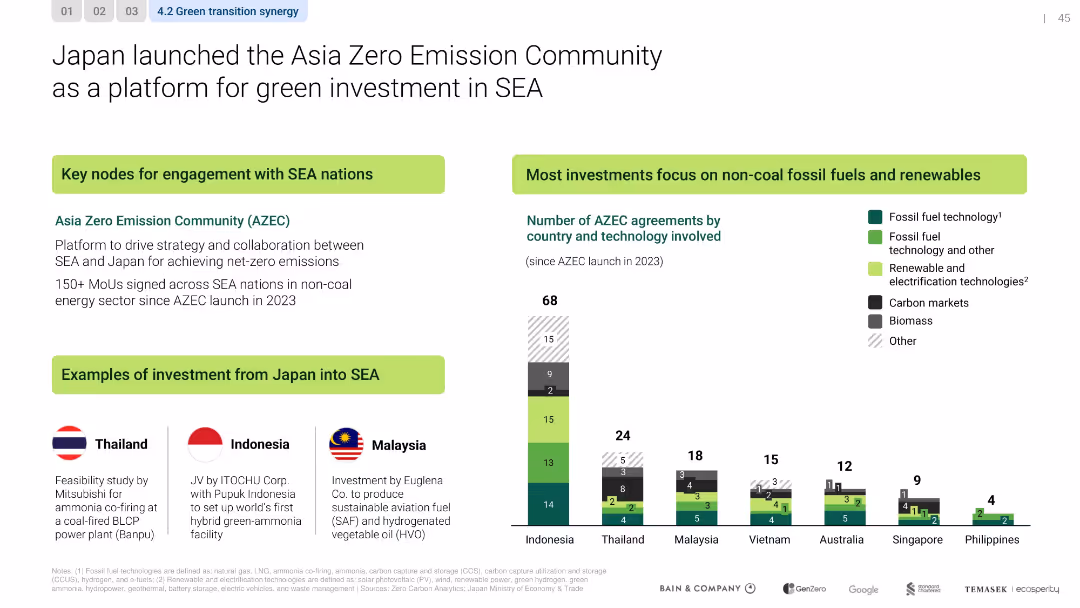
Sectioned layout with bar chart, flag-labeled investment examples, and callout boxes
Strategic Planning
Government & Public Sector
The slide introduces Japan’s Asia Zero Emission Community initiative, promoting over 150 MoUs across SEA in green sectors. Investment examples are provided by country, with a strong emphasis on renewables and fossil alternatives.
AZEC, Japan, SEA, renewable energy, MoUs, net-zero, policy, investment
Mixed Chart
Bain
Saved
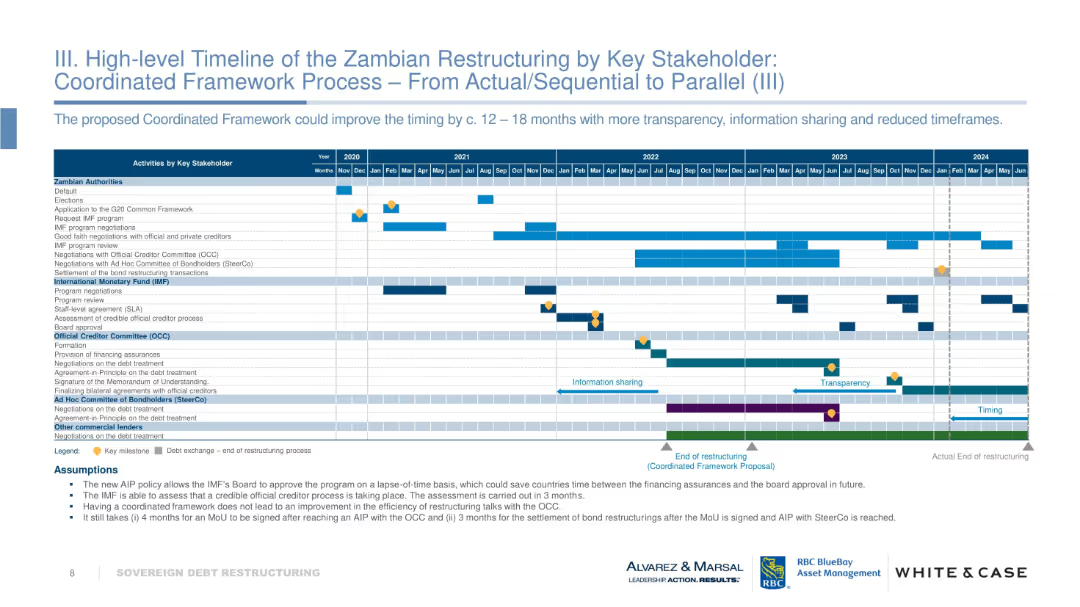
Gantt chart similar to Slide 16579, but showing a more efficient "Coordinated Framework" scenario with transparency, parallel steps, and shorter timelines. Assumptions listed at bottom.
Regulatory and Compliance
Government & Public Sector
Suggests an improved framework for Zambia’s debt restructuring to save time. Proposes more parallel processing, better information sharing, and reduced waiting periods. Aims to finish the process 12–18 months earlier than under the current sequential approach.
restructuring, coordination, transparency, Zambia, IMF, OCC, sovereign debt, reform
Table
Alvarez & Marsal
Saved
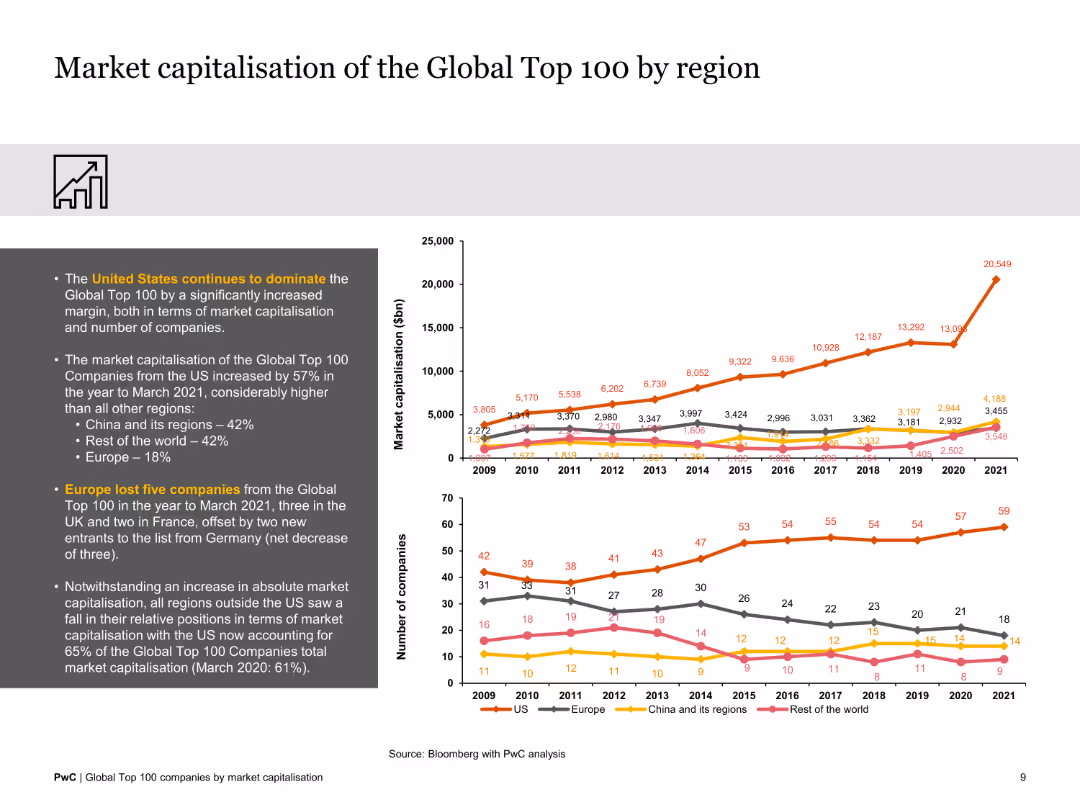
Contains two line charts displaying regional market capitalization data and the number of companies from each region. The slide is visually organized and data-rich.
Market Analysis and Trends
Financial Services
The slide provides an analysis of market capitalization by region, showing the dominance of the US and comparing it with other regions like Europe, China, and the rest of the world.
regional analysis, market dominance, US, Europe, China, financial comparison, global trends
Multiple Chart
PwC/Strategy&
Saved
The slide is divided into three main sections, each with its header and corresponding icons. On the left, there are two sections with bullet points discussing solar PV and offshore wind technologies. The right side features larger text and infographics, showing the percentage figures and other key points regarding net-zero power and growth in solar and wind power.
Strategic Planning
Energy & Utilities
This slide presents the disruptive potential of renewable energy sources in the electric power, natural gas, and utilities industries. It emphasizes required capabilities for scaling solar PV and offshore wind, as well as the expected market share from renewable sources by 2050. The focus is on strategic planning and preparation for the shift to a larger renewable energy mix, highlighting the importance of long-duration energy storage and the smart grid in achieving these goals. It is tailored for stakeholders and decision-makers involved in energy policy planning, infrastructure development, and investment in renewable technologies.
renewable energy, solar PV, offshore wind, long-duration storage, smart grid, net-zero power, energy transition, market growth, strategic planning, sustainability
Boxed
McKinsey
Saved
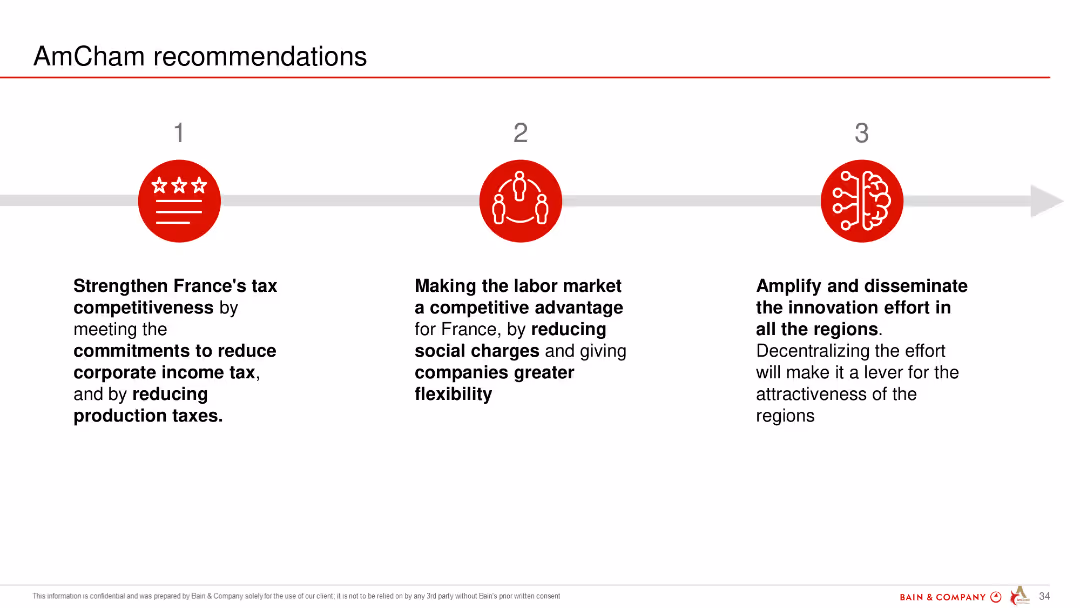
This slide uses a simple layout with three key recommendations for strengthening France's competitiveness, each with an icon and brief description.
Strategic Planning
Professional Services
The slide outlines AmCham's three main recommendations for France: improving tax competitiveness, making the labor market more flexible, and amplifying innovation efforts.
recommendations, AmCham, competitiveness, tax, labor market, innovation
Linear Flow
Bain
Saved
Features a complex matrix assessing strategic capabilities against priorities, using icons and color coding to enhance readability.
Operational Efficiency
Professional Services
Analyzes current organizational capabilities versus strategic importance to prioritize initiatives and prepare for new business realities, aiding leaders in decision-making.
Strategic planning, Capability assessment, Business strategy, Leadership
Header Vertical
BCG
Saved
The slide features a table listing key performance indicators (KPIs) for each stage of the grain supply chain, including cost, emissions, and utilization metrics.
Performance Metrics and KPIs
Agriculture & Food Production
The slide outlines the KPIs used to evaluate the competitiveness of the grain supply chain, providing benchmarks for cost efficiency, emissions, and other operational metrics.
KPIs, grain supply chain, performance metrics, cost efficiency, emissions, utilization, benchmarking, agriculture, food production
Table
LEK
Saved
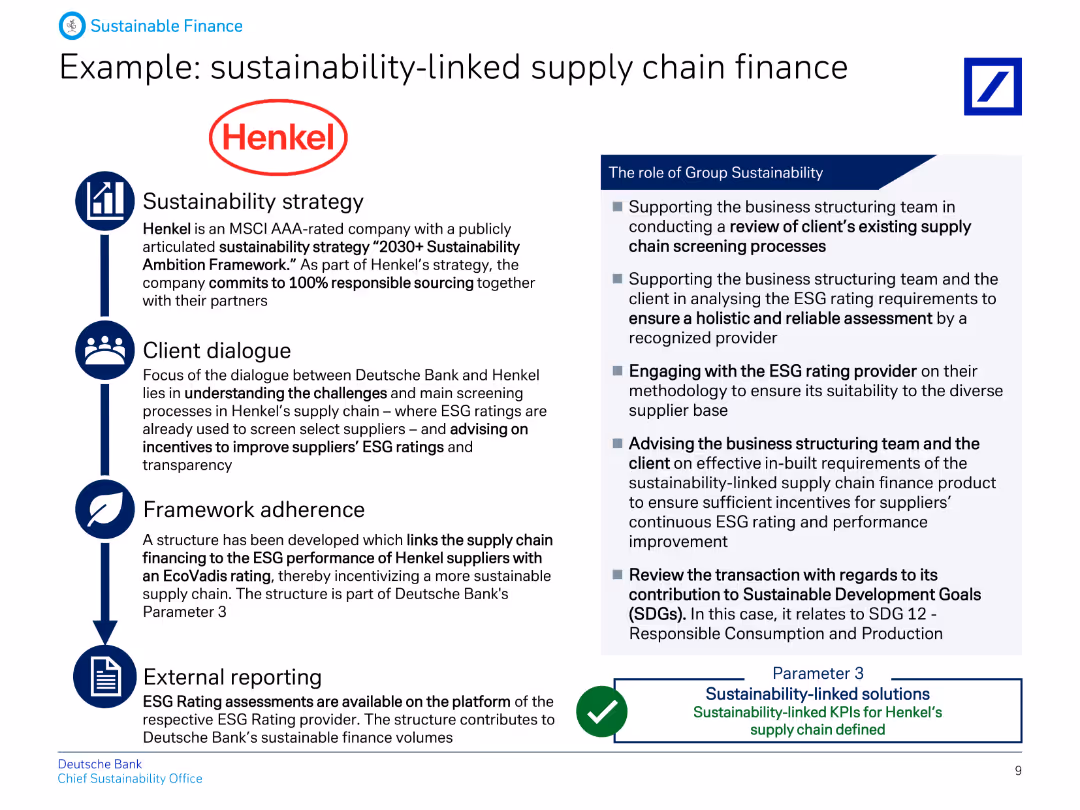
This slide presents a case study with Henkel, detailing their sustainability strategy, client dialogue, framework adherence, and external reporting, with relevant icons.
Client Case Studies
Financial Services
Provides an example of how Deutsche Bank supports Henkel in sustainability-linked supply chain finance, outlining the strategy, client dialogue, framework adherence, and reporting.
Sustainability, supply chain, finance, Henkel, strategy, client, framework, reporting, banking, ESG
Vertical Flow
Deutsche Bank
Saved
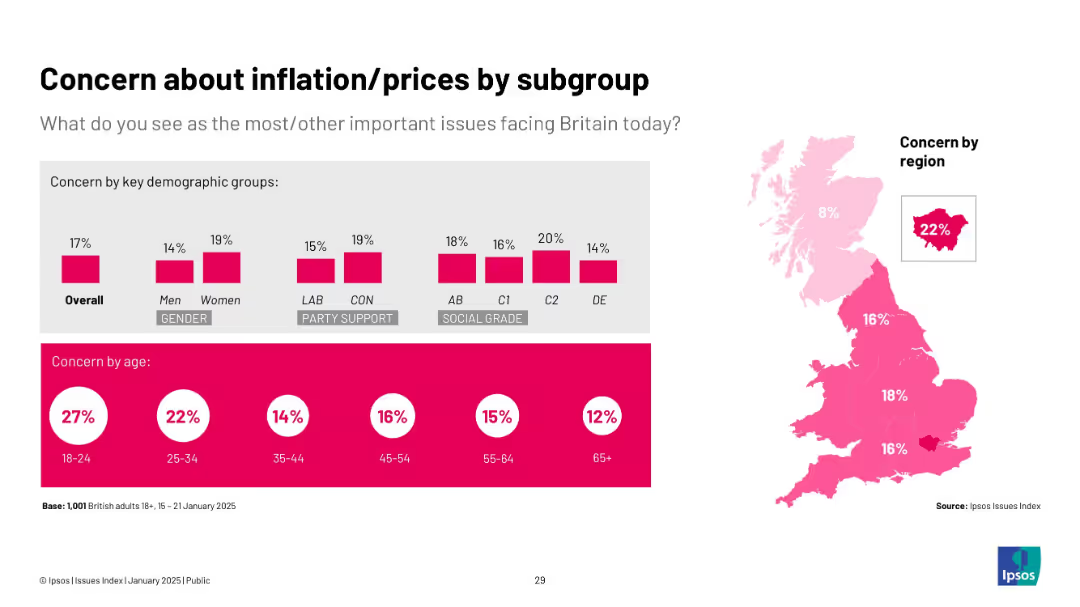
Mixed visuals: bar charts by gender, party, social grade, age + regional heat map.
Market Analysis and Trends
Financial Services
This slide examines public concern over inflation and pricing. Concern is strongest among women, Conservatives, and mid-age groups. London shows the highest regional concern. The map and bars break down worry by demographics.
inflation, prices, region, demographics, Ipsos, cost of living
Multiple Chart
IPSOS
Saved
Features text, a key opportunities header, and a bubble chart with axes representing cost and time to implement.
Regulatory and Compliance
Government & Public Sector
Discusses family law reform opportunities, rated by cost and implementation time, suggesting more efficient legal processes.
law reform, judicial efficiency, case management, legal processes, implementation cost, opportunity assessment
Mixed Chart
PwC/Strategy&
Saved
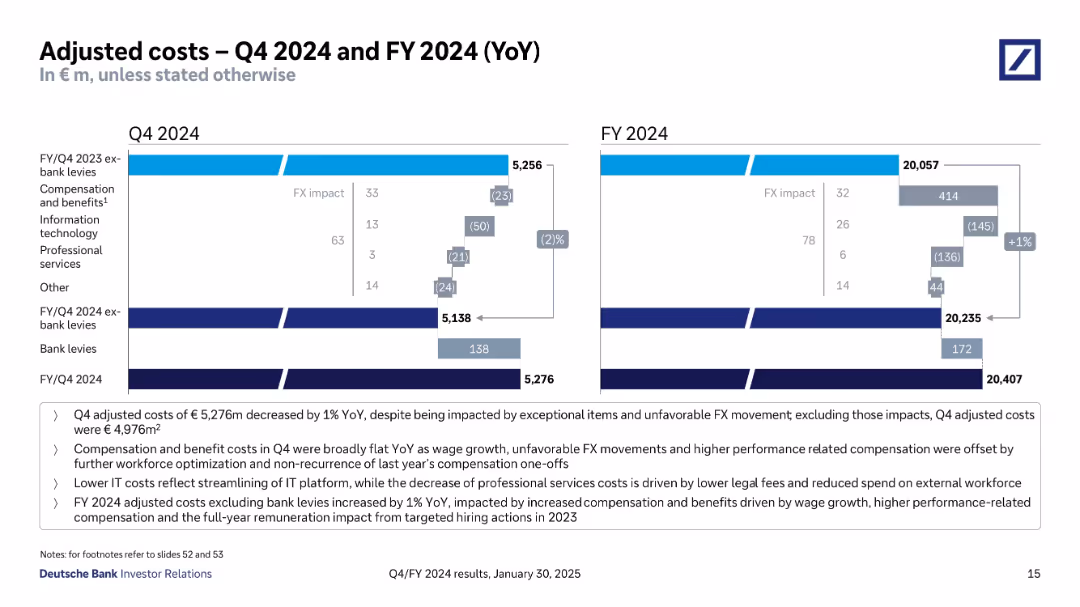
Two waterfall charts (Q4 and FY) compare costs YoY, with color-coded impact bars. Key highlights are bullet-listed below.
Operational Efficiency
Financial Services
Analyzes cost movements in Q4 and FY 2024, highlighting effects of FX, IT cost savings, and compensation changes. Distinguishes between total adjusted costs and bank levies. Shows slight YoY cost increase due to targeted hiring and wage growth.
adjusted costs, IT savings, compensation, FX impact, bank levies
Mixed Chart
Deutsche Bank
Saved
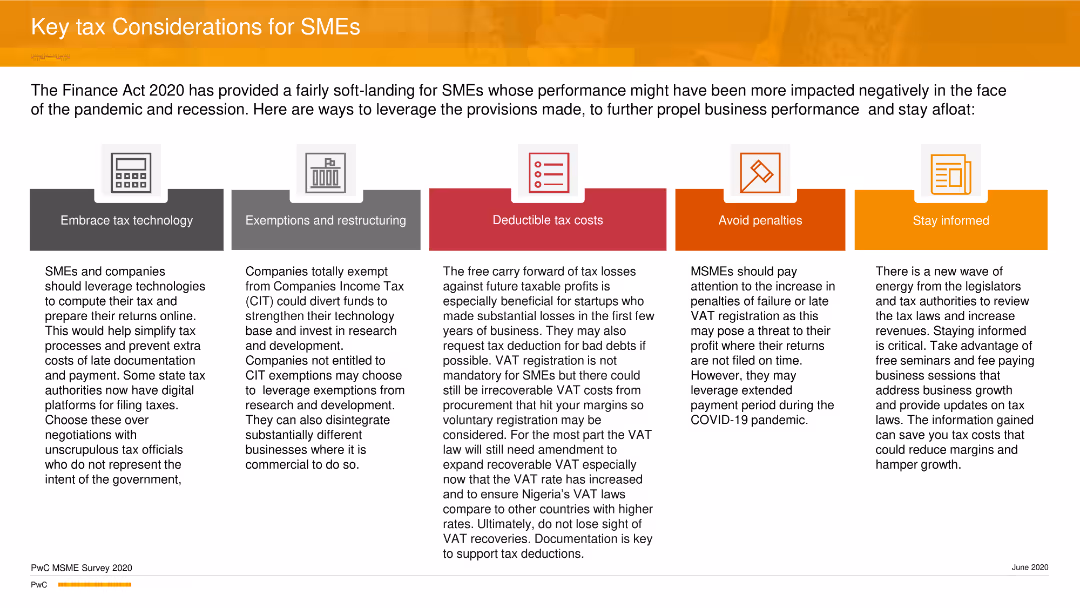
The slide features five icons representing key tax considerations: technology, exemptions, deductible costs, penalties, and staying informed.
Strategic Planning
Financial Services
The slide offers strategic tax considerations for SMEs, focusing on leveraging technology, understanding exemptions, managing deductible costs, avoiding penalties, and staying informed about tax laws to improve business performance during the pandemic and recession.
Tax, SMEs, Strategy, Planning, Business, PwC
Pillar
PwC/Strategy&
Saved
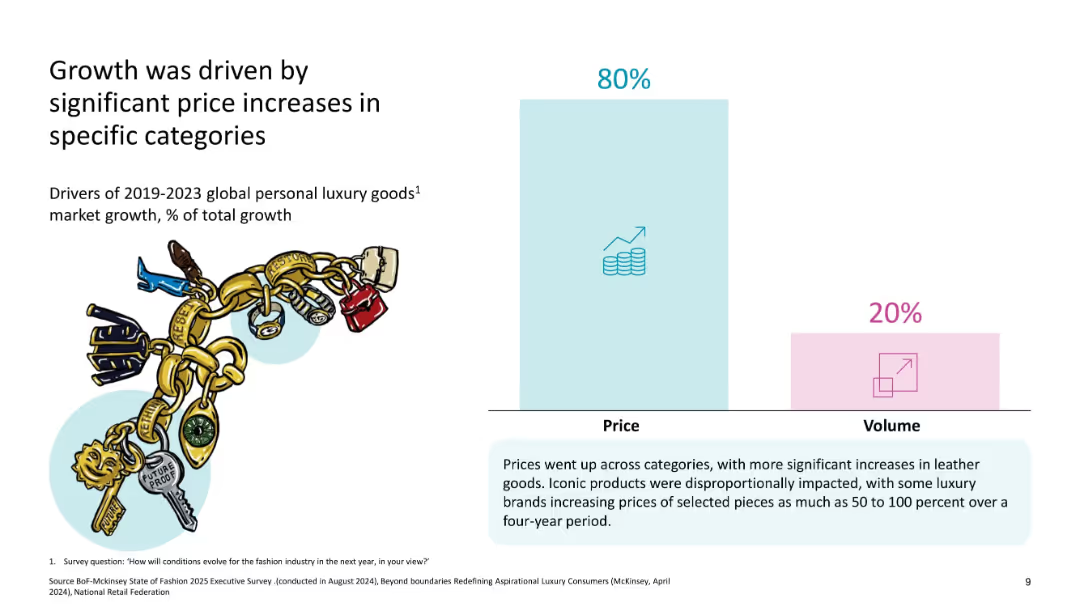
One large bar chart showing 80% of growth from price vs 20% from volume
Pricing Strategies
Consumer Goods
The slide highlights that the majority of growth in luxury goods from 2019–2023 was due to price increases, especially in leather goods, rather than volume, reflecting brand pricing power.
price increase, volume, luxury growth, leather goods, pricing power, market drivers
Mixed Chart
McKinsey
Saved
Slide displays bar graphs, text sections, and percentage changes. Colors differentiate various elements, with clear labels for each data set.
Product and Service Analysis
Financial Services
Highlights the growth of digital products and installment lending customers. Could be used in strategic presentations or business development discussions.
digital products, installment lending, customer growth, pay-over-time solutions
Table
JP Morgan
Saved
Three pie charts with color-coded segments for geographic loan distribution and loan composition in ICG, PBWM, and Legacy Franchises sectors, with column charts below detailing components.
Financial Performance
Financial Services
Compares credit portfolios across regions and business segments, illustrating geographical distribution and loan type composition, showing the global reach and diversity in financial services.
Credit Portfolio, Geographic Distribution, Loan Composition, ICG, PBWM, Legacy Franchises, Financial Services, Comparative Analysis, Global Reach
Multiple Chart
Citigroup
Saved
Graphically rich slide with column charts depicting capital usage and developments in regulatory capital efficiency, alongside explanatory texts and arrows for emphasis.
Strategic Planning
Financial Services
Details the bank's strategic adjustments in capital management aimed at enhancing long-term shareholder value and financial stability through sustainable investments and efficiency improvements.
capital management, long-term value, financial stability, shareholder value, regulatory efficiency
Mixed Chart
Deutsche Bank
Saved
Includes a line graph showing 'Growth in world oil supply and demand', and extensive text explaining the current status and challenges of the oil and gas sector post-market collapse.
Industry Overview
Energy & Utilities
Analyzes the recovery trends in the oil and gas industry, noting new projects and changes in market dynamics, alongside challenges like decline in new discoveries and geopolitical issues.
Oil and Gas, Recovery, Challenges, Market Trends
Mixed Chart
PwC/Strategy&
Saved
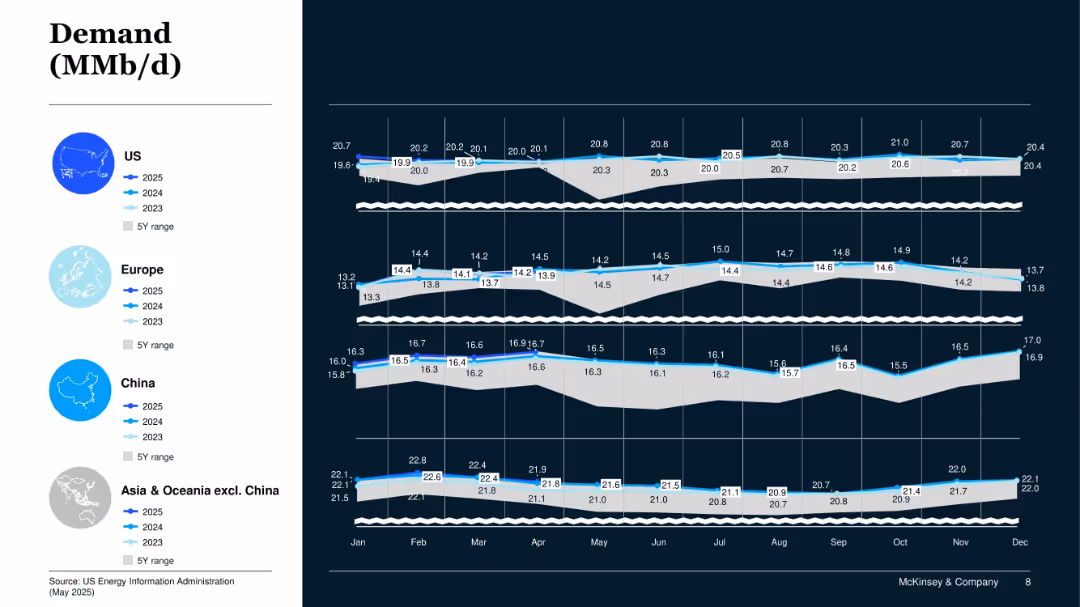
Panel chart with four geographic segments (US, Europe, China, Asia/Oceania excl. China); shows 2023–2025 demand vs 5Y range.
Market Analysis and Trends
Energy & Utilities
This slide provides a geographic breakdown of projected oil demand through 2025, highlighting stronger demand in China and Asia-Pacific, with stability or slight decline in US and Europe.
Regional Demand, Oil Consumption, Asia, Europe, US, 2025 Projections
Mixed Chart
McKinsey
Saved
The slide includes two donut charts showing the role of private market investing in hedge fund strategies and investor requirements for limiting exposure to private equity. An image on the left shows a laptop displaying financial charts. The charts use shades of purple.
Investment Analysis
Financial Services
The slide discusses the significant growth in private market investing among hedge fund managers, driven by investor sentiment and the quest for yield, with many managers planning to increase exposure to this asset class.
Private market investing, hedge funds, private equity, investment strategies, growth
Multiple Chart
EY
Saved
This slide features a bar graph with annotated percentages to show the consumer distribution across different city tiers in Indonesia, complemented by a brief explanatory text.
Market Analysis and Trends
Technology & Software
This slide provides statistics on consumer distribution across metropolitan, rapid urbanites, and slow adoptors, highlighting the majority of laggards in non-metropolitan areas.
consumer distribution, city tiers, metropolitan, urbanites, laggards, Indonesia, digital adoption
Single Chart
Kearney
Saved
The slide includes a pie chart and column charts, with text describing the evolution of ESG awareness.
Regulatory and Compliance
Environmental Services & Sustainability
This slide discusses how organizations are evolving in their focus on ESG risks, with statistics and survey results.
ESG, risks, evolution, awareness, survey
Single Chart
Deloitte
Saved
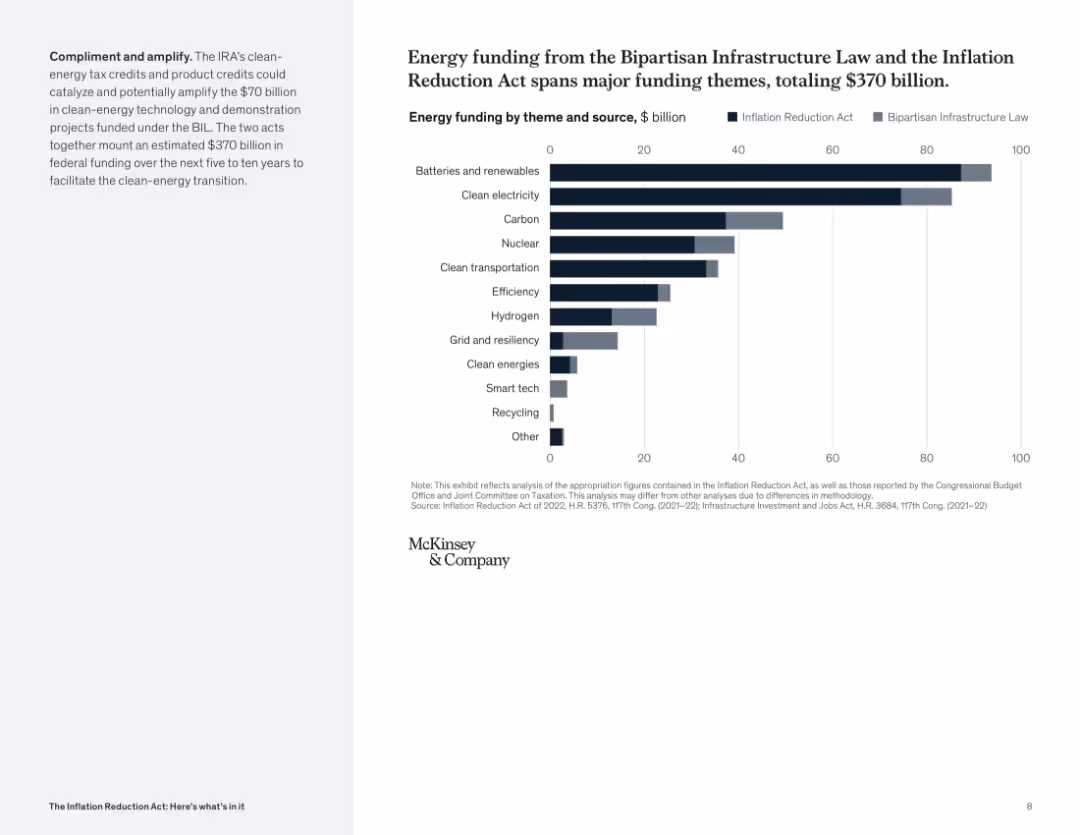
Horizontal bar chart comparing funding across categories and laws; dual color-coded bars for each theme; left text explains coordination between laws.
Market Analysis and Trends
Energy & Utilities
The chart compares funding from the Bipartisan Infrastructure Law and the Inflation Reduction Act across key energy themes. It highlights categories like batteries, clean electricity, and carbon capture, underscoring joint federal efforts.
energy funding, infrastructure law, clean energy, batteries, hydrogen, carbon, comparison
Mixed Chart
McKinsey
Saved
The slide includes text and circular charts depicting percentages for top use cases cited by IT & InfoSec leaders, including data analysis, marketing, and logistics.
Financial Performance
Technology & Software
This slide identifies the primary use cases for Generative AI as cited by IT & InfoSec leaders, such as data analysis, fraud detection, and research & development.
Generative AI, Use Cases, IT Leaders, Data Analysis, Marketing
Single Chart
Gartner
Saved
The slide presents a pie chart comparison for 2020 and 2030 with text annotations. The visual elements are well-arranged, utilizing white space effectively on a purple background.
Market Analysis and Trends
Technology & Software
This slide predicts economic shifts in Indonesia, focusing on the growing importance of non-metropolitan areas in GDP contribution.
GDP growth, non-metropolitan, economic importance, forecast
Table
Kearney
Saved
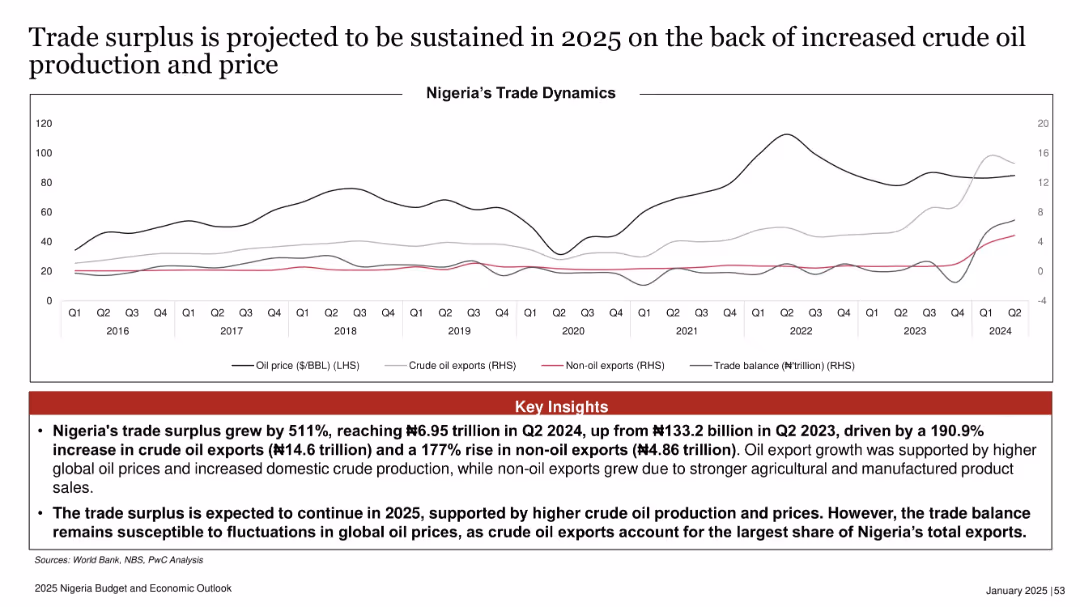
Line graph tracking oil prices, crude/non-oil exports, and trade balance from 2016–2024. Summary insights in red box below.
Investment Analysis
Energy & Utilities
The slide illustrates Nigeria's rising trade surplus driven by increased oil production and prices, reaching ₦6.95 trillion in Q2 2024. It suggests continued surplus into 2025 while acknowledging vulnerability to oil price fluctuations.
trade surplus, oil exports, non-oil exports, crude production, 2025 outlook, Nigeria economy, oil prices
Mixed Chart
PwC/Strategy&
Saved
Previous
Next
If nothing, comes up, please save your slides first
Create a FREE account to continue browsing
Receive Instant Access to 1,000+ slides from companies like McKinsey, Google, and Goldman Sachs
First Name
Last Name
Email
Password
I agree to all
Terms & Privacy Policy
Thank you! Your submission has been received!
Oops! Something went wrong while submitting the form.
Have an account?
Sign in
Column Chart
Heatmap
Chevron
Org Chart
Infographic
Callouts
Timeline
List
Graphic
Picture
Process Flow
Diagram
Paragraph
Map
Table
Framework
Subtitle
Takeaway Box
Icon
Other Chart
Radar Chart
Waterfall Chart
Mekko Chart
Pie Chart
Scatter Plot
Line Chart
Bar chart
Bullet points