My Account
My Slides
Search by Category
Templates
View All Templates
Download Template Slides
✦ AI Search
Feedback
Login
Logout
Get Started
Browse all Slides
Browse all Slides
Create a FREE Account
Instant access to 1,000+ real slides from top companies like McKinsey, BCG, Goldman Sachs, Google and many more!
First Name
Last Name
Email
Password
I agree to all
Terms & Privacy Policy
Thank you! Your submission has been received!
Oops! Something went wrong while submitting the form.
Have an account?
Sign in
Saved Slides
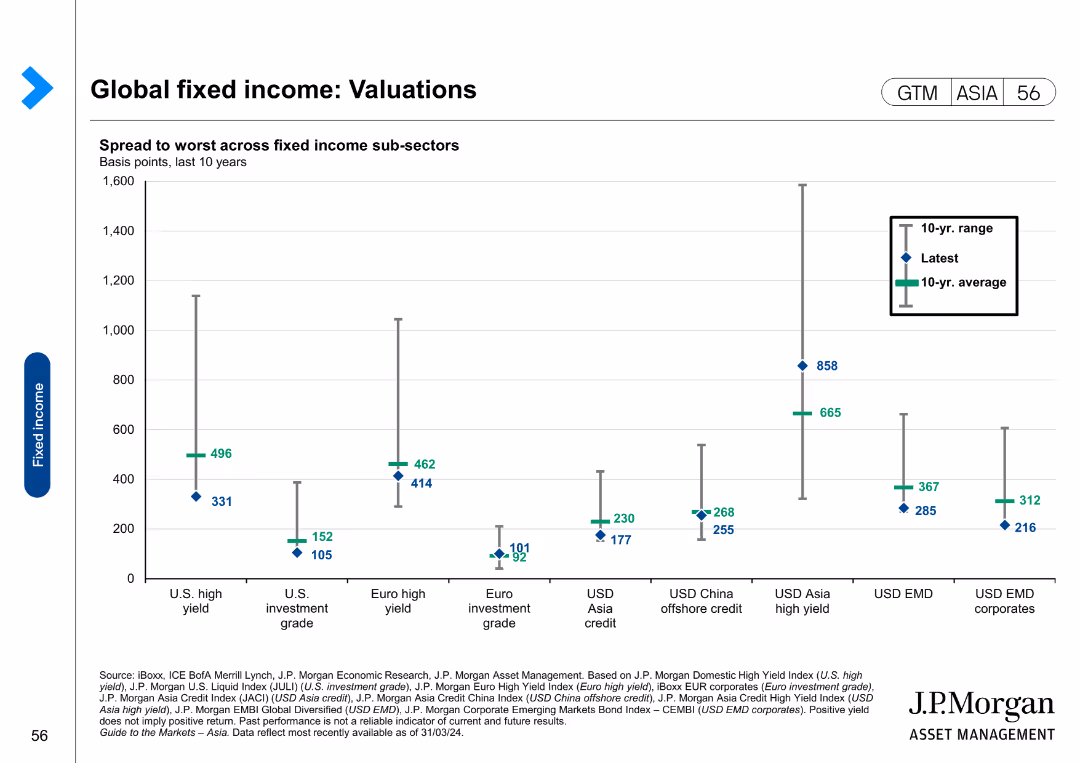
The slide features a scatter plot showing the spread to worst across fixed income sub-sectors over the last 10 years.
Market Analysis and Trends
Financial Services
The slide analyzes valuations in global fixed income markets, focusing on spreads across various sub-sectors. It is used for market analysis and investment decision-making.
Global fixed income, valuations, spreads, sub-sectors, market analysis, investment
Single Chart
JP Morgan
Saved
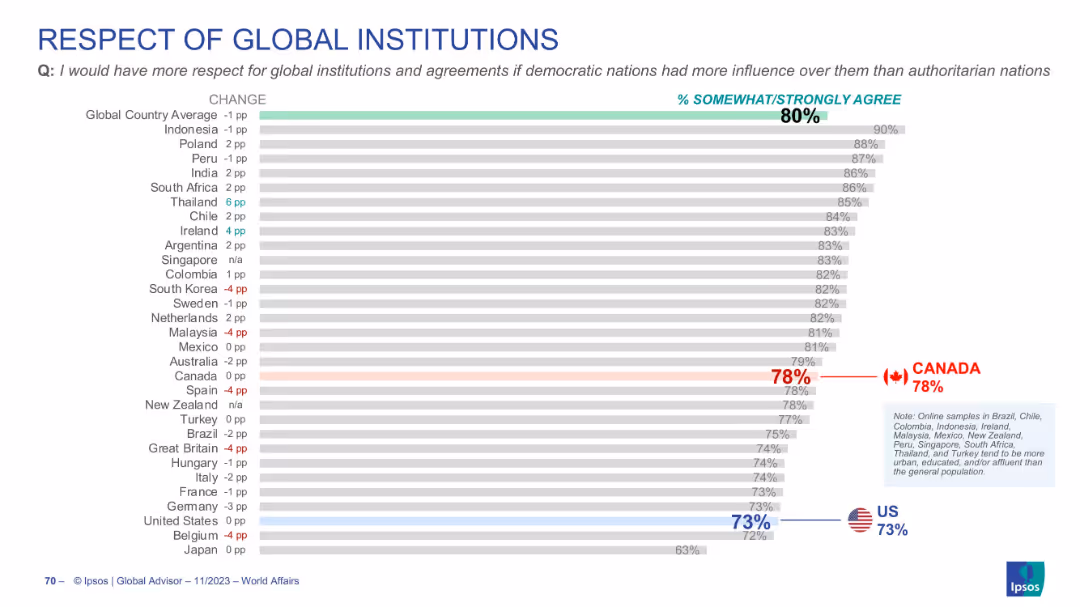
Bar chart displaying agreement on increased respect if democratic nations lead global institutions; sorted by agreement level; clear with flag markers.
Strategic Planning
Government & Public Sector
The chart shows that 80% globally agree they’d respect global institutions more if led by democracies. Canada ranks slightly below the average at 78%, while the US sits at 73%. Emphasizes the desire for democratic leadership in international affairs.
global institutions, democracy, respect, Canada, US, global governance
Single Chart
IPSOS
Saved
Comprising column charts, a table, and metrics presented in a well-organized manner, this slide compares net interest income and loans across different sectors.
Operational Efficiency
Financial Services
Examines the net interest income by segment, detailing loan categories and providing metrics on the allocation and growth of loans. It serves to analyze financial health and operational efficiency within the company's loan management strategy.
Net Interest, Loans, Financial Health, Operational Efficiency, Metrics
Multiple Chart
Goldman Sachs
Saved
The slide features a line graph tracking CEO optimism versus pessimism over time, alongside a detailed analysis. The layout is clean with a balance of text and visual data.
Market Analysis and Trends
Professional Services
Depicts a shift in CEO sentiment towards economic growth, showcasing an increasing trend in pessimism. Useful for discussions on market sentiment and planning.
CEO, Pessimism, Optimism, Economic Growth, Survey
Mixed Chart
PwC/Strategy&
Saved
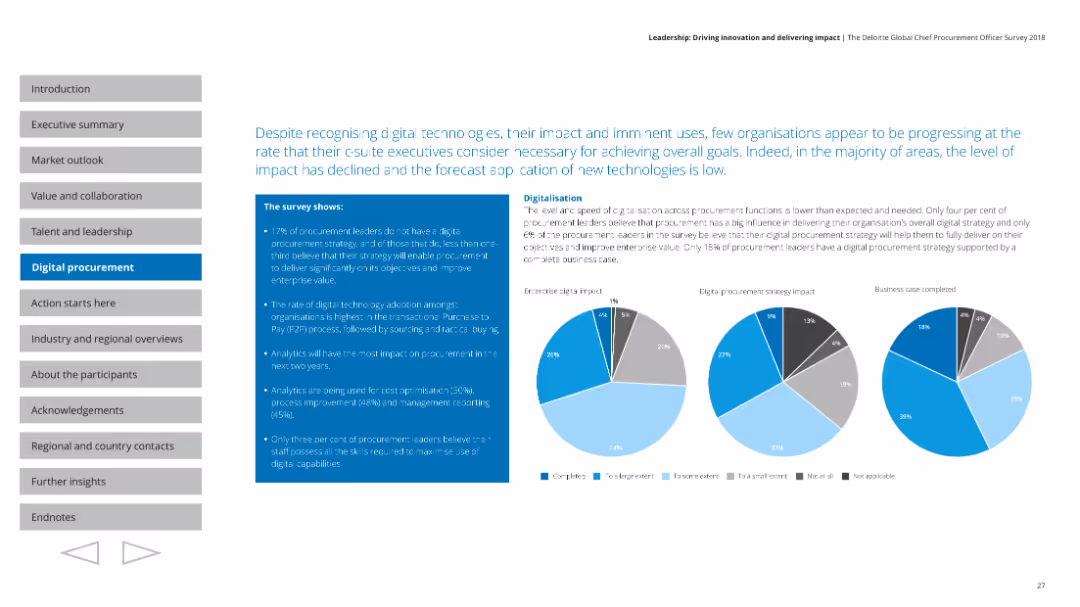
The slide includes column charts and pie charts, visually dense with key data points and statistics on digital procurement strategies and their impact.
Technology and Digital Transformation
Professional Services
Highlights the lack of digital procurement strategies among leaders, the adoption rates of digital technology, and key areas of digital impact.
Digital procurement, analytics, adoption, strategy, impact
Multiple Chart
Deloitte
Saved
The slide includes three column charts showing Assets Under Custody and corresponding revenue and operating margins from 2016 to 2018, emphasizing significant changes and growth.
Operational Efficiency
Financial Services
Targeted at operations managers and financial analysts, the slide discusses the transformation in Securities Services, illustrating how new business wins and operational model improvements have led to notable financial achievements.
securities services, transformation, assets, revenue, operating margins, financial results, growth, efficiency
Multiple Chart
JP Morgan
Saved
Featuring a map of the U.S., this slide provides data points on the firm’s advisors, clients, and revenues, emphasizing their market presence. The design uses contrasting colors and icons to depict expansion in high net worth services.
Market Analysis and Trends
Financial Services
The slide promotes the firm's expansion into the high net worth sector within the U.S., highlighting its presence in key metropolitan areas and the importance of management fees to its revenue stream.
high net worth, expansion, U.S. market, advisors, revenue
Graphic
Goldman Sachs
Saved
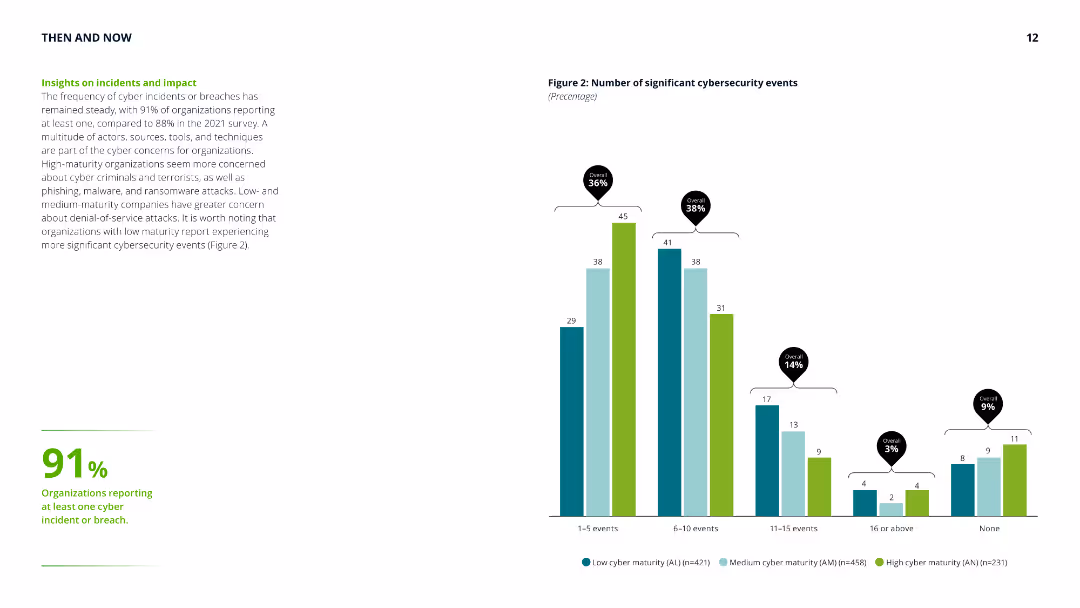
Column chart showing the number of significant cybersecurity events, with accompanying text highlighting the steady frequency of cyber incidents and differences in concerns across maturity levels.
Risk Assessment and Management
Technology & Software
Provides insights into the frequency and impact of cybersecurity incidents, emphasizing the concerns of low, medium, and high-maturity organizations and their experiences with cyber threats.
cyber security, incidents, impact, risk assessment, maturity levels, cyber threats, frequency, organization concerns
Mixed Chart
Deloitte
Saved
A central cloud image with connected icons and text bubbles, facilitating a structured debate on cloud and edge computing.
Technology and Digital Transformation
Technology & Software
Highlights the main topics of debate concerning the future implications and current issues within cloud and edge computing.
cloud computing, edge computing, debate topics, security, sustainability
Header Vertical
McKinsey
Saved
Features column chart of 'Current NTM P/E vs. 10-Year High, Low, Average' for different sectors. The slide employs stark color contrast to emphasize differences in valuation, and the data is well-structured for ease of analysis.
Investment Analysis
Financial Services
The slide is a deep dive into sector-specific valuation for sectors within the S&P 500, providing essential insights for investors or financial strategists. It enables comparisons with historical valuation trends, facilitating informed decisions in stock selection and portfolio balancing.
Valuation, P/E Ratio, S&P 500, Sector Analysis, Trends
Single Chart
Morgan Stanley
Saved
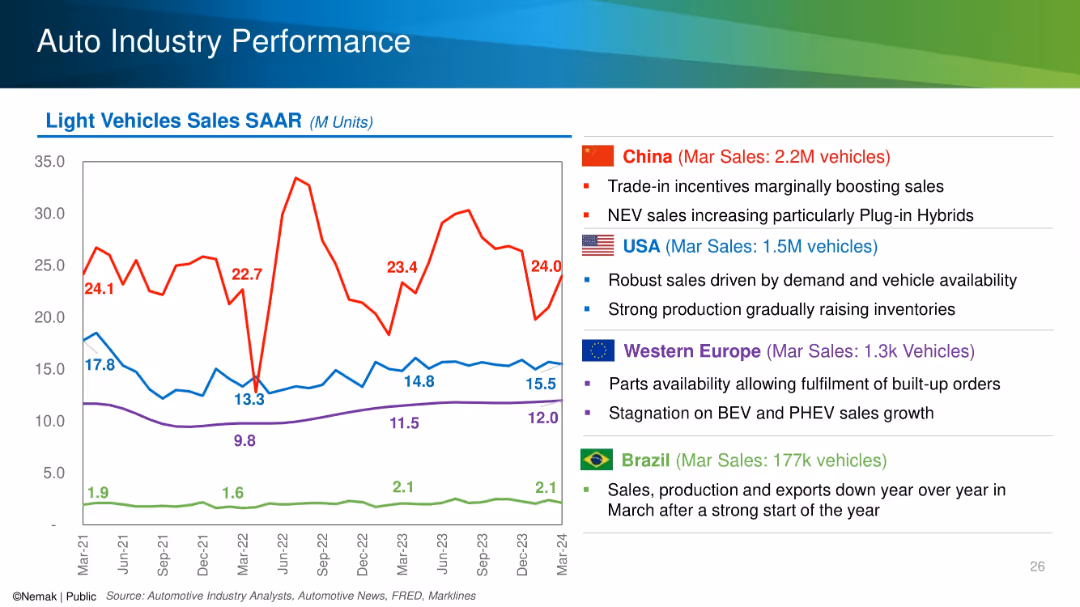
Line chart with SAAR trends for China, USA, Europe, and Brazil alongside country-specific bullet points.
Performance Metrics and KPIs
Industrial & Manufacturing
The slide tracks seasonally adjusted annual rates (SAAR) of light vehicle sales for major global markets and highlights key drivers and challenges in each region, such as incentives in China and stagnation in Europe. March 2024 sales figures are emphasized.
SAAR, auto sales, regional performance, NEV, incentives, inventory
Mixed Chart
Barclays
Saved
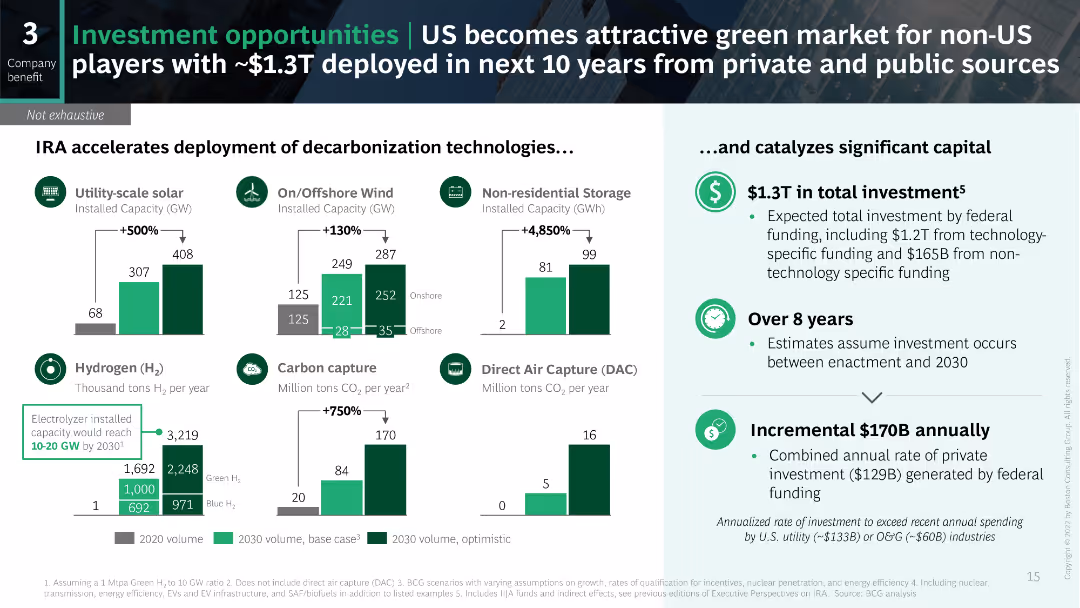
The slide features a variety of visual data elements including bar charts and icons to illustrate the deployment of decarbonization technologies and the associated financial investments. The layout is dense with detailed data and projections.
Investment Analysis
Financial Services
This slide highlights the investment opportunities in the US for decarbonization technologies driven by the IRA, projecting significant private and public investment over the next 10 years and detailing specific areas like solar and wind energy.
investment, decarbonization, IRA, solar, wind
Multiple Chart
BCG
Saved
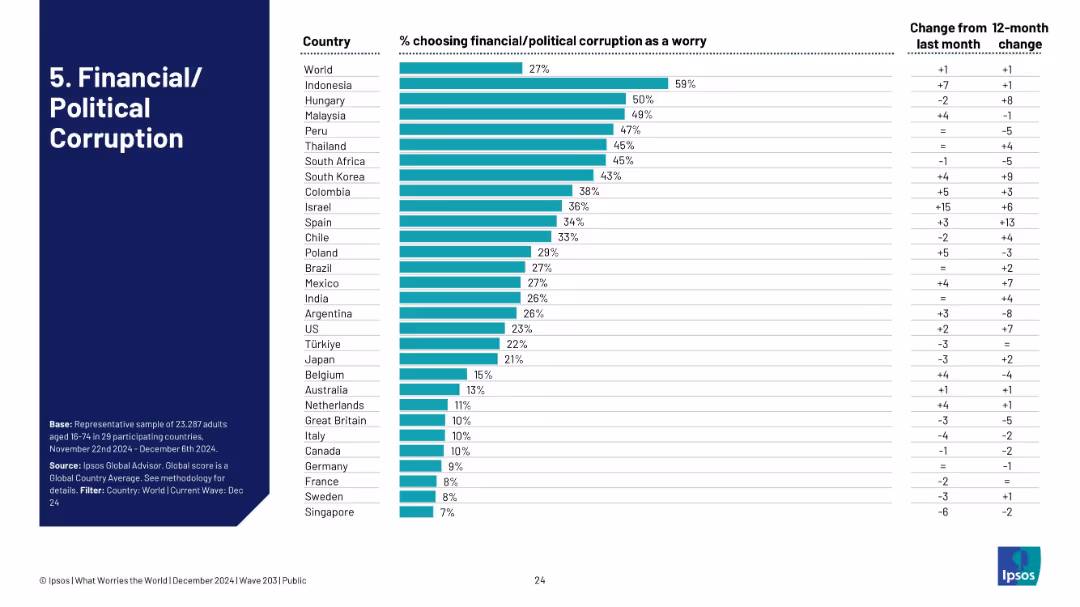
Bar graph depicting the percentage of people citing corruption as a key worry in different countries, with month/year change columns.
Regulatory and Compliance
Government & Public Sector
With 27% of people globally citing corruption as a concern, Indonesia and Hungary stand out. The slide visually compares perceptions by country and time, offering an overview of institutional trust issues worldwide.
corruption, governance, politics, Ipsos, transparency, country trust levels
Single Chart
IPSOS
Saved
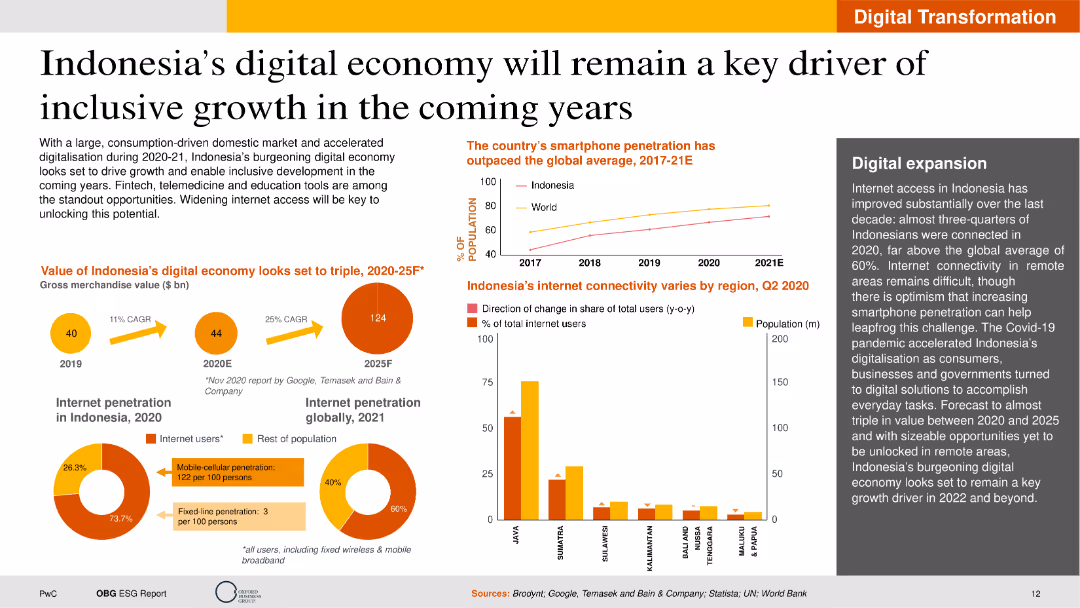
The slide contains text, a column chart showing smartphone penetration, pie charts on internet penetration, and a map. The layout is visually dense with multiple data points but remains well-structured for readability.
Market Analysis and Trends
Telecommunications
This slide highlights the growth of Indonesia's digital economy, emphasizing increased internet connectivity and smartphone usage. It discusses potential economic impacts and future opportunities in digital expansion.
Digital Economy, Indonesia, Growth, Internet, Smartphone
Multiple Chart
PwC/Strategy&
Saved
This slide features a complex table comparing elements of Net Zero plans across various countries with color-coded indicators of progress.
Strategic Planning
Environmental Services & Sustainability
Slide displays a comprehensive table analyzing the effectiveness and comprehensiveness of Net Zero plans in SEA countries, highlighting areas lacking robust strategies. Suitable for policy developers.
Net Zero, SEA, policy, effectiveness, table, strategic planning, color-coded, countries, comparison, environmental
Table
Bain
Saved
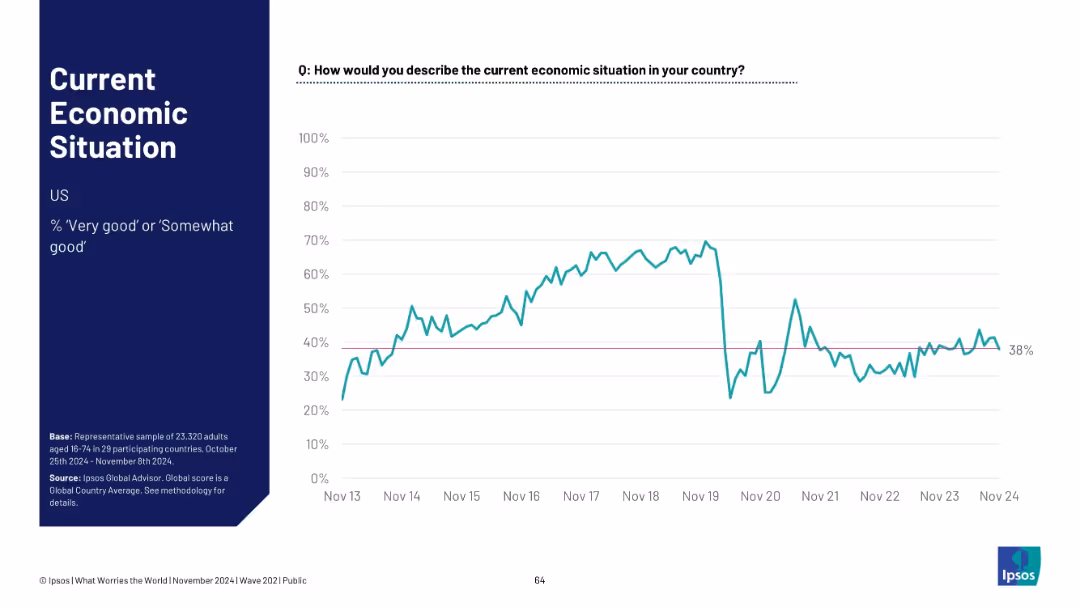
U.S.-focused layout, with typical structure. Graph shows economic sentiment fluctuations ending at 38%
Market Analysis and Trends
Government & Public Sector
The U.S. economy sentiment stands at 38%. A sharp dip around 2020 is followed by partial and uneven recovery. The slide summarizes public opinion on the nation's economic health.
USA, economic sentiment, recession impact, Ipsos data, public view, recovery trends, economic pulse
Single Chart
IPSOS
Saved
The slide has four content boxes each with a heading, a ranking, and three bullet points summarizing strategy aspects. Two larger blue boxes highlight the market leadership position, while two smaller gray boxes detail engagement metrics.
Strategic Planning
Financial Services
This slide focuses on the strides made in Consumer Banking, Branch Network, and Business Banking, juxtaposing the current achievements with future strategic goals. It serves to communicate progress and set a determined outlook for extending market leadership.
Strategy progress, Consumer banking, Market leadership, Business strategy, Future outlook, Banking network
Table
JP Morgan
Saved
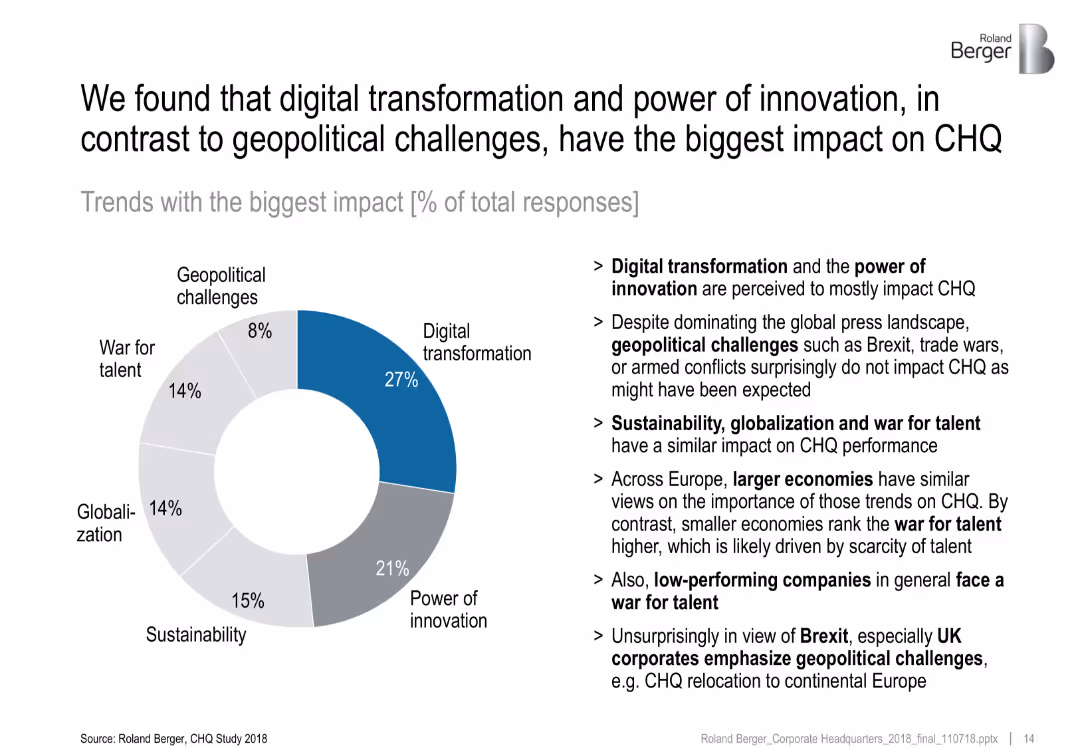
Donut chart with percentage shares of six megatrends; bullet points on the right provide insights
Market Analysis and Trends
Professional Services
This slide reveals survey results on which megatrends most impact CHQ. Digital transformation (27%) and innovation (21%) are dominant, while geopolitical issues score lowest (8%). Text insights interpret regional differences and performance-level correlations.
digital transformation, innovation, impact analysis, geopolitics, survey, CHQ
Mixed Chart
Roland Berger
Saved
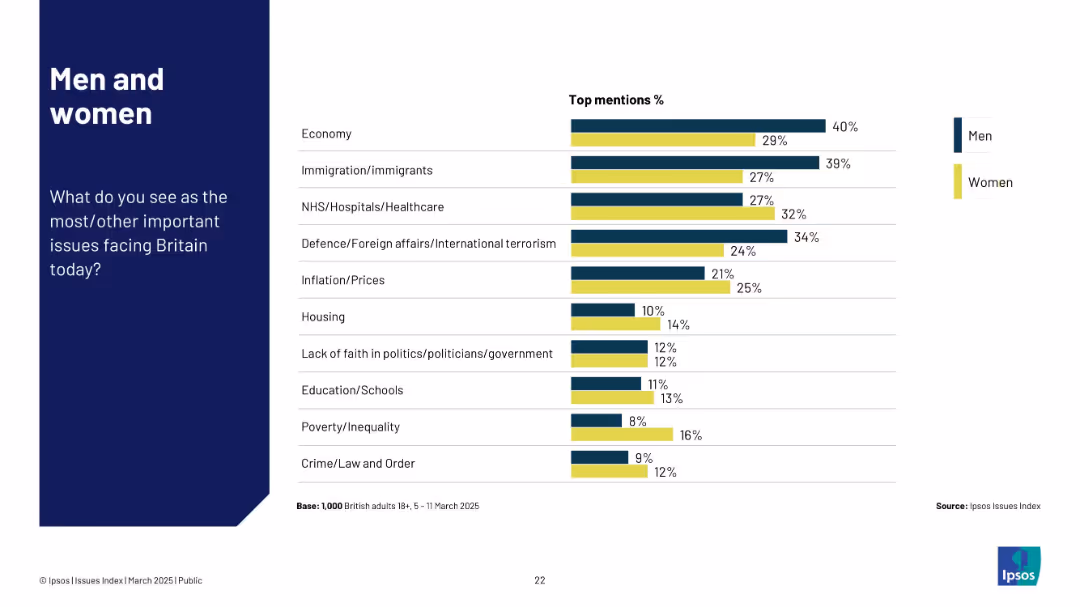
Horizontal bar chart segmented by gender; compares issue concern levels between men and women.
Customer and Market Segmentation
Government & Public Sector
Highlights gender differences in perceived top national issues. Men focus more on economy and foreign affairs, while women report higher concern for healthcare and inequality.
gender comparison, public opinion, economy, healthcare, Ipsos, men vs women, UK issues, segmentation
Mixed Chart
IPSOS
Saved
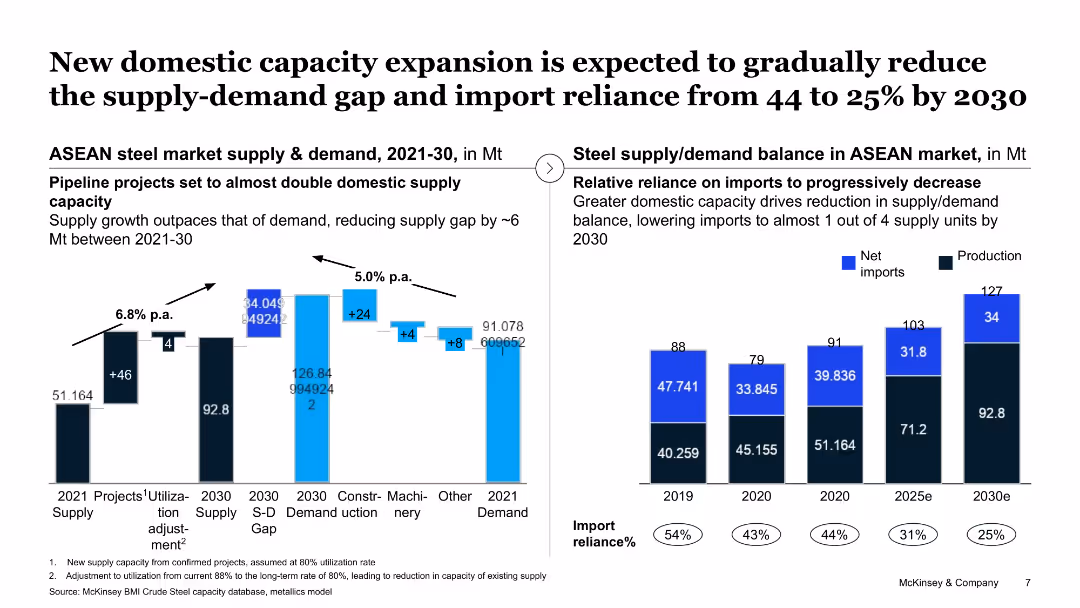
The slide shows a column chart and a line chart displaying supply and demand balance in the ASEAN market, highlighting domestic capacity expansion projects.
Strategic Planning
Industrial & Manufacturing
This slide projects a reduction in the supply-demand gap in the ASEAN steel market by 2030 through new domestic capacity expansions, aimed at reducing import reliance.
domestic capacity, supply-demand gap, ASEAN market, steel, import reliance
Multiple Chart
McKinsey
Saved
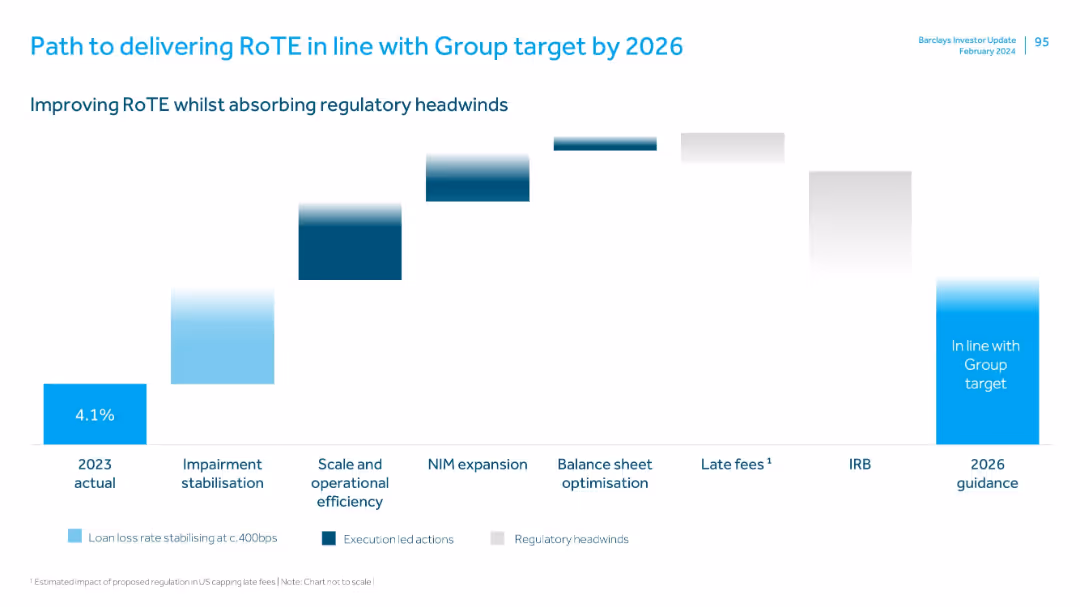
Waterfall chart format with stages marked below, each bar showing incremental impact; uses colors to differentiate action types.
Strategic Planning
Financial Services
Outlines Barclays’ roadmap for improving RoTE to meet Group targets by 2026. Includes execution strategies like impairment stabilization, operational efficiency, NIM expansion, and offsetting regulatory headwinds such as IRB changes and capped late fees.
RoTE, regulatory impact, operational efficiency, NIM, impairment, late fees, IRB, roadmap
Single Chart
Barclays
Saved
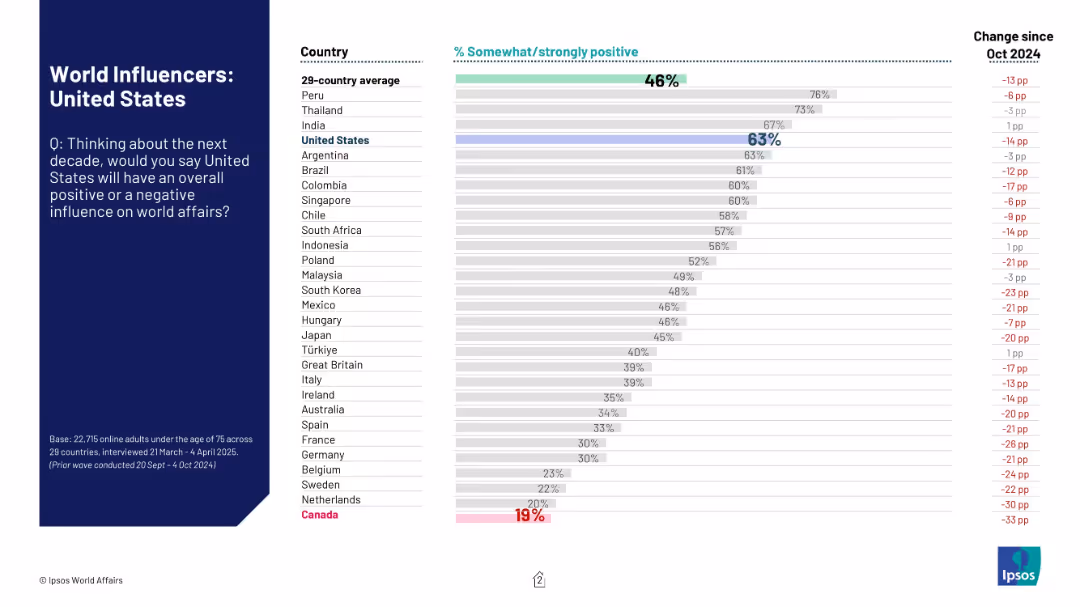
Horizontal bar chart showing positive influence perception of the U.S. by country. Right side shows change vs Oct 2024.
Market Analysis and Trends
Government & Public Sector
This slide highlights global perceptions of the United States’ influence on world affairs over the next decade. It ranks countries by the % of respondents viewing the U.S. influence as positive, and notes changes since October 2024.
U.S. influence, international relations, Ipsos, global perception, country comparison, bar chart, survey data, world affairs, trends
Mixed Chart
IPSOS
Saved
Features column charts detailing the changes in planned vehicle spending due to COVID-19, comparing data from before and during the pandemic across the US, Europe, and Asia.
Market Analysis and Trends
Transportation & Logistics
Evaluates how consumer spending intentions on vehicles have shifted due to the pandemic, offering insights into economic behavior and planning.
vehicle spending, COVID-19 impact, column chart, economic behavior, regional analysis
Multiple Chart
McKinsey
Saved
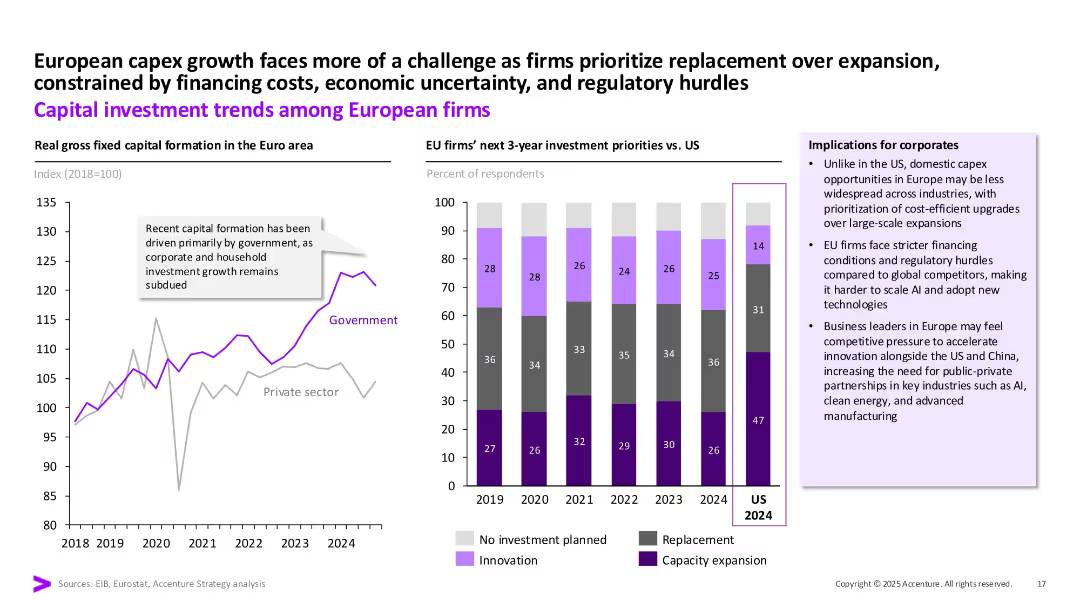
Left: Line graph showing EU capital formation by government/private. Right: Stacked bar chart of EU vs US investment priorities. Text boxes and implication callouts.
Market Analysis and Trends
Financial Services
The slide contrasts public vs private sector investment in the EU, noting government-led growth. It also compares EU and US investment priorities for 2024, highlighting EU’s focus on replacement and innovation under tighter regulatory and financing constraints.
EU, investment, capex, government, private sector, replacement, priorities
Multiple Chart
Accenture
Saved
Pie chart and accompanying text estimating the duration of COVID-19's impact on personal finances. Different time frames are shown as segments of the pie chart.
Market Analysis and Trends
Financial Services
This slide shows Canadian investors' perceptions of how long COVID-19 will affect their personal finances. It includes predictions ranging from a few months to more than 18 months, highlighting uncertainties and differences based on demographics.
COVID-19, Personal Finances, Canadian, Duration, Impact
Mixed Chart
IPSOS
Saved
Previous
Next
If nothing, comes up, please save your slides first
Create a FREE account to continue browsing
Receive Instant Access to 1,000+ slides from companies like McKinsey, Google, and Goldman Sachs
First Name
Last Name
Email
Password
I agree to all
Terms & Privacy Policy
Thank you! Your submission has been received!
Oops! Something went wrong while submitting the form.
Have an account?
Sign in
Column Chart
Heatmap
Chevron
Org Chart
Infographic
Callouts
Timeline
List
Graphic
Picture
Process Flow
Diagram
Paragraph
Map
Table
Framework
Subtitle
Takeaway Box
Icon
Other Chart
Radar Chart
Waterfall Chart
Mekko Chart
Pie Chart
Scatter Plot
Line Chart
Bar chart
Bullet points