My Account
My Slides
Search by Category
Templates
View All Templates
Download Template Slides
✦ AI Search
Feedback
Login
Logout
Get Started
Browse all Slides
Browse all Slides
Create a FREE Account
Instant access to 1,000+ real slides from top companies like McKinsey, BCG, Goldman Sachs, Google and many more!
First Name
Last Name
Email
Password
I agree to all
Terms & Privacy Policy
Thank you! Your submission has been received!
Oops! Something went wrong while submitting the form.
Have an account?
Sign in
Saved Slides
A list detailing NFT use cases across industries like Digital Art, Sports, Music, Real Estate, Gaming, and Finance. Each has icons and descriptions.
Industry Overview
Media & Entertainment
Outlines various NFT applications across multiple sectors, emphasizing the breadth of NFT adoption and its impact on different industries. Essential for industry overview presentations on NFTs.
NFTs, Use Cases, Digital Art, Sports, Music, Real Estate, Gaming, Finance
Table
McKinsey
Saved
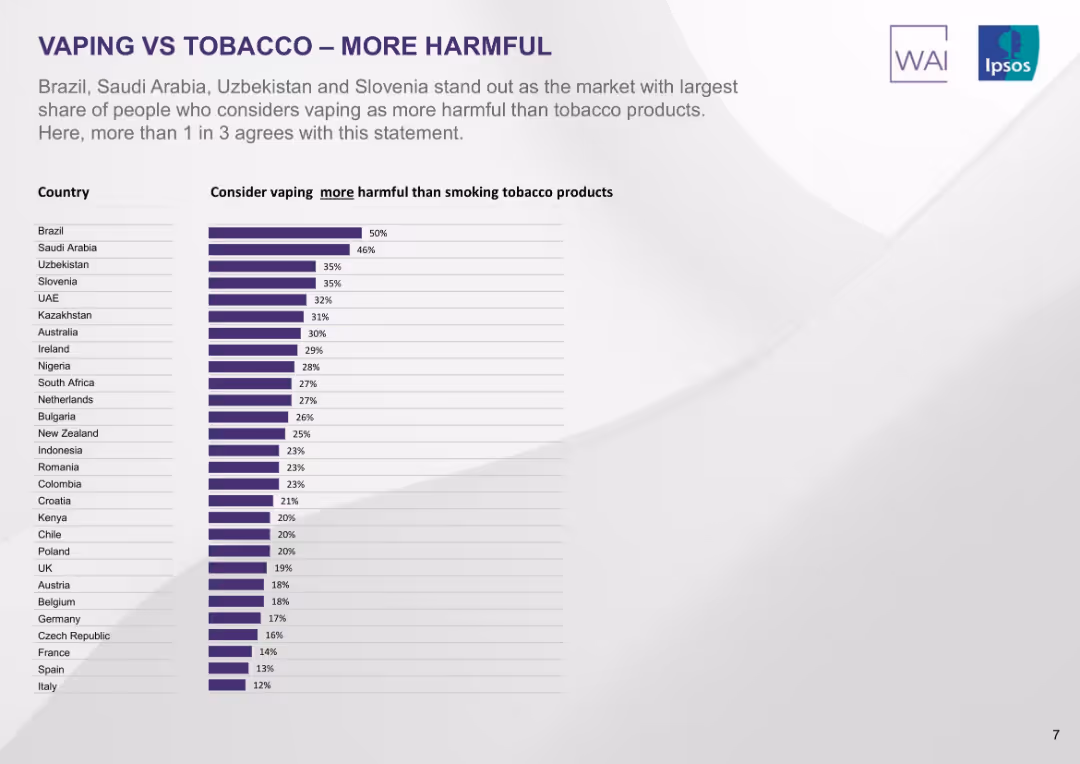
Vertical bar chart listing countries by percentage who view vaping as more harmful than smoking. Purple bars on minimalist background.
Market Analysis and Trends
Healthcare & Pharmaceuticals
This slide isolates the portion of people who view vaping as more harmful than smoking. Brazil leads at 50%, with Saudi Arabia, Uzbekistan, and Slovenia close behind. In many countries, fewer than 30% hold this view.
vaping more harmful, perception, smoking, country comparison, Ipsos, risk views, public opinion, ranked list
Single Chart
IPSOS
Saved
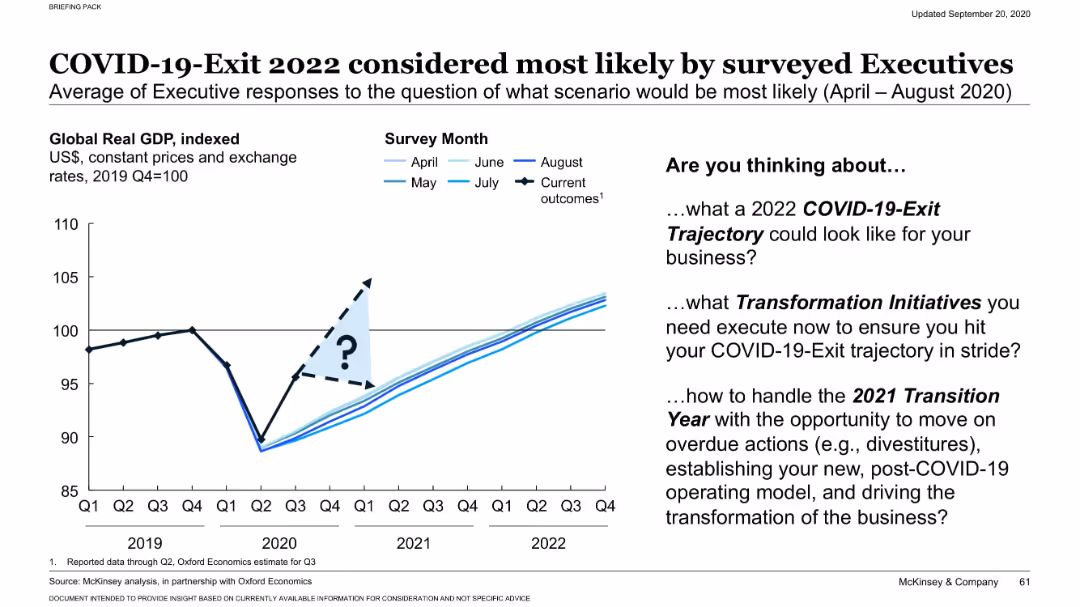
GDP projection chart with multiple scenario lines based on different survey months (April–August). Includes “?” symbol for uncertainty zone. Executive prompts listed on right side in bullet format.
Strategic Planning
Professional Services
Executive surveys from April to August 2020 show growing consensus toward a 2022 exit trajectory for COVID-19’s economic impact. The slide also encourages companies to consider transformation and transition strategies aligned with this likely scenario.
executive survey, COVID-19 exit, GDP forecast, planning, transformation, strategic transition, 2022 recovery, scenario analysis, business planning, trajectory
Mixed Chart
McKinsey
Saved
This slide presents column charts comparing growth in e-Commerce, Transport & Food, and Online Media sectors, with annotations indicating percentage changes and future projections. Layout is balanced with clear headers.
Market Analysis and Trends
Technology & Software
The slide provides a comparative analysis of sector growth in Vietnam, with e-Commerce, Transport & Food, and Online Media seeing growth, while Online Travel decreases. Projected growth rates up to 2025 are also displayed.
Vietnam, e-Commerce, Growth, Projections, Sector Analysis
Multiple Chart
Bain
Saved
This slide presents tables ranking global stock exchanges by number of IPOs and proceeds, highlighting the performance of Asian and US exchanges.
Market Analysis and Trends
Financial Services
The slide analyzes the global IPO market, emphasizing the strong performance of Asian exchanges and the recovery of the US in terms of global share. Detailed rankings by number of IPOs and proceeds are included.
global IPOs, Asian exchanges, US market recovery, stock exchange rankings, financial trends
Multiple Chart
EY
Saved
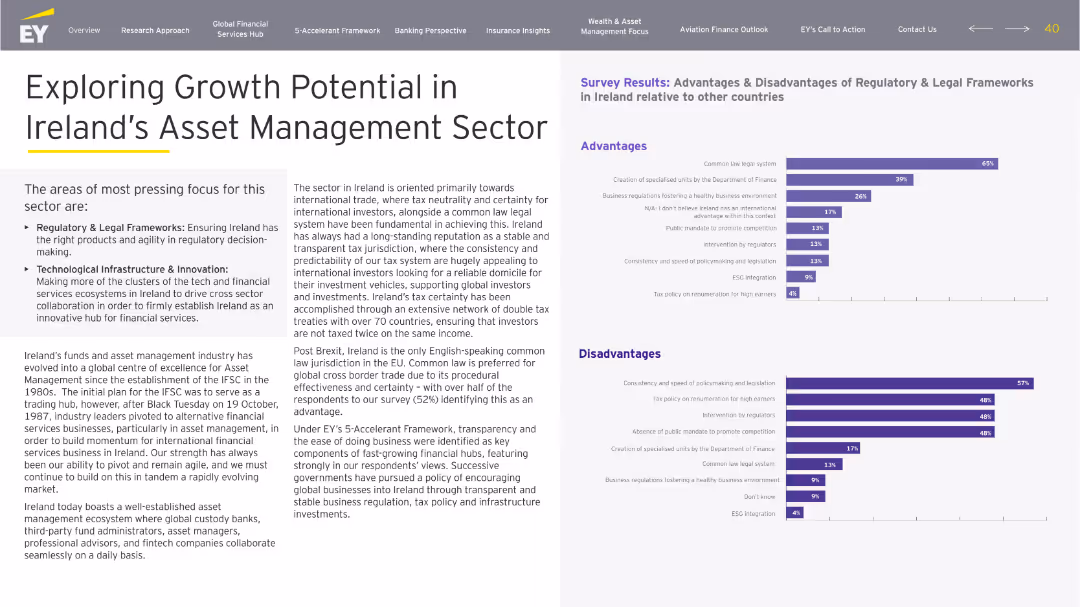
Structured layout with left-side sectioned narrative and right-side survey bar charts. Purple color scheme aligns with legal focus. Clearly segmented advantages/disadvantages.
Investment Analysis
Financial Services
Discusses growth prospects for Ireland's asset management sector, emphasizing regulatory clarity and tech innovation. Survey results show strong sentiment on legal stability and tax neutrality as advantages. Critiques focus on slow policy changes and lack of promotion.
asset management, growth, legal, tax neutrality, regulation, innovation
Multiple Chart
EY
Saved
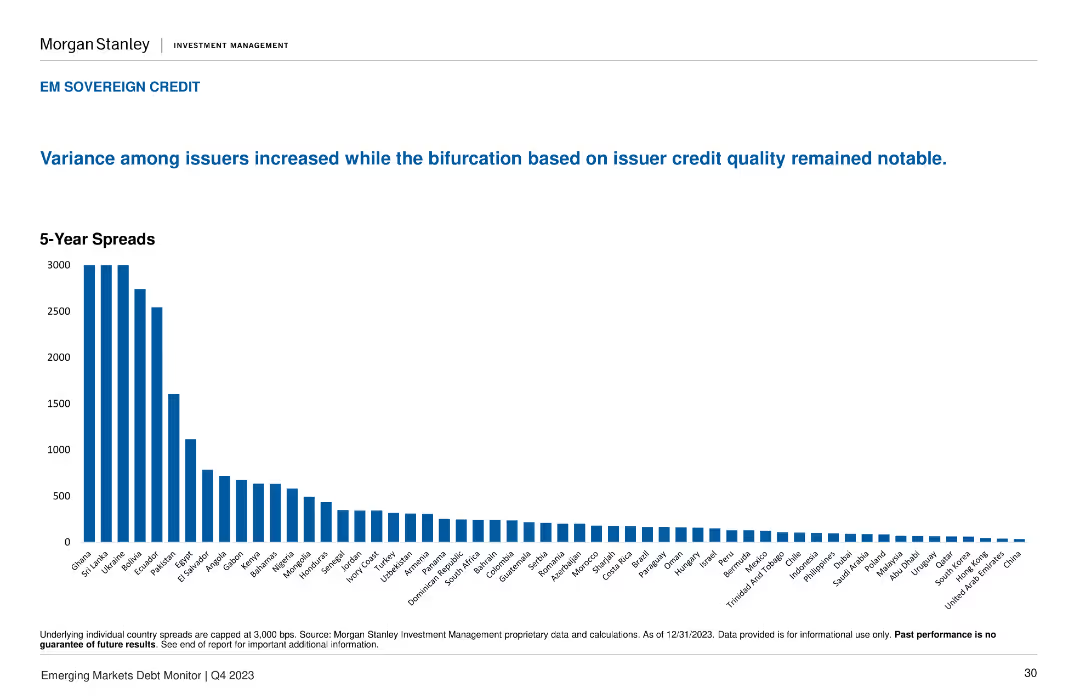
A column chart shows the 5-Year Spreads for various countries, highlighting significant variance among issuers.
Risk Assessment and Management
Financial Services
It discusses the increased variance among issuers and the bifurcation based on issuer credit quality. Important for assessing credit risk and issuer performance.
credit quality, spreads, issuers, variance, EM
Single Chart
Morgan Stanley
Saved
Lists modular offerings with a column chart showing market penetration.
Market Analysis and Trends
Financial Services
Highlights comprehensive digital solutions for small businesses, focusing on modular and personalized offerings.
small businesses, digital solutions, market penetration, modular offerings, efficiency
Mixed Chart
UBS
Saved
The slide presents a three-part framework for digital transformation in the luxury sector, covering data integration, organizational flexibility, and cutting-edge IT tools.
Technology and Digital Transformation
Consumer Goods
This slide outlines three essential capabilities luxury brands need for digital transformation: centralized data integration, organizational flexibility, and adoption of advanced IT tools.
digital transformation, luxury sector, data integration, organizational flexibility, IT tools
Pillar
BCG
Saved
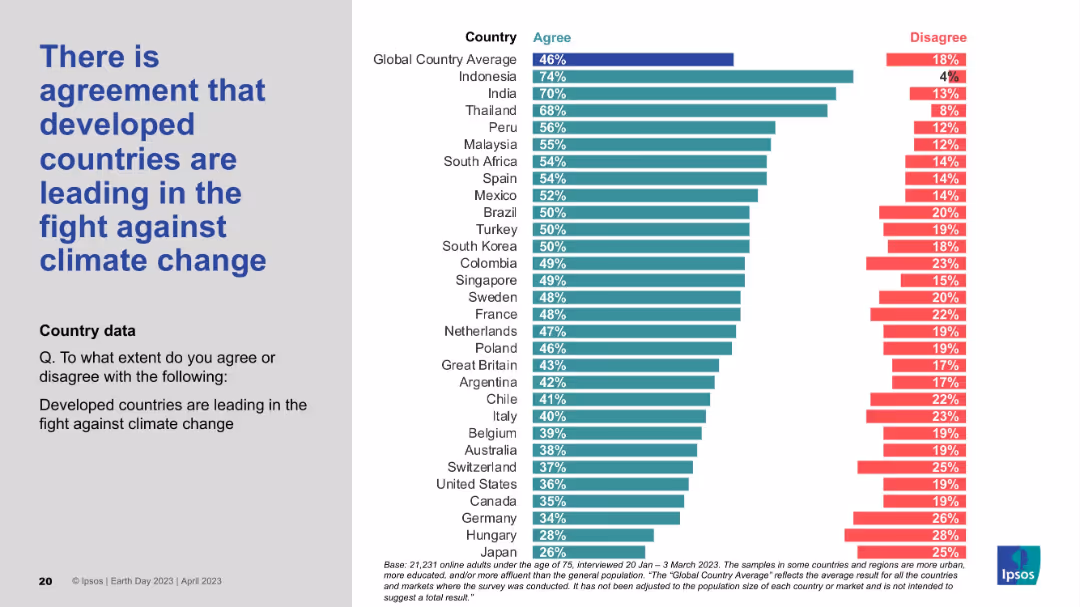
Similar format as previous: left-side large text and right-side horizontal bar chart showing country agreement/disagreement.
Market Analysis and Trends
Environmental Services & Sustainability
This slide explores public perception of whether developed countries are currently leading efforts in combating climate change. Results vary widely, with global agreement lower than on other climate topics, suggesting a more skeptical view of current leadership.
climate leadership, developed countries, perception, global view, public opinion, Ipsos, environmental action, Earth Day
Mixed Chart
IPSOS
Saved
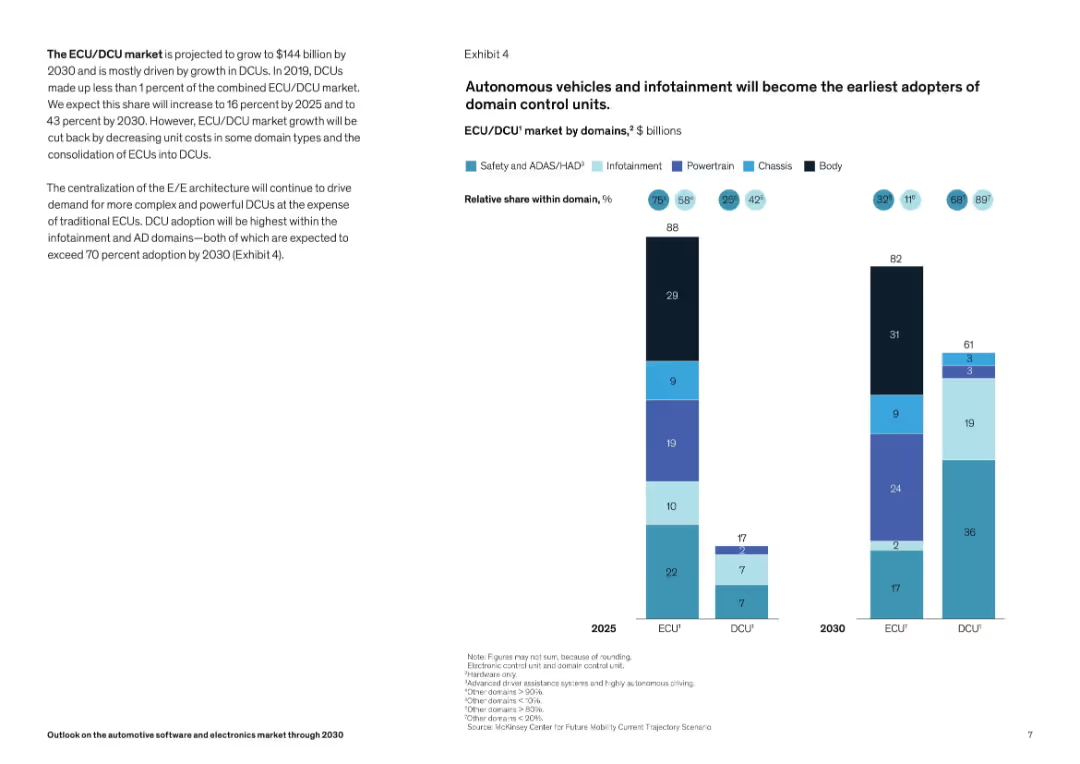
Two-column layout; left side has textual insights, right side features a stacked bar chart comparing ECU and DCU market values and domain shares for 2025 and 2030. Color-coded bars indicate different vehicle domains.
Market Analysis and Trends
Industrial & Manufacturing
This slide highlights the growth of the ECU/DCU market to $144B by 2030, driven by DCU adoption, especially in autonomous driving (AD) and infotainment. A bar chart shows domain-wise distribution and projected adoption trends for 2025 and 2030. Centralized E/E architecture is emphasized as a growth driver for DCUs.
ECU, DCU, ADAS, infotainment, autonomous driving, domain architecture, market growth, vehicle electronics, 2030 forecast, automotive
Mixed Chart
McKinsey
Saved
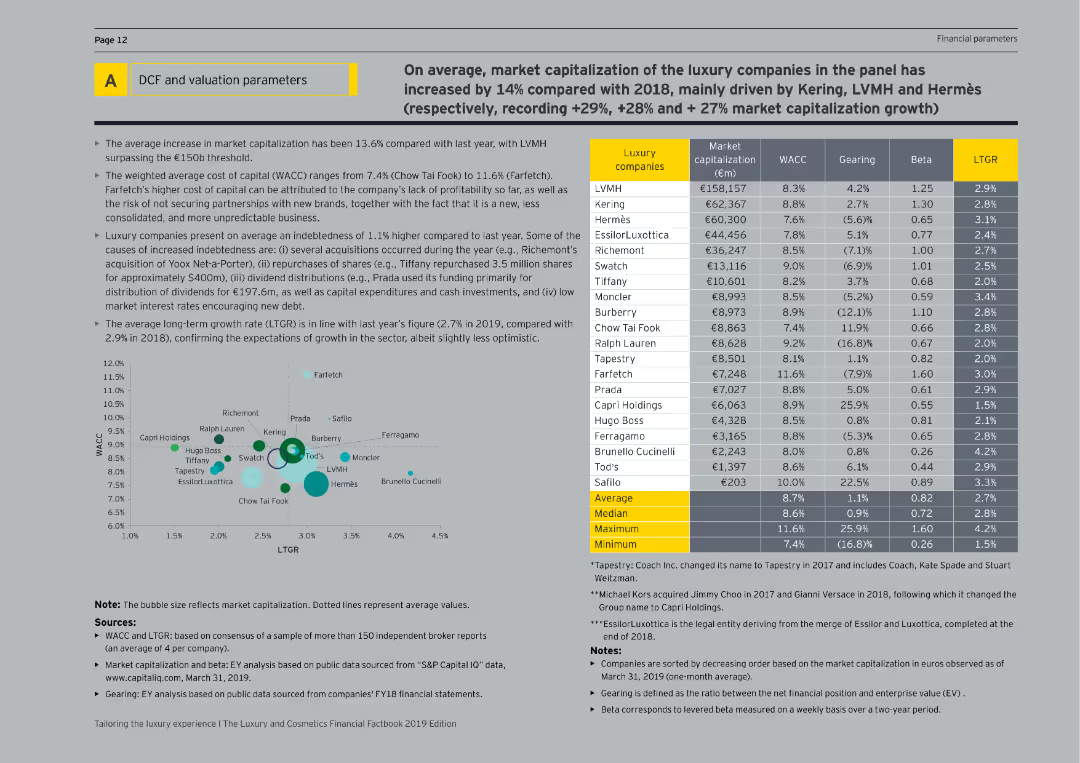
This slide features tables and bubble charts showing the market capitalization, WACC, gearing, beta, and LTGR of luxury companies.
Financial Performance
Consumer Goods
The slide presents detailed financial parameters of luxury companies, including market capitalization, cost of capital, and gearing ratios, with comparisons and growth expectations.
Valuation parameters, luxury companies, financial metrics, market capitalization, WACC
Mixed Chart
EY
Saved
Contains images and icons representing various strategic initiatives in Manhattan, including Citigold centers and digital tools. The arrangement allows for easy visualization of the scope and impact of the initiatives.
Strategic Planning
Financial Services
Highlights strategic efforts by Citi to enhance its retail banking services in Manhattan through the introduction of Citigold centers and digital tools, aiming to boost client engagement and service quality.
strategic planning, Citigold, Manhattan, Citi, retail banking, digital tools, client engagement, service quality
Header Vertical
Citigroup
Saved
Column chart showing the adoption of digital health solutions in wellness and prevention, initial consultation/diagnosis, and patient info & personal data.
Technology and Digital Transformation
Healthcare & Pharmaceuticals
This slide compares the adoption of digital health solutions in SEA, China, and India, focusing on wellness programs, consultations, and patient data.
Wellness programs, digital health, SEA, China, India, patient data
Multiple Chart
LEK
Saved
Complex flow chart that maps different pandemic phases like Flatten, Fight, and Future with economic implications, asking critical questions for each phase.
Strategic Planning
Financial Services
This slide serves to dissect the potential economic trajectories in response to pandemic phases, providing a strategic framework for assessing impacts.
pandemic response, economic impact, Flatten phase, Fight phase, Future phase, economic trajectories, strategic framework
Mixed Chart
BCG
Saved
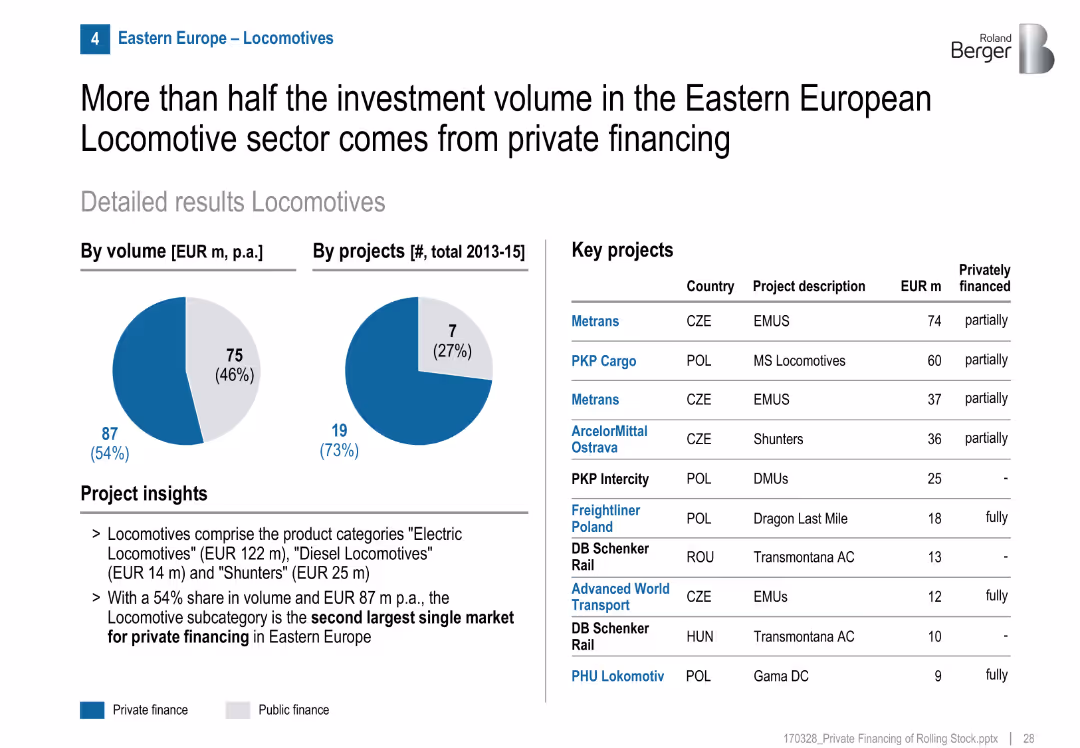
Pie charts show a 54% private finance share by volume, 27% by project count. Table with key projects and financing breakdown. Bullet-point insights on market subtypes.
Investment Analysis
Transportation & Logistics
Locomotives are the second-largest subcategory for private investment in Eastern Europe. Despite fewer private projects, they make up over half the investment volume.
locomotives, private finance, Eastern Europe, freight, investment, public-private mix, EMUs, shunters, MS locomotives
Mixed Chart
Roland Berger
Saved
The slide shows a balanced layout with text on the left and related hexagonal icons on the right. It details investment approaches like "Equity," "Debt," and "Tax Credit Equity," with impacts such as "Sustainable Transport" and "Communities."
Investment Analysis
Government & Public Sector
This slide is about Goldman Sachs' Urban Investment Group and its commitment to creating commercial opportunities within communities. It is useful for presentations related to urban development, community engagement, and investment impacts on education and sustainable transport.
urban investment, Goldman Sachs, community, sustainability, finance
Table
Goldman Sachs
Saved
Bar graphs showing the average number of categories purchased online with annotations for yearly changes.
Market Analysis and Trends
Retail & E-commerce
Maintains that despite a dip in purchase frequency, the average number of categories bought online remains steady, with Vietnam and Malaysia showing growth.
online sales, category consistency, Vietnam, Malaysia, purchase habits
Multiple Chart
Bain
Saved
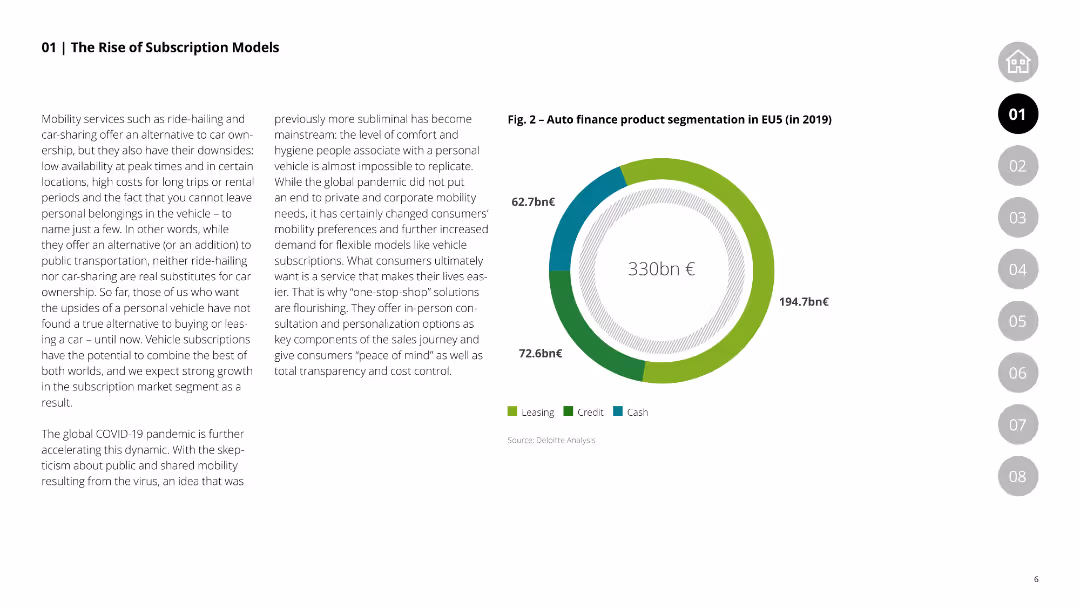
This slide includes a column chart showing product segmentation in the EU5 auto finance market for 2019, comparing leasing, credit, and cash products.
Market Analysis and Trends
Financial Services
Details the segmentation of auto finance products in the EU5 market, emphasizing the shift towards subscription models and how it caters to changing consumer preferences.
auto finance, product segmentation, EU5, leasing, credit, cash, subscription models
Mixed Chart
Deloitte
Saved
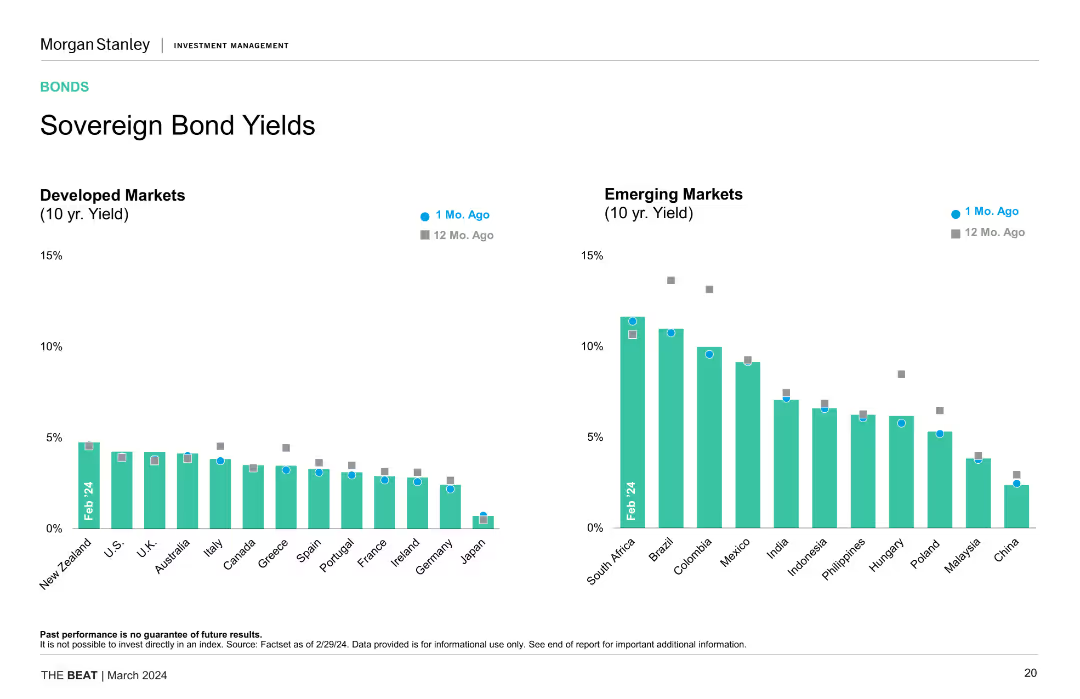
Two column charts comparing 10-year yields of developed and emerging markets over the past month and year, highlighting yield changes and comparisons.
Financial Performance
Financial Services
The slide provides a comparison of sovereign bond yields between developed and emerging markets, showing recent and year-on-year changes, useful for yield analysis and investment decisions.
Sovereign Bonds, Yields, Developed Markets, Emerging Markets, Investment Analysis, Trends
Multiple Chart
Morgan Stanley
Saved
Slide features multiple charts: a pie chart showing consumer opinions on vehicle ownership, and bar charts reflecting agreement levels on transportation convenience.
Market Analysis and Trends
Transportation & Logistics
The slide presents consumer opinions on vehicle ownership due to shared transportation use, and their views on the convenience of changing transportation modes.
Transportation, consumer opinions, vehicle ownership, convenience, shared transportation
Multiple Chart
Deloitte
Saved
A stacked column chart shows historical and projected emissions for selected countries, segmented by technological interventions like renewable electricity, efficiency improvements, and carbon capture. Each segment's potential impact on emissions is visually differentiated.
Regulatory and Compliance
Environmental Services & Sustainability
Outlines the technological solutions available for reducing emissions in key countries, emphasizing the role of innovation and technology in meeting climate goals. Useful for discussions on integrating new technologies in national policies and strategies to reduce greenhouse gas emissions.
Emissions, Technology, Renewable energy, Carbon capture, 2050
Single Chart
BCG
Saved
Features diagrams and a pie chart comparing the role of the physical wholesale channel in the luxury market from 2019 to 2025F.
Market Analysis and Trends
Retail & E-commerce
Analyzes trends affecting the wholesale distribution of luxury goods, noting a significant contraction and shift towards increased control by brands.
wholesale, luxury, market, 2025, trends
Mixed Chart
Bain
Saved
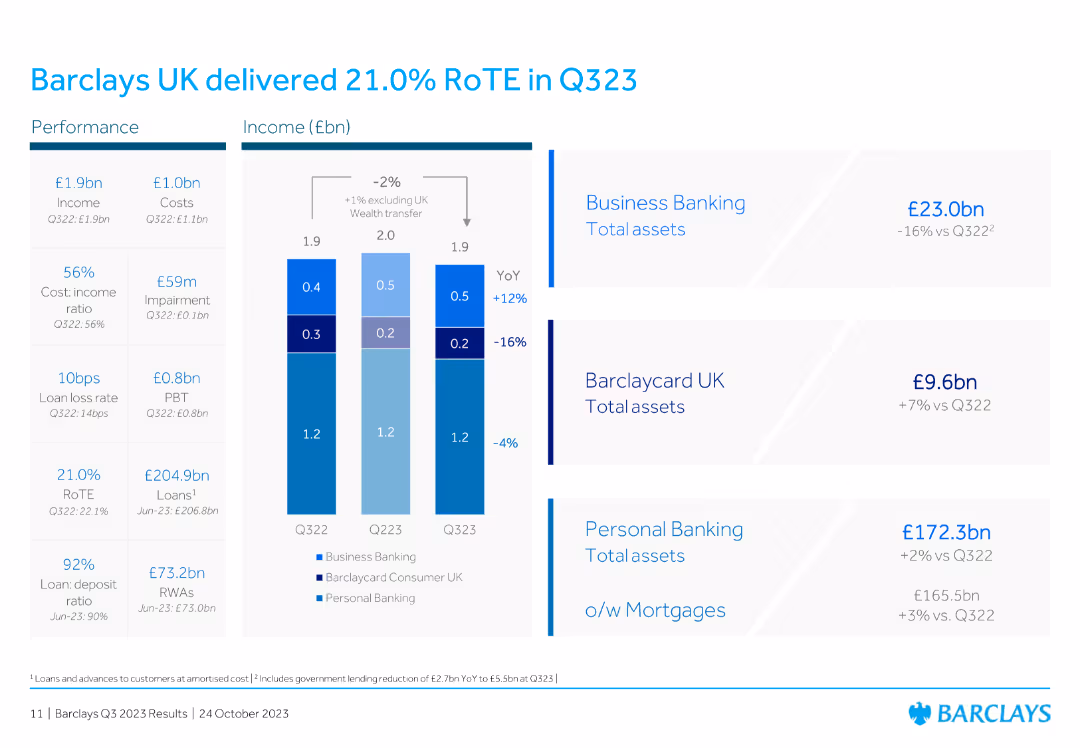
The slide features a column chart showing income (£bn) and financial performance metrics for Barclays UK from Q322 to Q323. It includes performance indicators for business banking, Barclaycard UK, and personal banking.
Financial Performance
Financial Services
The slide highlights Barclays UK's financial performance for Q323, reporting a RoTE of 21.0%. It includes metrics for income, costs, impairment, and performance indicators for business banking, Barclaycard UK, and personal banking.
RoTE, Q323, Barclays UK, performance, metrics
Mixed Chart
Barclays
Saved
The final slide features bold text with graphic icons in a minimalistic style, delivering a clear and motivational message.
Strategic Planning
Financial Services
A conclusive slide with a motivational statement, often used as a call to action in marketing or closing presentations.
motivation, forward, progress, action
Title
JP Morgan
Saved
Previous
Next
If nothing, comes up, please save your slides first
Create a FREE account to continue browsing
Receive Instant Access to 1,000+ slides from companies like McKinsey, Google, and Goldman Sachs
First Name
Last Name
Email
Password
I agree to all
Terms & Privacy Policy
Thank you! Your submission has been received!
Oops! Something went wrong while submitting the form.
Have an account?
Sign in
Column Chart
Heatmap
Chevron
Org Chart
Infographic
Callouts
Timeline
List
Graphic
Picture
Process Flow
Diagram
Paragraph
Map
Table
Framework
Subtitle
Takeaway Box
Icon
Other Chart
Radar Chart
Waterfall Chart
Mekko Chart
Pie Chart
Scatter Plot
Line Chart
Bar chart
Bullet points