My Account
My Slides
Search by Category
Templates
View All Templates
Download Template Slides
✦ AI Search
Feedback
Login
Logout
Get Started
Browse all Slides
Browse all Slides
Create a FREE Account
Instant access to 1,000+ real slides from top companies like McKinsey, BCG, Goldman Sachs, Google and many more!
First Name
Last Name
Email
Password
I agree to all
Terms & Privacy Policy
Thank you! Your submission has been received!
Oops! Something went wrong while submitting the form.
Have an account?
Sign in
Saved Slides
The slide includes text blocks, a supporting image, and a bar chart. The visual complexity is moderate, with an emphasis on readability and structured information presentation.
Risk Assessment and Management
Environmental Services & Sustainability
This slide discusses the impact of climate change on business operations, including risks to cost profiles, supply chains, and physical assets, supported by survey data.
Climate Change, Impact, Risk, Business, Survey
Mixed Chart
PwC/Strategy&
Saved
The slide features a flow diagram illustrating the concrete manufacturing process from raw materials to the finished product. Each stage is accompanied by relevant images and descriptive text, with a clear visual hierarchy.
Industry Overview
Industrial & Manufacturing
Describes the process of cement production, highlighting the stages from limestone and clay to concrete. Explains the importance of clinker and the industry's move towards more sustainable practices.
Cement, clinker, concrete, manufacturing, sustainability
Linear Flow
LEK
Saved
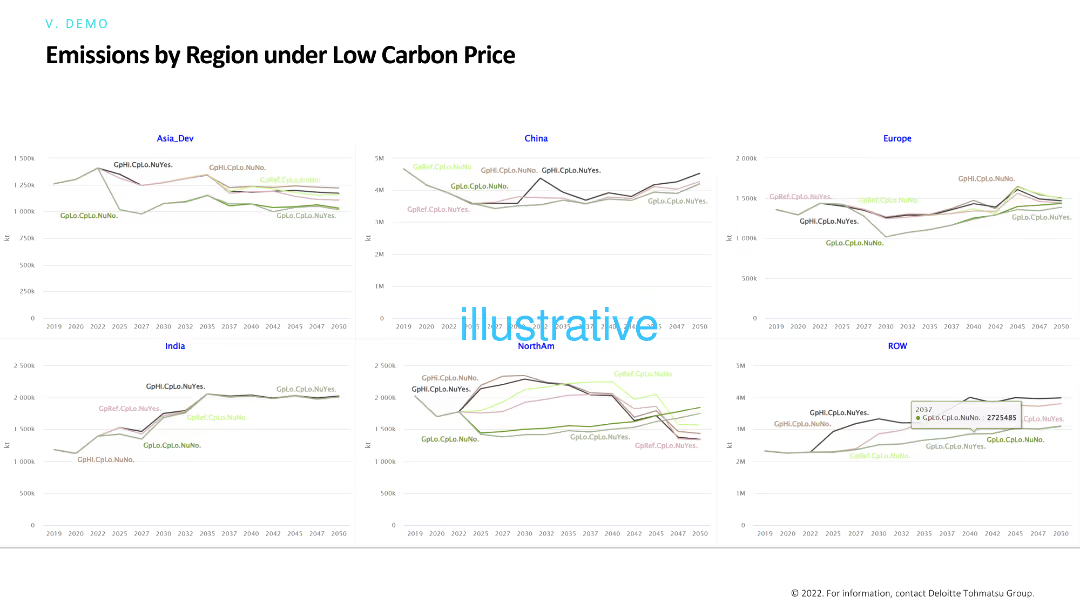
This slide features line charts comparing emissions by region under low carbon price scenarios. It highlights differences in emissions trends across regions and how low carbon pricing affects these trends over time.
Risk Assessment and Management
Environmental Services & Sustainability
The slide examines the effects of low carbon pricing on regional emissions, providing insights into how minimal carbon costs influence environmental outcomes and policy effectiveness in various regions.
Low carbon price, emissions, regions, policy impact, carbon pricing
Multiple Chart
Deloitte
Saved
The slide contains horizontal bar charts in a yellow background. It discusses challenges in food value chain partnerships.
Strategic Planning
Agriculture & Food Production
Highlights top challenges in establishing partnerships within the food value chain ecosystem, including network access and data sharing. Useful for strategic planning in sustainability and agriculture.
Challenges, Partnerships, Food Value Chain, Strategic Planning, Ecosystem
Mixed Chart
Deloitte
Saved
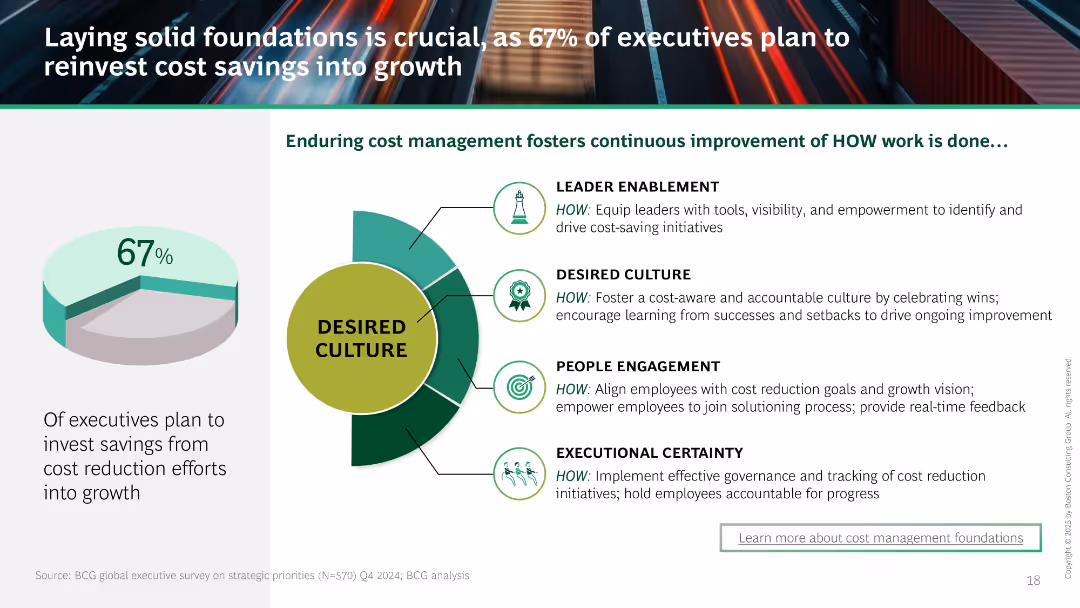
Central image of a circular “Desired Culture” model with four action areas. Left shows pie chart (67% reinvestment). Structured to show how continuous improvement enables reinvestment.
Strategic Planning
Professional Services
Describes how cost savings can be reinvested if companies cultivate a culture focused on leader enablement, accountability, and employee engagement. Positions cultural foundations as key to sustaining cost management.
cost savings, culture, reinvestment, leadership, employee engagement, continuous improvement, governance
Mixed Chart
BCG
Saved
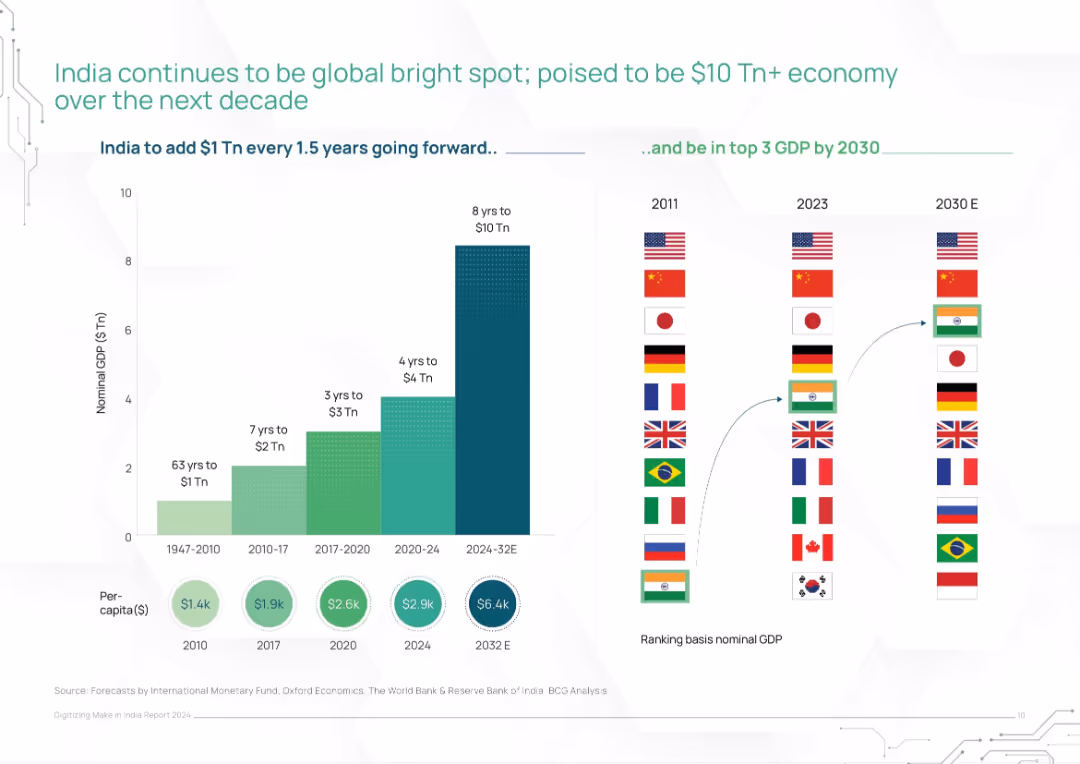
Dual-panel layout: left stacked bar of GDP timeline, right rank shifts of countries by GDP (2011–2030E)
Market Analysis and Trends
Financial Services
This slide charts India's rapid GDP growth trajectory and its expected rise to the top 3 global economies by 2030. It visually compares historical and projected GDP levels, showing acceleration from $1T in 63 years to an expected $10T in 8 years. Includes global ranking comparisons.
India GDP, economic growth, global ranking, nominal GDP, IMF forecast, growth projection, $10 trillion economy
Mixed Chart
BCG
Saved
The slide shows a timeline with achievements for Q3 2023, key priorities for Q4 2023, and milestones for 2024.
Strategic Planning
Financial Services
This slide details the integration planning and execution process, highlighting achievements and future milestones.
integration planning, execution, key priorities, milestones, strategic plan
Header Horizontal
UBS
Saved
Slide with title, two comparative column charts on revenues and rankings for different financial services, showing growth over time with arrows and brief text descriptions.
Financial Performance
Financial Services
Summarizes the growth and improvement in rankings of the firm's debt underwriting and asset & wealth management, showcasing its track record in building successful businesses.
Business Growth, Debt Underwriting, Wealth Management, Rankings
Multiple Chart
Goldman Sachs
Saved
Contains a gradient bar chart showing vaccine candidates in various development phases with a specific focus on Phase III.
Regulatory and Compliance
Healthcare & Pharmaceuticals
Highlights leading COVID-19 vaccine candidates, their current trial phases, and projected timelines for emergency use authorizations.
vaccine, COVID-19, trials, phases, candidates
Mixed Chart
BCG
Saved
The slide shows a structured layout with a combination of text boxes detailing the key components and impacts of the TEF Entrepreneurship Programme.
Client Case Studies
Professional Services
Discusses the achievements of the Tony Elumelu Foundation's entrepreneurship programme, including its impact on job creation and business development in Africa.
entrepreneurship, Tony Elumelu Foundation, business development, Africa, impact assessment
Diagram
Accenture
Saved
Features column charts detailing newspaper and magazine revenue trends globally and in India from 2020 to 2025.
Market Analysis and Trends
Media & Entertainment
Analyzes declining global trends in newspaper and magazine revenues with a contrasting slight growth in India.
newspaper, magazines, revenue decline, India growth, global trend, 2025 forecast, media industry
Multiple Chart
PwC/Strategy&
Saved
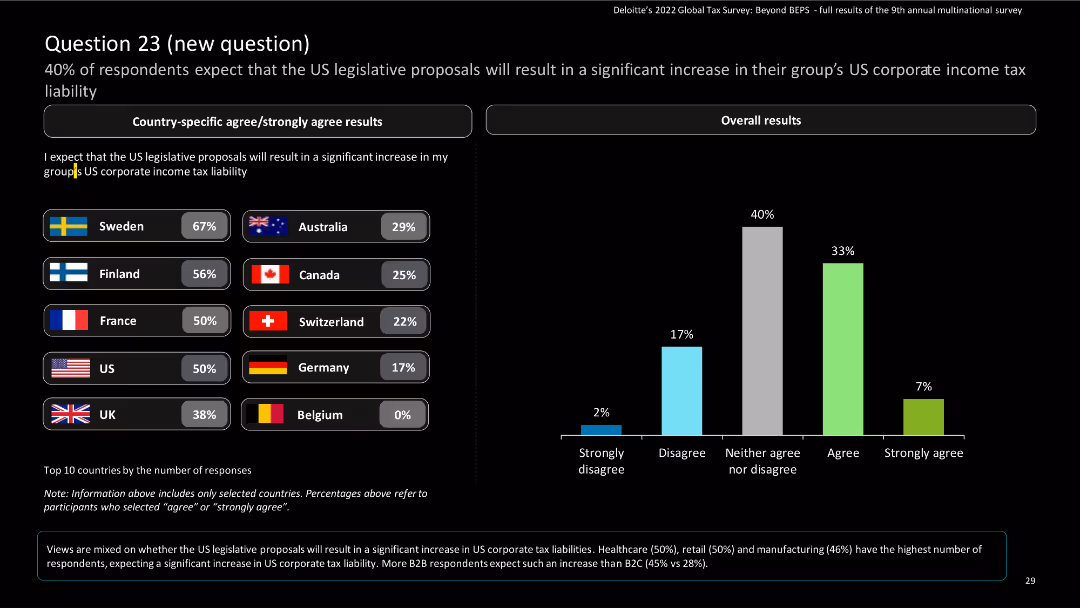
Slide contains a combination of bar charts and column charts to illustrate country-specific and overall results on US corporate tax liability expectations.
Market Analysis and Trends
Financial Services
This slide shows the percentage of respondents expecting significant increases in US corporate income tax liability due to legislative proposals, broken down by country.
survey, column chart, tax liability, countries
Mixed Chart
Deloitte
Saved
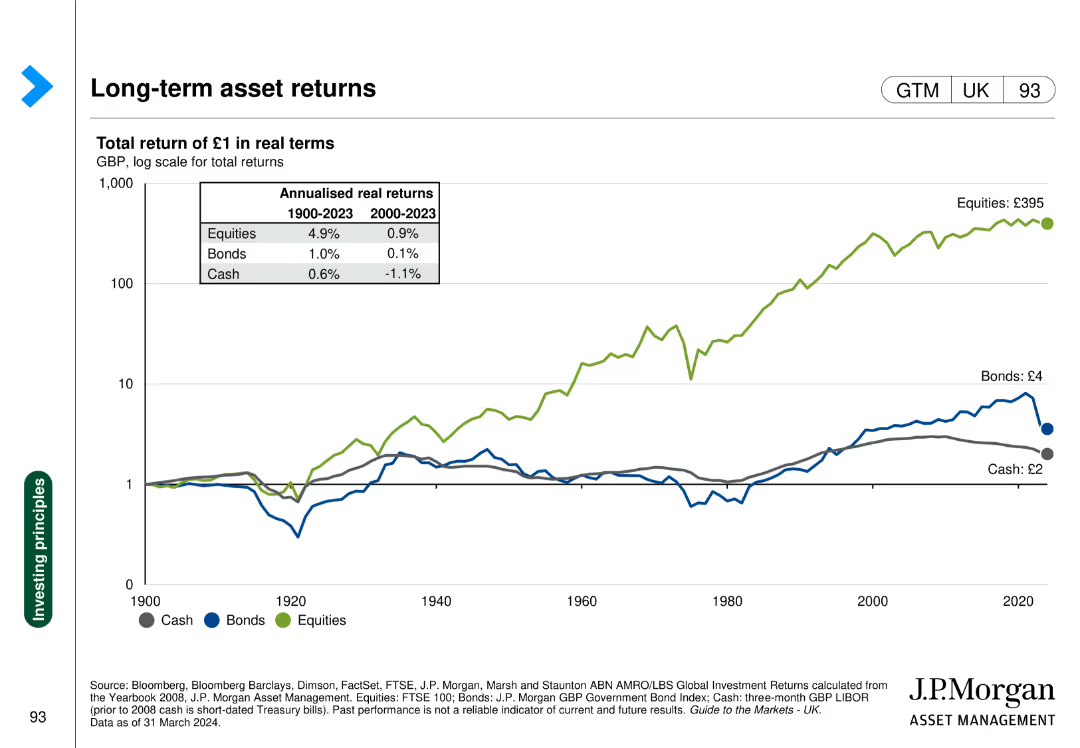
Line chart showing the real returns of cash, bonds, and equities over time.
Investment Analysis
Financial Services
Presents the historical real returns of different asset classes, aiding in long-term investment decisions.
Long-term returns, asset classes, real returns, cash, bonds, equities
Single Chart
JP Morgan
Saved
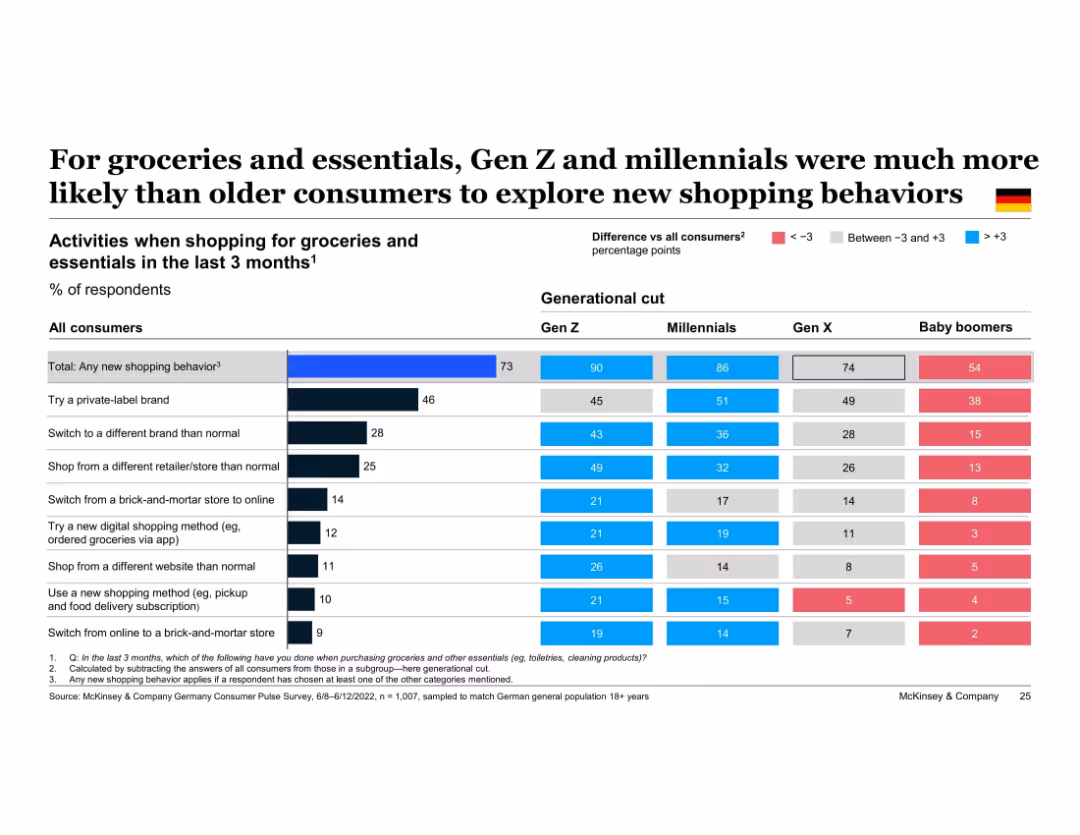
Table comparing generational behavior (Gen Z to Boomers) in a side-by-side percentage chart, with differences highlighted using red, gray, and blue color coding
Customer and Market Segmentation
Retail & E-commerce
This slide compares generational differences in shopping behavior. Gen Z and millennials are significantly more likely than Gen X and baby boomers to try new behaviors like switching brands or trying private-label products. Each row compares one behavior across generations against the overall average.
generational trends, Gen Z, Millennials, shopping behavior, brand switching, private label, consumer segmentation, retail innovation
Multiple Chart
McKinsey
Saved
Column chart showing the market value of crypto investment funds held, with categories ranging from less than $1,000 to over $1,000,000.
Market Analysis and Trends
Financial Services
Shows the market value distribution of crypto investment funds held by owners, highlighting the various ranges of investment amounts.
investment funds, crypto market, value distribution, financial analysis, investment trends
Single Chart
IPSOS
Saved
A pie chart with segments in different shades of red and orange representing different positions within firms, like CEOs and HR managers, indicating the distribution of respondents by position.
Market Analysis and Trends
Professional Services
Provides insights into the distribution of different executive and managerial positions within firms, useful for understanding organizational structures and decision-making hierarchies.
positions, firms, executives, managers, organizational structure
Single Chart
PwC/Strategy&
Saved
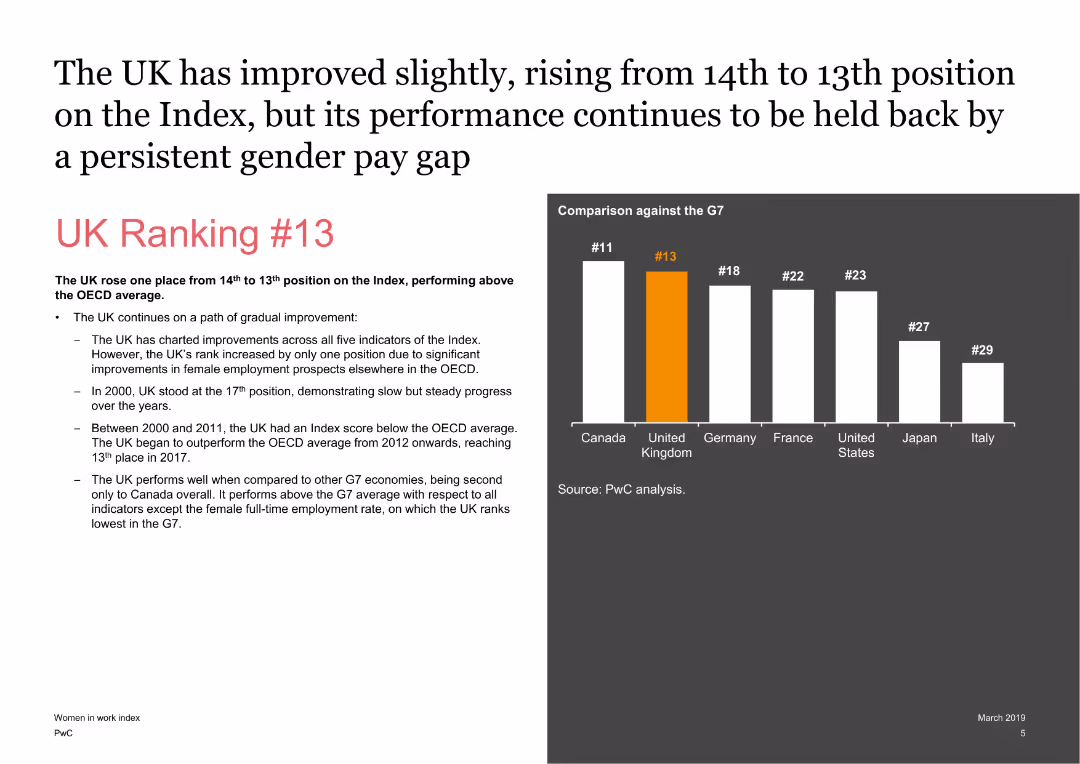
The slide features a mix of text and a column chart comparing the UK’s ranking with other G7 countries. The text highlights key points about the UK's position in the index and its performance over time.
Market Analysis and Trends
Financial Services
It discusses the UK’s improvement in the ranking on the Women in Work Index, highlighting the UK's performance compared to other G7 countries and factors influencing its ranking.
UK, Ranking, G7, Performance, Index, Analysis
Mixed Chart
PwC/Strategy&
Saved
The slide features a diagram and detailed table presenting the total potential of animal waste feedstock for energy production by 2060, including theoretical, technical, and sustainable potentials, and various factors affecting its scalability and sustainability constraints.
Technology and Digital Transformation
Energy & Utilities
This slide provides a deep-dive into the potential of animal waste as a feedstock for energy production, analyzing its total potential by 2060 and highlighting the scalability issues and sustainability constraints associated with its use.
animal waste, feedstock, total potential, energy production, 2060, scalability, sustainability constraints
Mixed Chart
Kearney
Saved
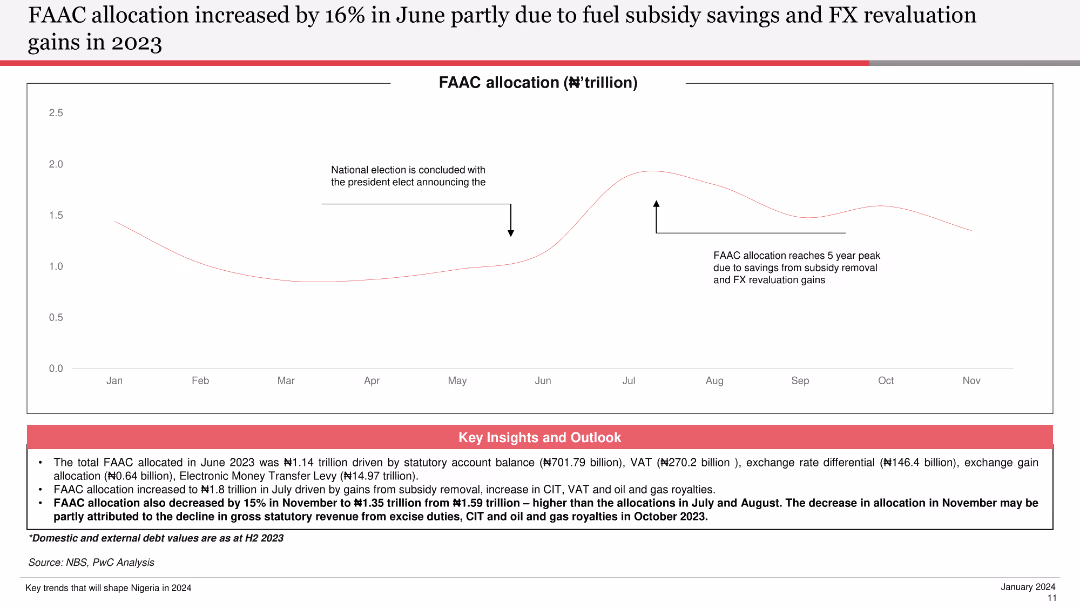
The slide features a line chart showing FAAC allocation trends over the months, with annotations for key events. It is moderately complex, focusing on visual data storytelling.
Financial Performance
Government & Public Sector
This slide provides an overview of the FAAC allocation trends, highlighting the impact of subsidy savings and FX revaluation gains, with key insights into the fiscal outlook.
FAAC, Allocation, Trends, Subsidy, FX
Mixed Chart
PwC/Strategy&
Saved
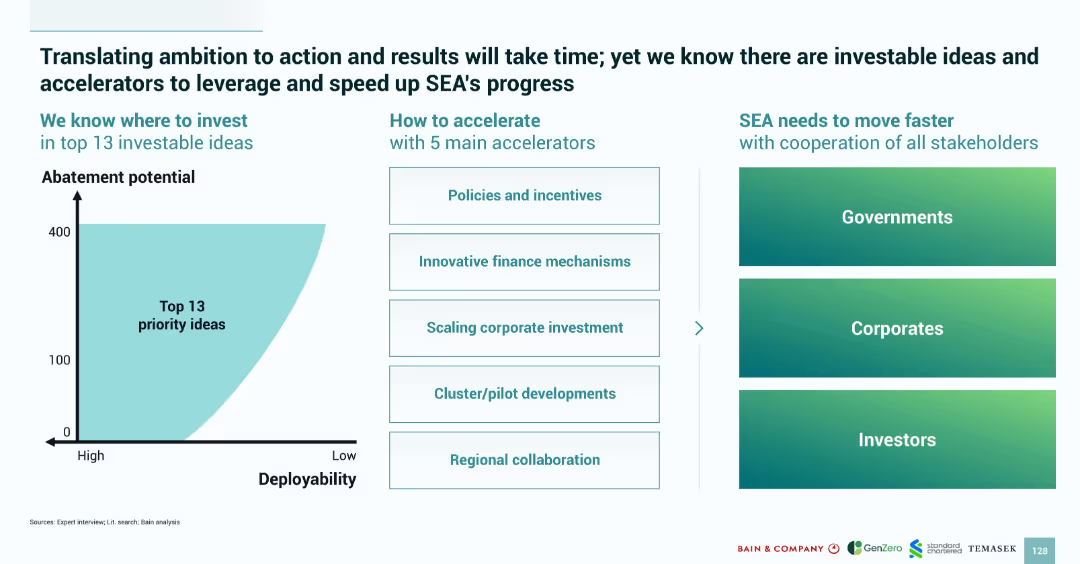
Dual chart layout with a deployability vs abatement potential curve and list of 5 accelerators; includes stakeholder roles
Strategic Planning
Environmental Services & Sustainability
Introduces 13 high-impact climate investment ideas and 5 acceleration levers (e.g., finance, policy, regional action), calling for coordinated effort from governments, corporates, and investors
climate action, investment ideas, policy, finance, collaboration, deployability, abatement, accelerators
Mixed Chart
Bain
Saved
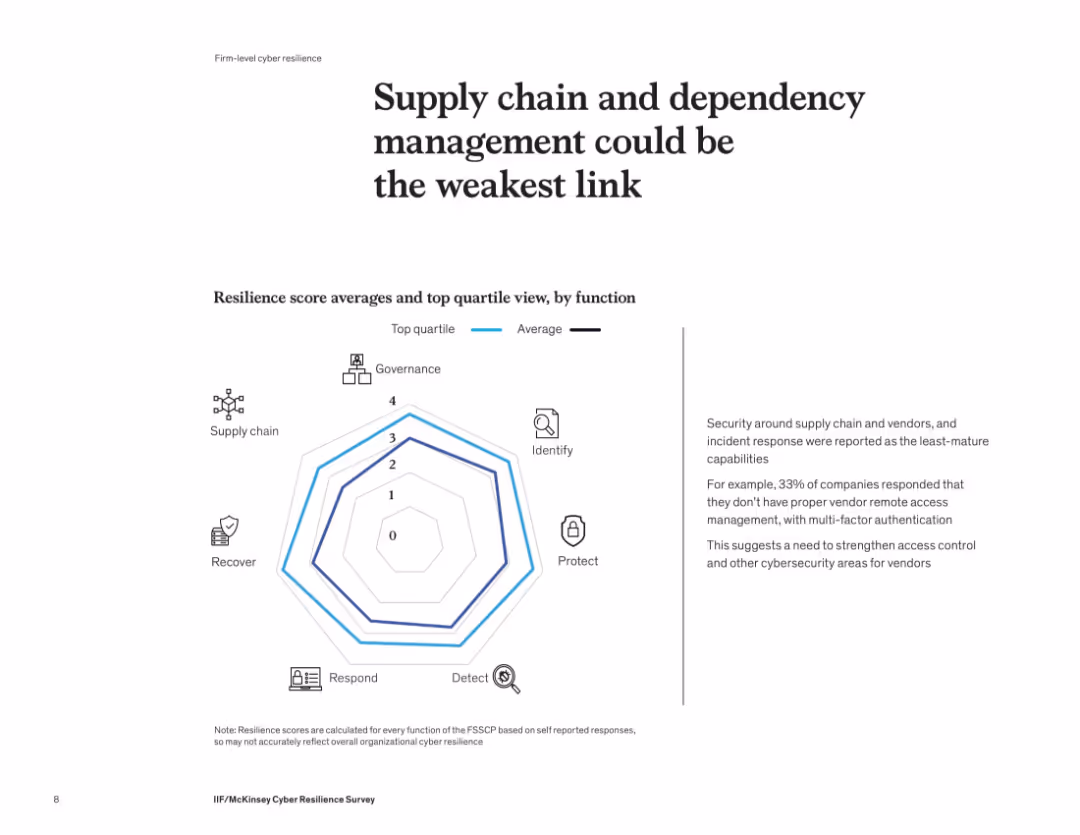
Radar/spider chart compares average vs. top quartile resilience scores across cybersecurity functions. Text box on the right provides insights into vendor access weaknesses.
Risk Assessment and Management
Financial Services
The slide highlights supply chain and dependency management as the least mature cybersecurity function. Companies report weak vendor access control and limited use of multi-factor authentication. Incident response also shows gaps, suggesting a need for strengthened controls and vendor oversight.
cybersecurity, supply chain, dependency management, weak link, vendor control, risk management, radar chart
Mixed Chart
McKinsey
Saved
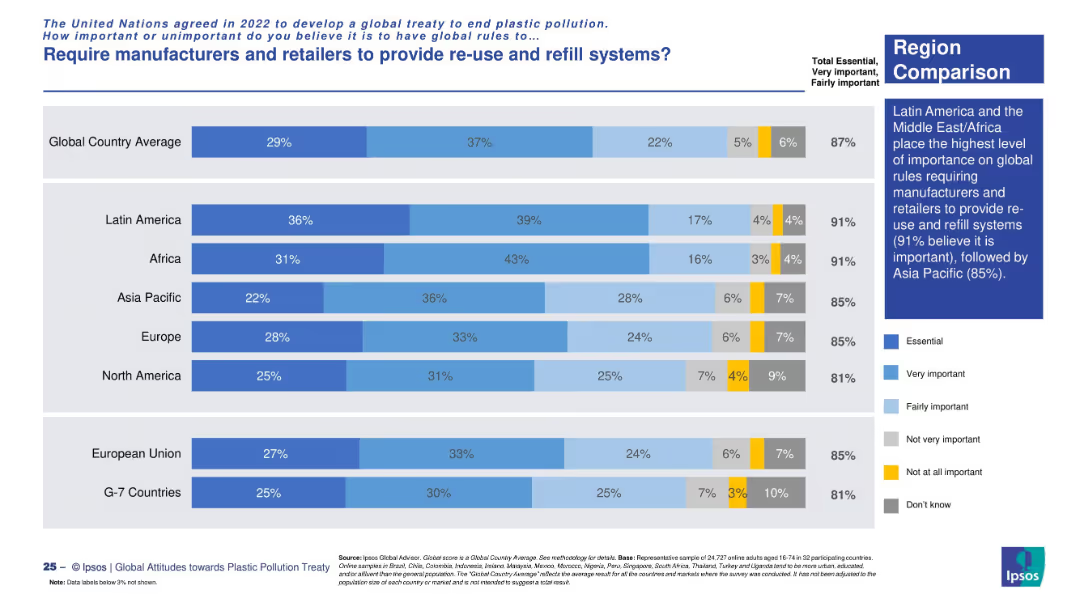
Horizontal bar chart with segmented bars showing survey results across regions. Blue color gradients indicate importance levels. Includes a sidebar summary with key regional comparison insight.
Market Analysis and Trends
Environmental Services & Sustainability
This slide presents a regional comparison of public opinion on the importance of global rules requiring reuse and refill systems by manufacturers and retailers. Latin America and Africa show the highest support (91%). It visualizes the extent to which people view such measures as essential, very important, or fairly important.
plastic reuse, refill systems, public opinion, global treaty, sustainability, regional comparison, Ipsos survey, environmental policy, Latin America, Africa
Mixed Chart
IPSOS
Saved
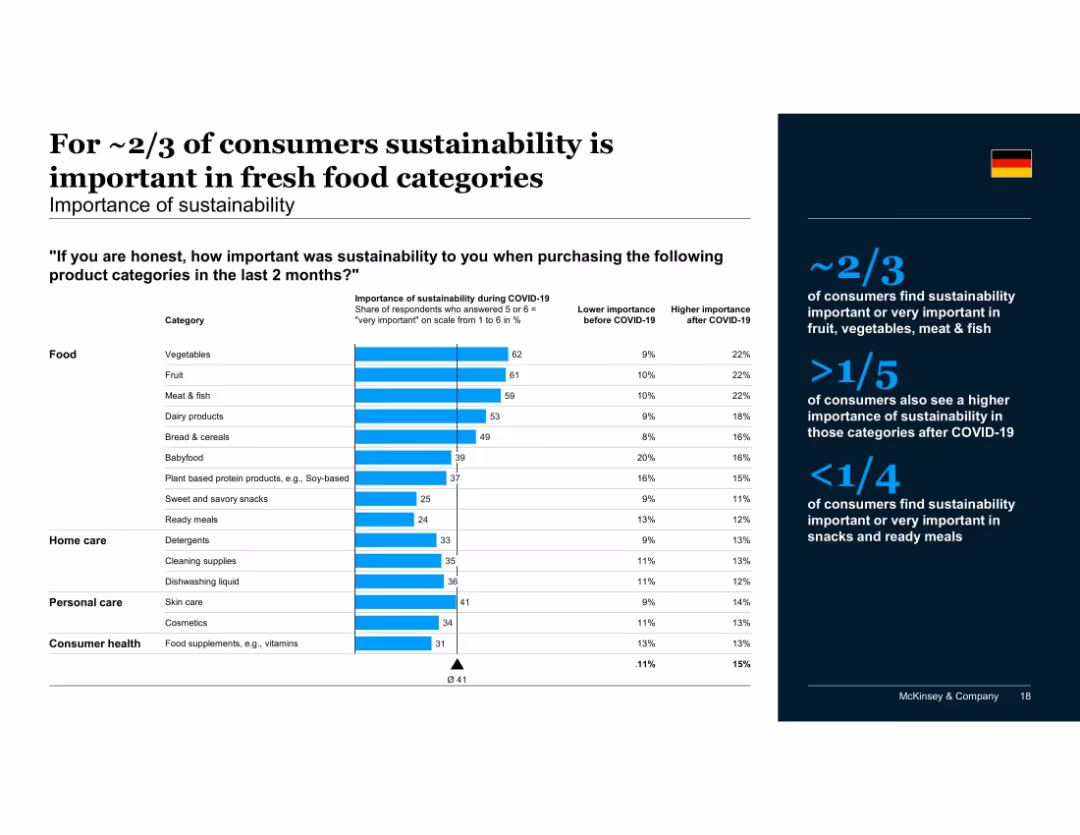
Left section displays a vertical bar chart showing importance of sustainability across product categories, with change before and after COVID-19; right side summarizes insights with text on a dark background and a German flag.
Market Analysis and Trends
Retail & E-commerce
The slide shows that about two-thirds of consumers consider sustainability important in fresh food purchases, especially vegetables, fruits, and meat/fish. It also emphasizes the increased importance of sustainability in certain food categories following COVID-19.
sustainability, food, COVID-19, consumer sentiment, product importance, fresh produce, purchase behavior, grocery categories, market trends
Mixed Chart
McKinsey
Saved
Two U.S. maps comparing branch network coverage in 2017 vs 2021, with additional statistics on coverage expansion.
Strategic Planning
Financial Services
Emphasizes strategic planning in branch distribution to serve more communities effectively rather than maximizing the number of branches.
Strategic Planning, Branch Network, Community Service, Coverage Expansion, Customer Needs, Financial Goals
Text Only
JP Morgan
Saved
Contains multiple infographics and text blocks detailing the components of Barclays' payment systems, including partnerships and technological capabilities.
Operational Efficiency
Financial Services
This slide explains the structure of Barclays' payments ecosystem, emphasizing its market leadership and partnerships in SME and large corporate sectors, detailing services like card issuing and merchant acquiring.
payments, ecosystem, SME, corporate, partnerships
Table
Barclays
Saved
Previous
Next
If nothing, comes up, please save your slides first
Create a FREE account to continue browsing
Receive Instant Access to 1,000+ slides from companies like McKinsey, Google, and Goldman Sachs
First Name
Last Name
Email
Password
I agree to all
Terms & Privacy Policy
Thank you! Your submission has been received!
Oops! Something went wrong while submitting the form.
Have an account?
Sign in
Column Chart
Heatmap
Chevron
Org Chart
Infographic
Callouts
Timeline
List
Graphic
Picture
Process Flow
Diagram
Paragraph
Map
Table
Framework
Subtitle
Takeaway Box
Icon
Other Chart
Radar Chart
Waterfall Chart
Mekko Chart
Pie Chart
Scatter Plot
Line Chart
Bar chart
Bullet points