My Account
My Slides
Search by Category
Templates
View All Templates
Download Template Slides
✦ AI Search
Feedback
Login
Logout
Get Started
Browse all Slides
Browse all Slides
Create a FREE Account
Instant access to 1,000+ real slides from top companies like McKinsey, BCG, Goldman Sachs, Google and many more!
First Name
Last Name
Email
Password
I agree to all
Terms & Privacy Policy
Thank you! Your submission has been received!
Oops! Something went wrong while submitting the form.
Have an account?
Sign in
Saved Slides
This slide compares the percentage of respondents engaging in online activities before and after COVID-19 with bar graphs and a textual summary.
Market Analysis and Trends
Technology & Software
It shows how the pandemic increased online engagement and awareness, crucial for understanding consumer behavior changes and market opportunities.
COVID-19, digital adoption, online activities, market analysis, consumer behavior, awareness, engagement, pandemic
Multiple Chart
Kearney
Saved
A clear and structured table lists various business groups with corresponding Basel III Capital and ROE data. It's flanked by bar charts illustrating these metrics, providing a comparative and temporal visual analysis.
Regulatory and Compliance
Financial Services
Aimed at conveying Macquarie's capital adequacy and return on equity under Basel III regulations, the slide targets financial analysts and regulatory stakeholders interested in compliance and financial health metrics.
Basel III, capital, ROE, compliance, financial, regulatory, adequacy, analysis, business, metrics
Table
Goldman Sachs
Saved
A slide that incorporates various icons and bullet points detailing technological trends such as AI, AR/VR, NFTs, and cryptocurrency, with case examples and potential applications.
Technology and Digital Transformation
Retail & E-commerce
Outlines the influence of AI, AR/VR, NFTs, and cryptocurrencies on sales and marketing, and the opportunities for hyperpersonalization and enhanced customer experiences.
Artificial Intelligence, AR, VR, Metaverse, NFTs, Cryptocurrency, Hyperpersonalization, Automation, Customer Engagement, Technological Trends
Graphic
BCG
Saved
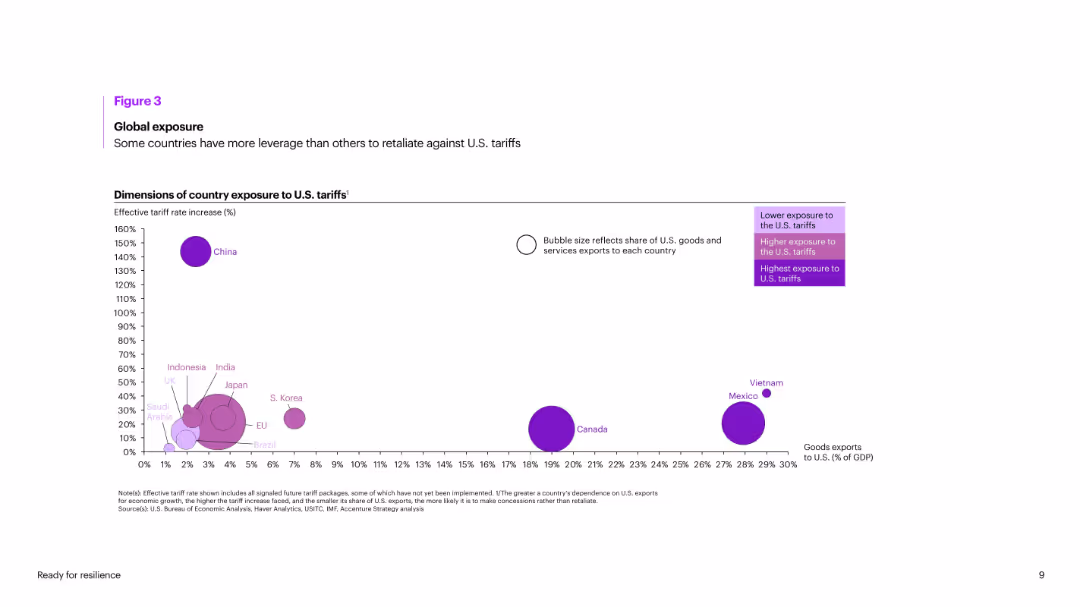
Bubble chart showing countries’ exposure to U.S. tariffs based on increase % and goods export share to the U.S. Bubble size reflects trade dependence.
Risk Assessment and Management
Government & Public Sector
Visualizes tariff impact using effective rate increases and share of exports to the U.S. China, Vietnam, and Mexico are the most exposed. Canada has high dependence but moderate rate impact. EU, Japan, and India show varying degrees of vulnerability.
tariffs, exposure, exports, U.S. trade, vulnerability, retaliation, global impact, China, Vietnam, GDP
Single Chart
Accenture
Saved
Comparative charts detailing monthly sales changes for passenger vehicles in multiple countries, using color-coded bars.
Market Analysis and Trends
Transportation & Logistics
Reviews the recovery in passenger vehicle sales post-pandemic, useful for market analysis and predicting future consumer behavior in the auto industry.
auto sales, market recovery, pandemic impact, consumer behavior, sales analysis
Multiple Chart
BCG
Saved
The slide is divided into four sections, each with an icon and text describing different strategies regarding talent resignation, from understanding drivers to handling exits.
Human Resources and Talent Management
Professional Services
The slide outlines a comprehensive strategy for managing talent resignation, emphasizing a preventative approach and the importance of a retention strategy for high-performing individuals. It is likely used in HR training or strategy meetings.
Retention Strategy, Talent Resignation, HR Management, Prevention
Header Horizontal
Kearney
Saved
The slide has a column chart with multiple stages indicated for different financial factors affecting RoCET1, alongside key levers for achieving the target.
Financial Performance
Financial Services
This slide outlines the steps and key financial levers required to achieve a 15% return on common equity tier 1 capital by 2026, detailing cost efficiencies and optimizations.
RoCET1, financial levers, cost efficiencies, optimization
Mixed Chart
UBS
Saved
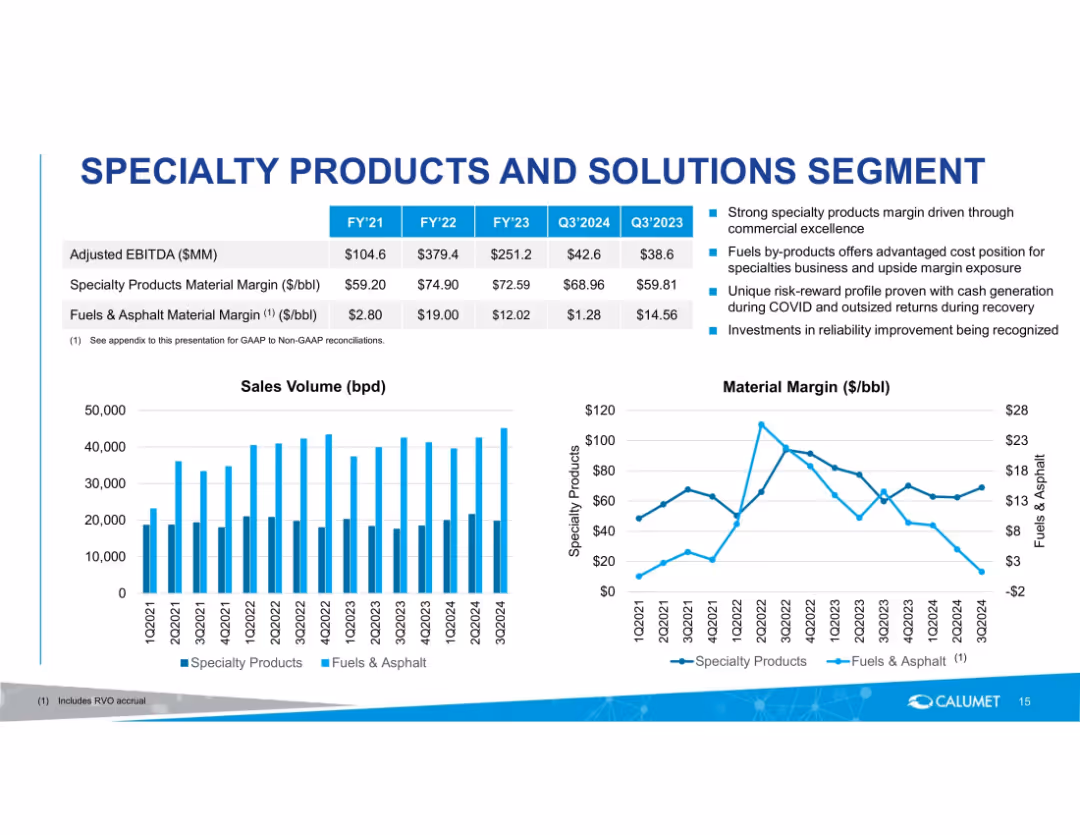
Two-panel slide with data tables, bullet points, and dual graphs (bar and line chart) on white background with blue accents.
Financial Performance
Energy & Utilities
Compares specialty and fuels & asphalt material margins across fiscal years and quarters. Highlights key performance drivers like commercial excellence, risk profiles, and investment impacts, with supporting sales and margin data.
EBITDA, material margin, sales volume, specialty products, fuels, asphalt, quarterly data, margin comparison, performance drivers
Multiple Chart
Goldman Sachs
Saved
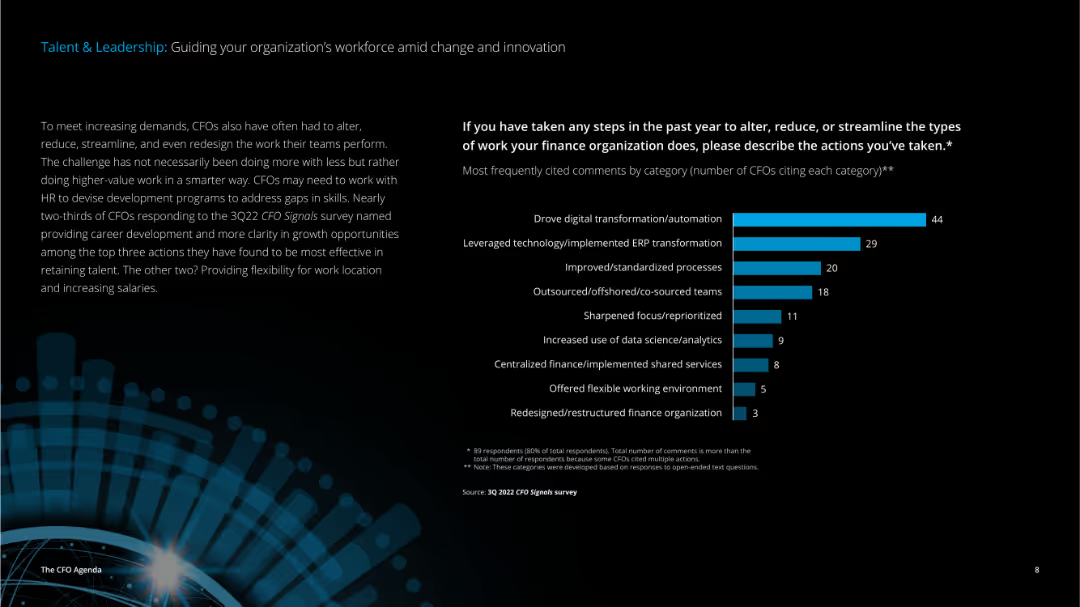
The slide has a detailed text on the left discussing CFO responsibilities and a vertical column chart on the right showing actions taken to streamline finance operations.
Human Resources and Talent Management
Professional Services
This slide outlines the steps CFOs have taken to improve finance operations, focusing on digital transformation, ERP implementation, and process improvements to better manage workforce changes and innovations.
talent, leadership, workforce, innovation, CFO, digital transformation, ERP, process improvement, finance operations
Mixed Chart
Deloitte
Saved
Column charts illustrate CET1 ratio development and risk-weighted assets progression. Bullets summarize key changes and impacts on the CET1 ratio.
Financial Performance
Financial Services
Highlights improvement in CET1 ratio to 14.1% due to capital raises and reductions in risk-weighted assets, providing a stable capital base.
CET1 ratio, risk-weighted assets, capital raises, financial stability, banking metrics
Multiple Chart
Credit Suisse
Saved
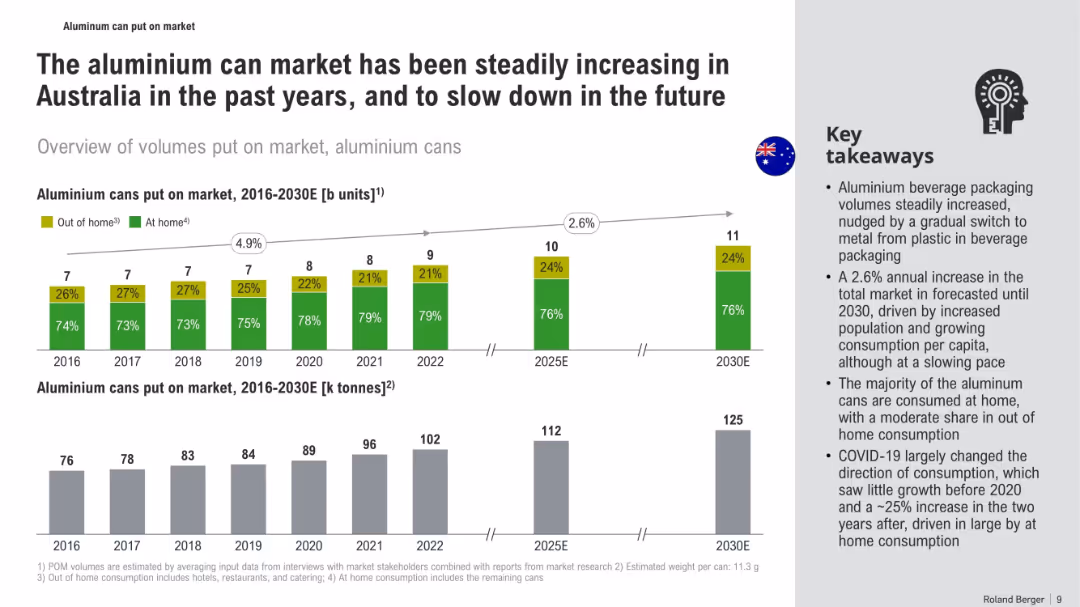
Bar graphs showing units and weight of aluminum cans over time with a takeaway text box on the side. Clean, visual-heavy layout.
Market Analysis and Trends
Consumer Goods
The slide tracks the aluminum can market in Australia from 2016 to 2030E, showing growth and projected stabilization. It highlights consumption trends, including the COVID-19 shift to at-home use, and packaging material shifts.
aluminum cans, market trends, Australia, beverage packaging, consumption, COVID-19, forecast, market growth
Multiple Chart
Roland Berger
Saved
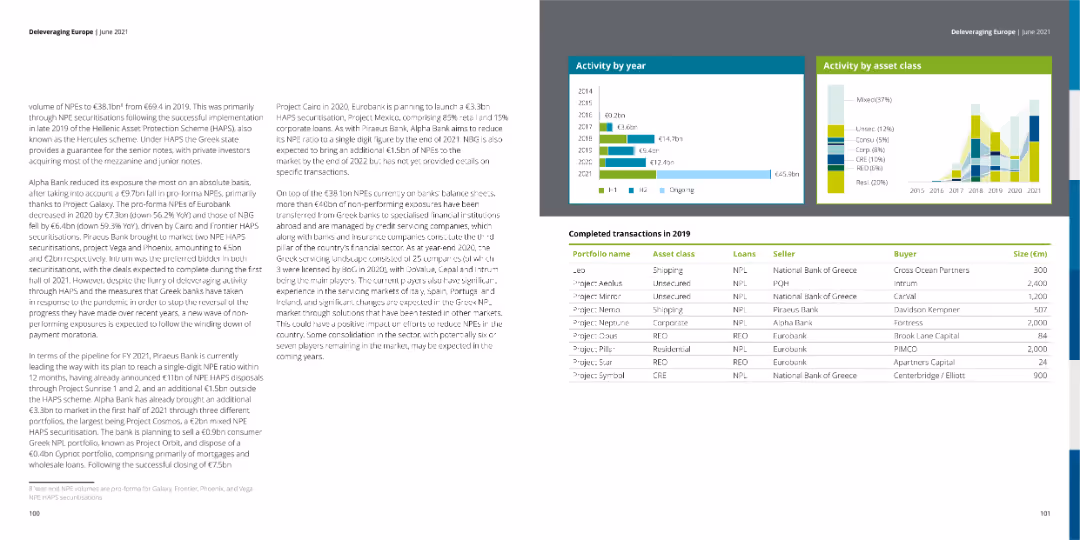
The slide displays tables of completed transactions for 2019, along with bar charts showing activity by year and asset class. The left side contains a dense text block summarizing NPL volumes and actions taken by banks.
Market Analysis and Trends
Financial Services
The slide summarizes the financial activities by year and asset class, including completed transactions in 2019, highlighting trends and strategic moves by various banks.
activity, transactions, asset class, trends, NPL
Multiple Chart
Deloitte
Saved
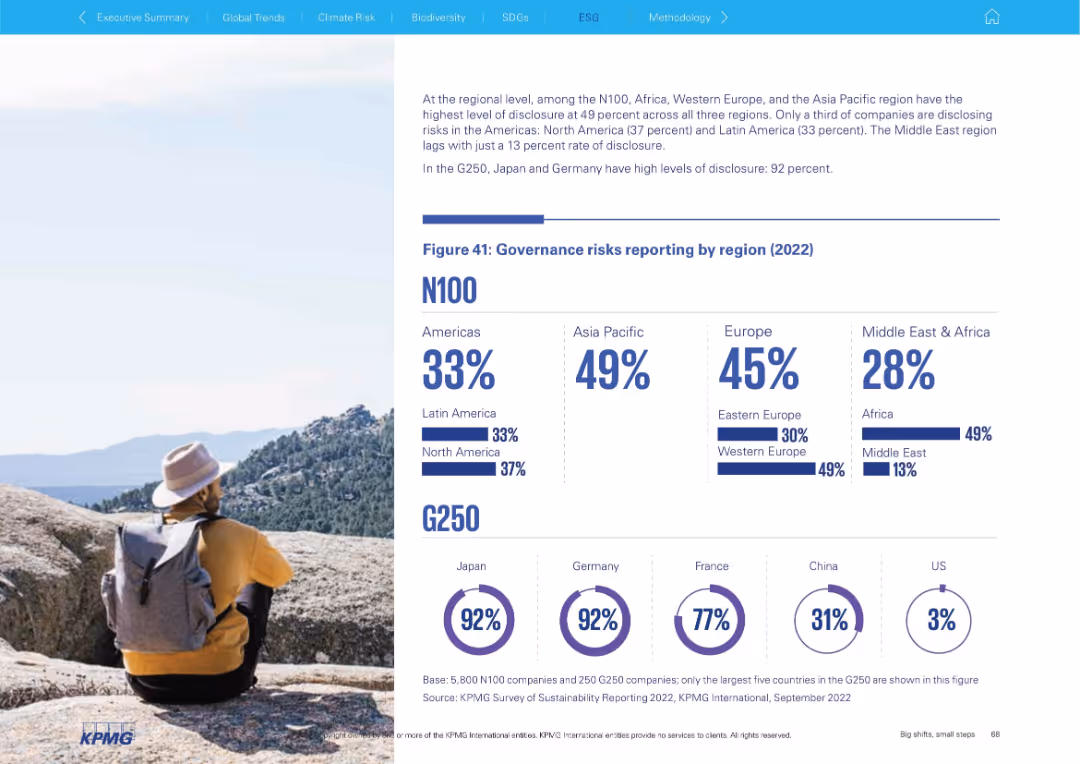
Scenic background photo with governance risk percentages broken down by region and bar graphs for regional comparisons.
Risk Assessment and Management
Professional Services
This slide offers regional insight into governance risk disclosure. Asia Pacific and Europe lead in N100 reporting, while Japan and Germany top G250 reporting. The Middle East lags, especially in N100.
governance, regional breakdown, corporate risk, Asia Pacific, Europe, G250, N100, disclosure rates
Multiple Chart
KPMG
Saved
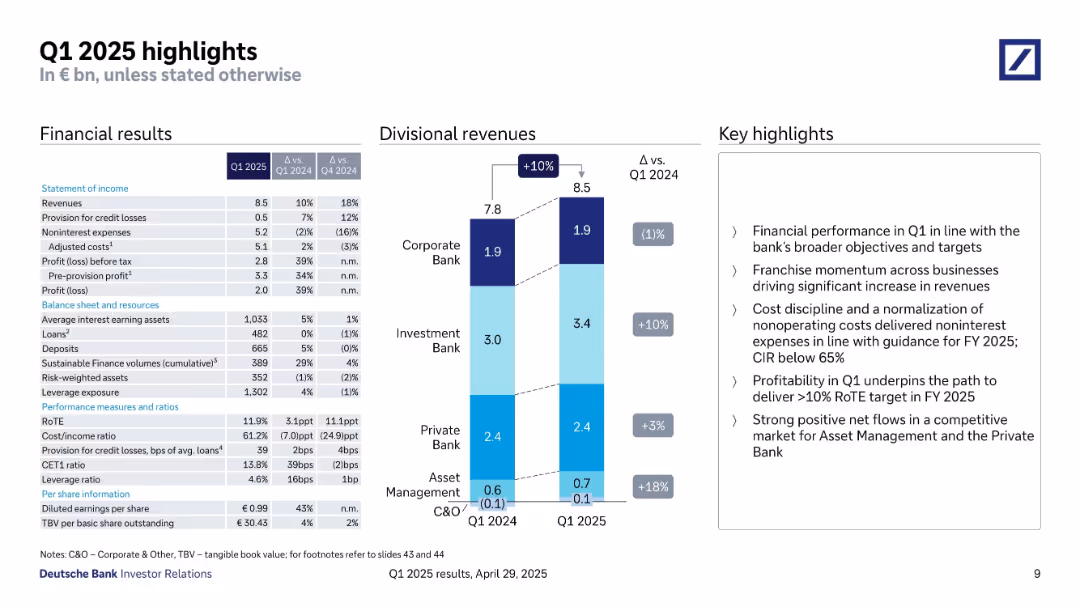
Split layout with financial summary table, bar chart of divisional revenues, and bullet-point key highlights
Strategic Planning
Financial Services
This slide summarizes Deutsche Bank’s Q1 2025 performance including key financials, divisional revenue shifts, and narrative highlights on profitability, cost management, and net flows.
Q1 2025, highlights, revenue, profit, divisions, cost discipline, Deutsche Bank
Mixed Chart
Deutsche Bank
Saved
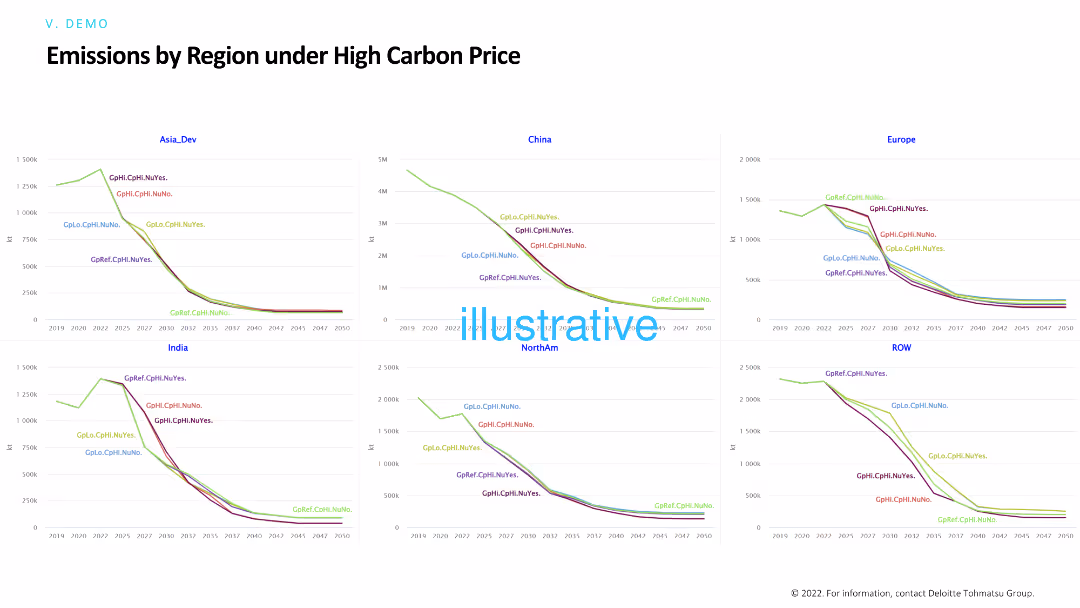
Similar to the previous slide, this one includes line charts showing emissions by region under high carbon price scenarios. The charts provide detailed comparisons of emissions trajectories for different regions over time.
Risk Assessment and Management
Environmental Services & Sustainability
This slide focuses on the impact of high carbon pricing on emissions across various regions, aiding in evaluating the effectiveness of carbon pricing policies in reducing emissions and managing environmental risks.
High carbon price, emissions, regions, environmental policies, carbon pricing
Multiple Chart
Deloitte
Saved
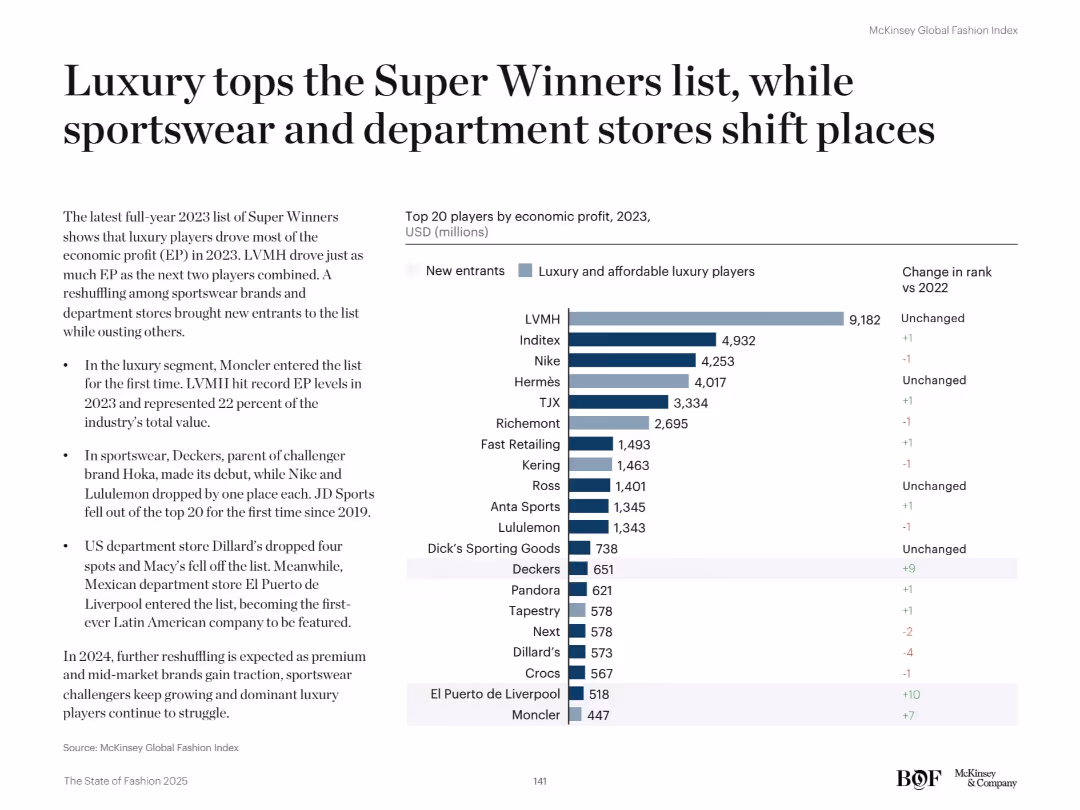
Two-column layout with a ranked bar chart of top 20 companies on the right and explanatory bullet points on the left. Blue and gray color-coding differentiates luxury players and new entrants.
Competitive Landscape
Retail & E-commerce
Luxury companies, led by LVMH, dominated economic profit in 2023. Moncler entered the Super Winners list for the first time. Sportswear reshuffling included new entrants like Deckers, while legacy names like JD Sports and Dillard’s dropped in rank. El Puerto de Liverpool became the first Latin American firm to be featured.
luxury, Super Winners, LVMH, Moncler, department stores, sportswear, EP ranking, new entrants
Mixed Chart
McKinsey
Saved
This slide uses a combination of tables and a chart to present compensation structures. There are text boxes with bullet points, and a flow diagram depicts the performance share plans linkage to ESG criteria.
Financial Performance
Industrial & Manufacturing
Showcases the integration of ESG criteria into Michelin’s managerial compensation, aligning financial incentives with environmental and social governance. It can be used to discuss performance-based compensation strategies.
Compensation, ESG, Performance, Incentives, Management
Header Horizontal
Morgan Stanley
Saved
This slide has a two-column comparative layout with icons and bullet points. The left side is turquoise, the right blue, both featuring text and symbols representing different compensation stages.
Human Resources and Talent Management
Technology & Software
Compares early and late-stage compensation principles, appealing to varying levels of risk and immediacy of benefits, relevant to HR professionals.
compensation, structure, early-stage, late-stage, equity, benchmarks, performance, seniority, trends
Linear Flow
Kearney
Saved
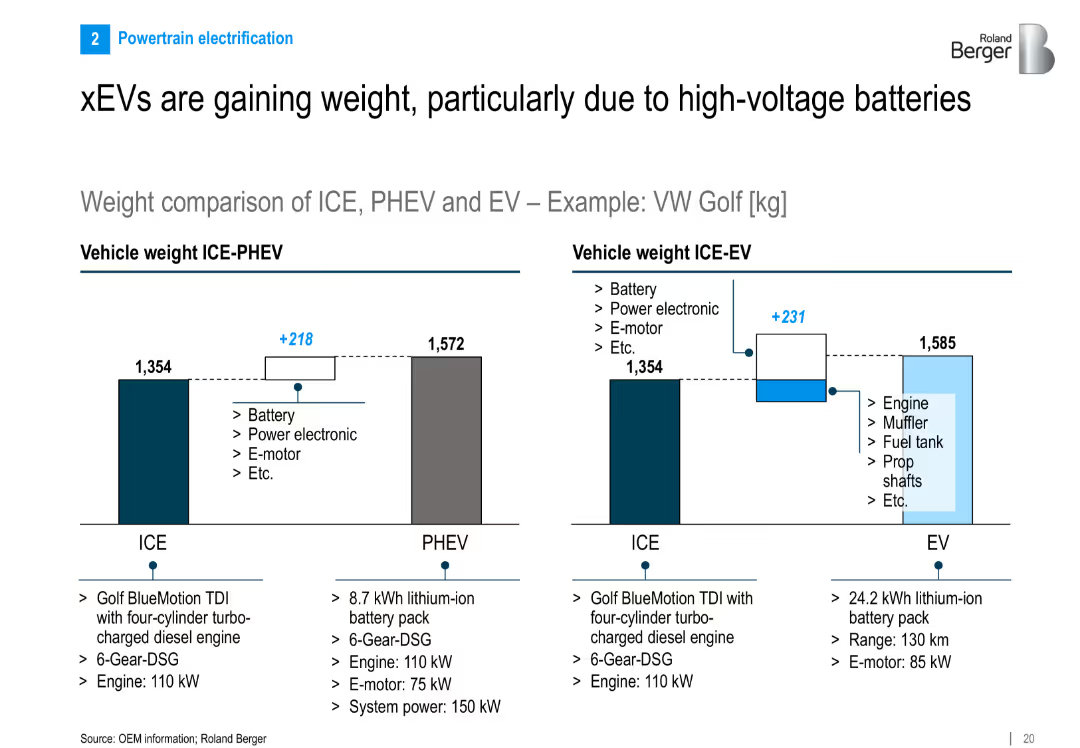
Side-by-side bar charts comparing weight of ICE, PHEV, and EV variants of VW Golf; includes breakdown of added components
Product and Service Analysis
Industrial & Manufacturing
Shows that electrified vehicles (PHEV, EV) are heavier than ICE vehicles due to components like batteries and motors. Uses VW Golf as an example to quantify weight differences and contributing components.
EV weight, PHEV, ICE, battery pack, vehicle mass, VW Golf, e-motor, power electronics
Multiple Chart
Roland Berger
Saved
Side-by-side U.S. maps with product and feedstock advantage overlays; icons for transport/logistics.
Strategic Planning
Energy & Utilities
Shows Montana Renewables’ locational advantage in product distribution and feedstock sourcing. Highlights shorter routes, cost advantages, and favorable policy zones for the company versus competitors.
logistics, feedstock, Montana, PNW access, Calumet, LCFS, renewable fuel, location advantage, transport cost
Multiple Chart
Goldman Sachs
Saved
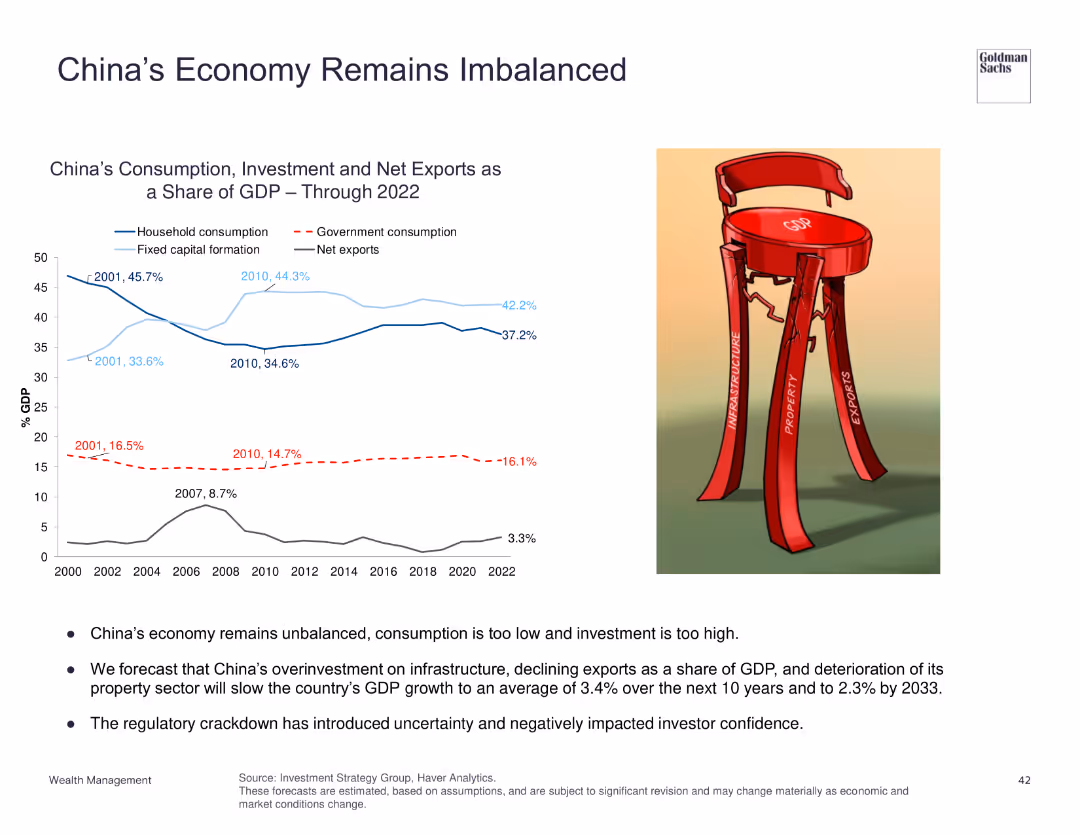
Line charts and an illustration of a broken stool to represent economic imbalance.
Market Analysis and Trends
Financial Services
Analyzes China's consumption, investment, and net exports as a share of GDP, highlighting economic imbalances and future forecasts.
China, economy, GDP, consumption, investment
Mixed Chart
Goldman Sachs
Saved
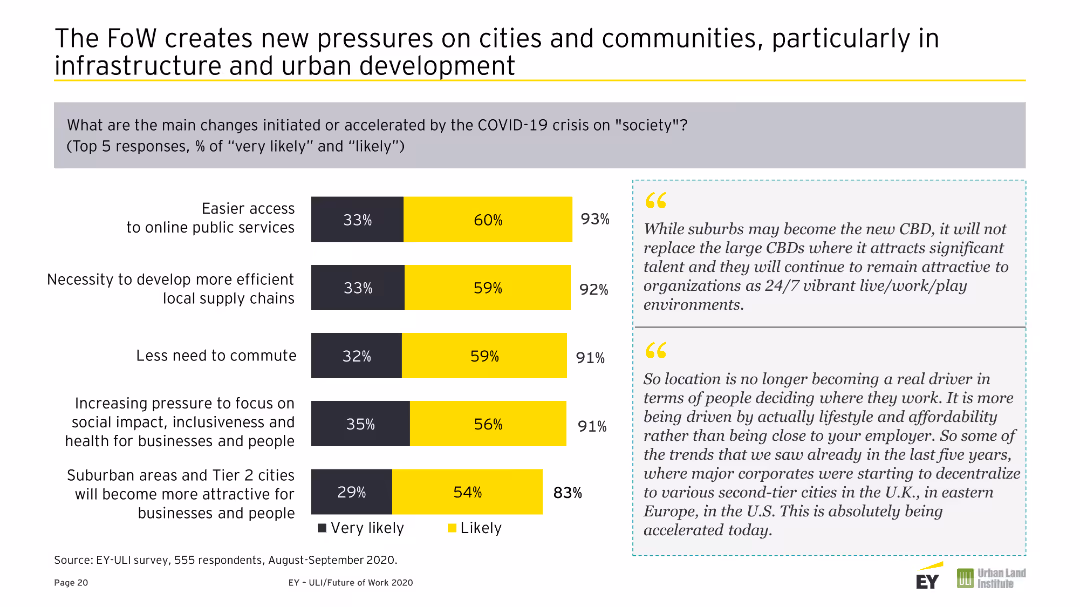
Combination of a column chart and textual information comparing regional expectations of changes in remote work over the next three-to-five years. Colors are yellow and gray.
Market Analysis and Trends
Real Estate & Construction
Compares regional expectations of future work changes, noting significant differences in expectations for remote work between Europe, APAC, and Americas.
Cultural Bias, Europe, Changes, Future of Work, Regional, Comparison, Remote Work, Expectations, Survey
Mixed Chart
EY
Saved
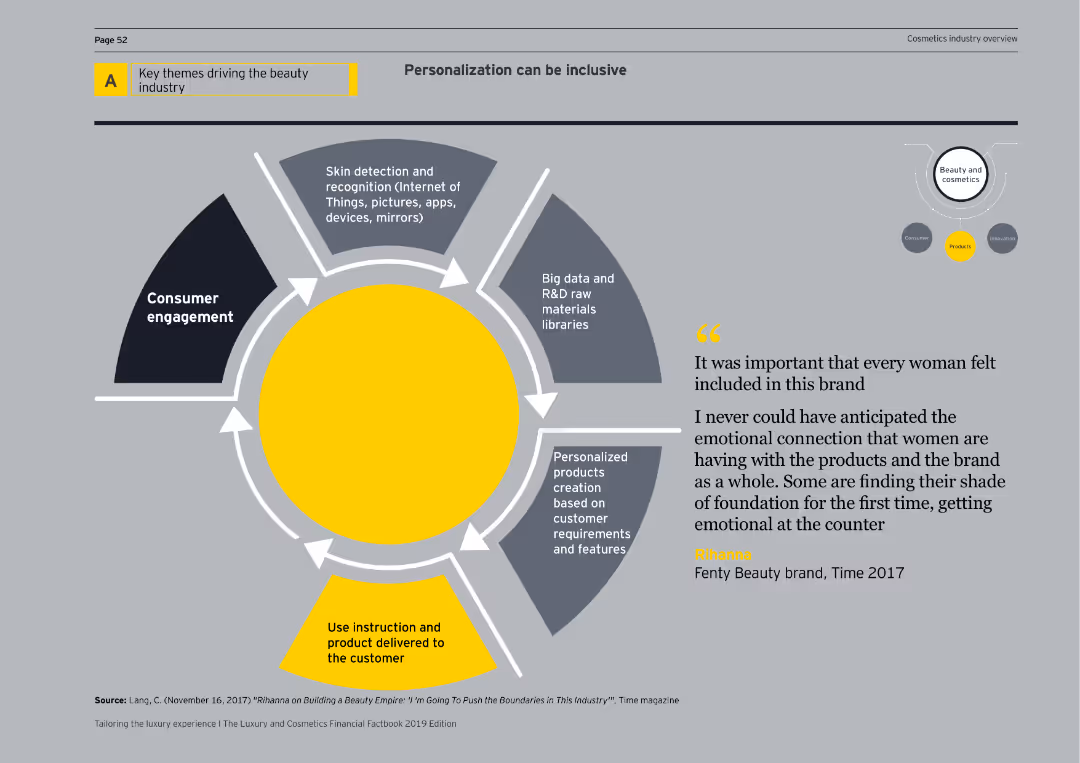
Features a diagram depicting consumer engagement, skin detection, big data, personalized products, and delivery mechanisms for inclusive personalization.
Market Analysis and Trends
Consumer Goods
Explores the role of personalization in the beauty industry, emphasizing inclusive approaches and advanced technological applications.
personalization, inclusivity, consumer engagement, skin detection, big data, beauty products, innovation, cosmetics, diagram, market analysis
Linear Flow
EY
Saved
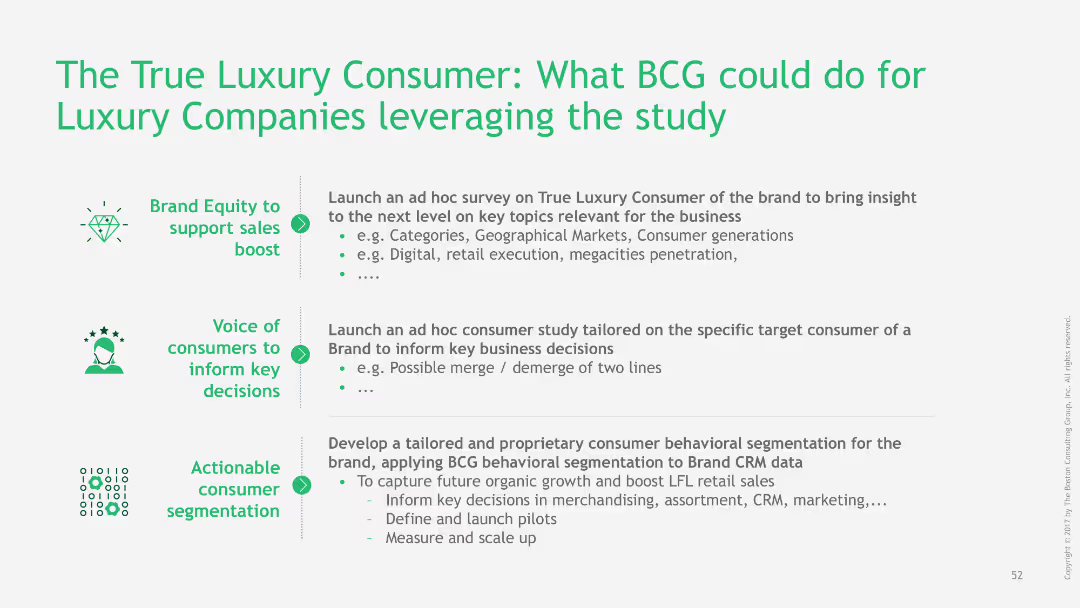
The slide lists actionable insights and strategies for luxury companies based on a study of true luxury consumers.
Strategic Planning
Consumer Goods
The slide provides strategic recommendations for luxury companies to leverage insights from true luxury consumer studies.
luxury consumers, BCG, strategic planning, actionable insights, recommendations
Table
BCG
Saved
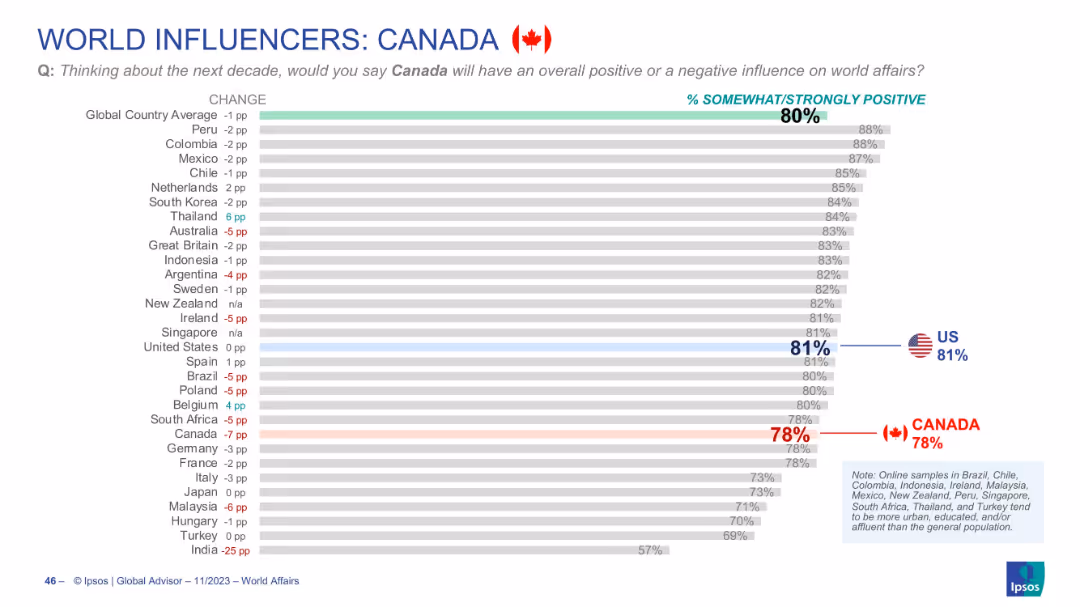
Horizontal bar chart with grey bars showing % positive views of Canada globally; country flags/icons and arrows
Market Analysis and Trends
Government & Public Sector
Shows global perceptions of Canada's influence on world affairs over the next decade. Canada scores 78% positive, slightly below the global average (80%) and U.S. (81%). Includes year-over-year change indicators.
Canada, world influence, perception, Ipsos, global views, public opinion, bar chart, positive rating, global affairs, trend
Single Chart
IPSOS
Saved
Previous
Next
If nothing, comes up, please save your slides first
Create a FREE account to continue browsing
Receive Instant Access to 1,000+ slides from companies like McKinsey, Google, and Goldman Sachs
First Name
Last Name
Email
Password
I agree to all
Terms & Privacy Policy
Thank you! Your submission has been received!
Oops! Something went wrong while submitting the form.
Have an account?
Sign in
Column Chart
Heatmap
Chevron
Org Chart
Infographic
Callouts
Timeline
List
Graphic
Picture
Process Flow
Diagram
Paragraph
Map
Table
Framework
Subtitle
Takeaway Box
Icon
Other Chart
Radar Chart
Waterfall Chart
Mekko Chart
Pie Chart
Scatter Plot
Line Chart
Bar chart
Bullet points