My Account
My Slides
Search by Category
Templates
View All Templates
Download Template Slides
✦ AI Search
Feedback
Login
Logout
Get Started
Browse all Slides
Browse all Slides
Create a FREE Account
Instant access to 1,000+ real slides from top companies like McKinsey, BCG, Goldman Sachs, Google and many more!
First Name
Last Name
Email
Password
I agree to all
Terms & Privacy Policy
Thank you! Your submission has been received!
Oops! Something went wrong while submitting the form.
Have an account?
Sign in
Saved Slides
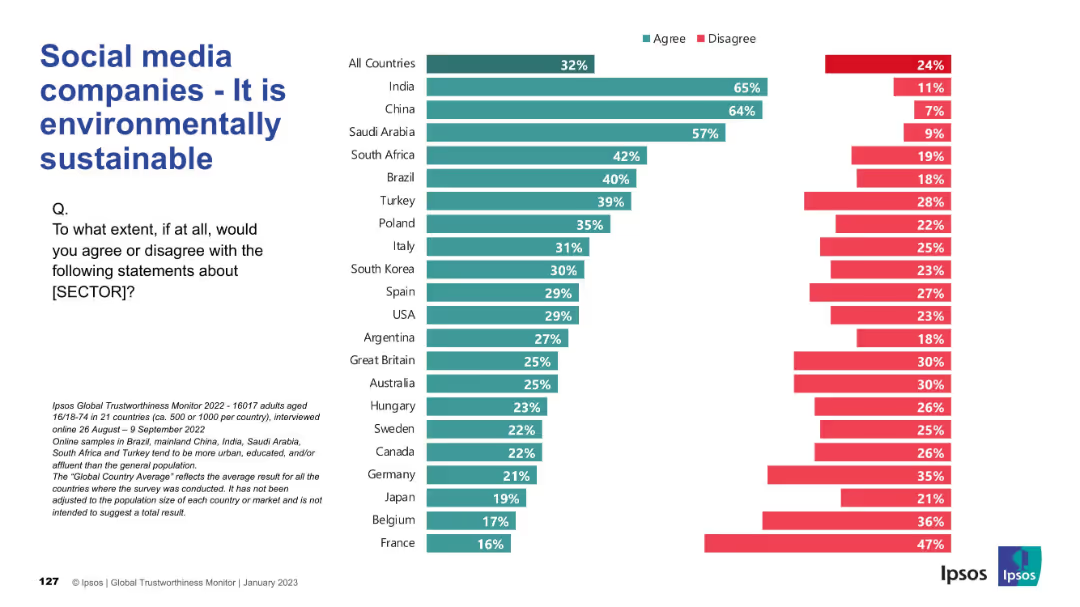
Horizontal bar chart with agreement and disagreement data on social media sustainability by country; consistent Ipsos format.
Market Analysis and Trends
Technology & Software
This slide measures beliefs about the environmental sustainability of social media companies. India and China again lead in trust, but Western nations generally show lower agreement, indicating a gap in environmental perception.
sustainability, environment, green trust, corporate responsibility, Ipsos, perception
Mixed Chart
IPSOS
Saved
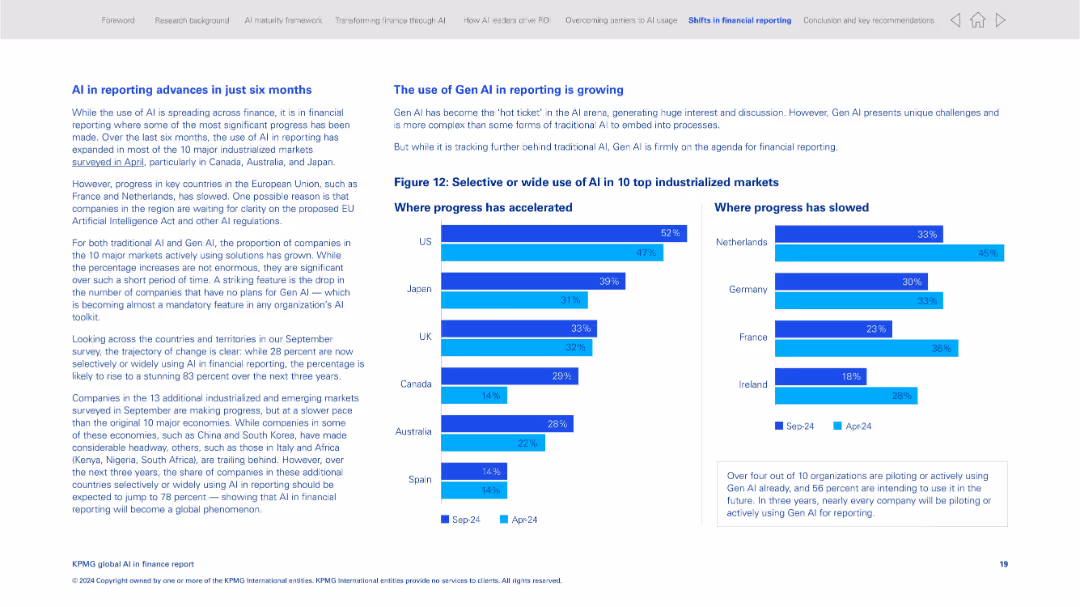
Two-column layout comparing progress in AI adoption by country with horizontal bar charts
Strategic Planning
Financial Services
This slide tracks AI adoption in financial reporting across 10 industrialized countries. It shows the growth in adoption over six months and contrasts it with slower progress in some EU markets. It also discusses the impact of Gen AI on reporting.
AI reporting, financial reporting, country comparison, Gen AI, strategic planning, KPMG survey, adoption trends
Mixed Chart
KPMG
Saved
Slide features two column charts depicting revenue growth and market resiliency.
Market Analysis and Trends
Financial Services
Shows Equifax's revenue resilience and growth levers during economic fluctuations, emphasizing its strength in diverse market conditions.
Revenue, Resilience, Growth, Economy, Market
Multiple Chart
Barclays
Saved
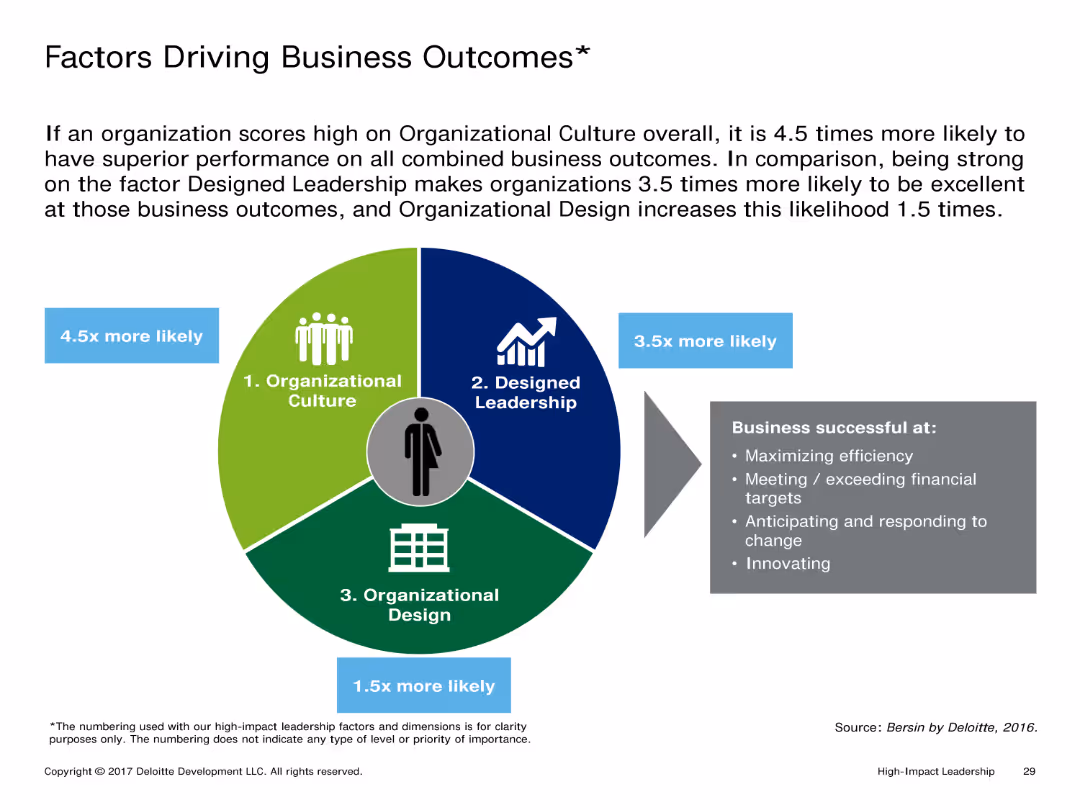
The slide includes a circular diagram divided into three segments representing Organizational Culture, Designed Leadership, and Organizational Design. Each segment lists factors that drive business outcomes.
Market Analysis and Trends
Professional Services
It presents the relationship between high scores in Organizational Culture, Designed Leadership, and Organizational Design, and superior business outcomes. The slide emphasizes the likelihood of business success based on these factors.
Business Outcomes, Organizational Culture, Leadership, Design, Performance
Diagram
Deloitte
Saved
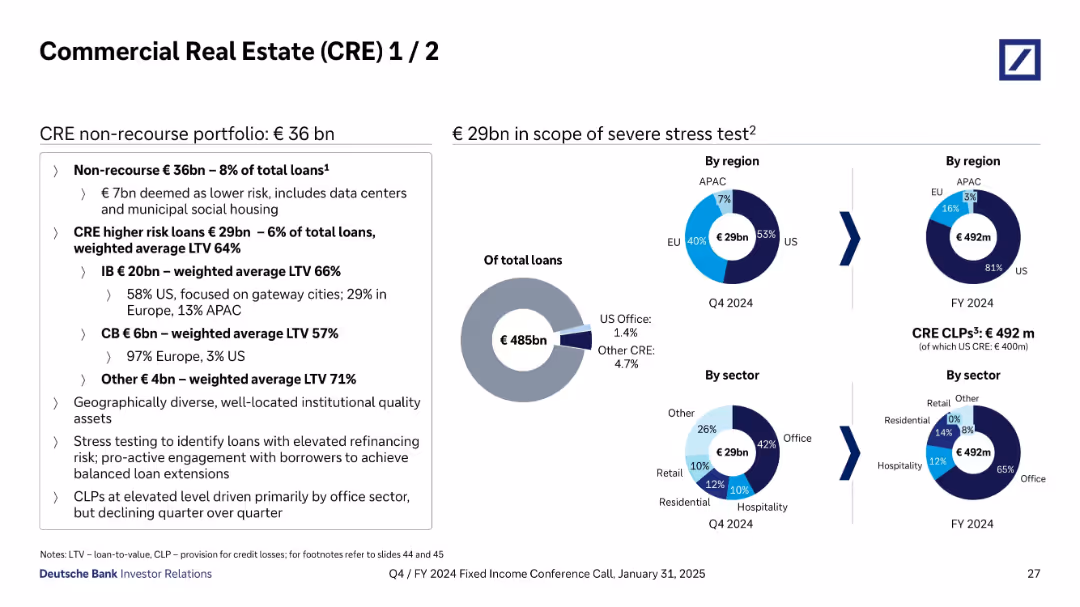
Split into two sections: left text box summarizing CRE portfolio composition; right side includes pie charts by region and sector and loan scope under stress test.
Risk Assessment and Management
Financial Services
Breaks down Deutsche Bank’s €36bn non-recourse CRE portfolio, highlighting €29bn in higher-risk loans and their geographic and sectoral distribution. Provides stress test scope and Credit Loss Provision data, notably focused on US office exposure.
CRE, stress test, LTV, CLPs, office loans, US exposure, EU, APAC, sectors
Mixed Chart
Deutsche Bank
Saved
Features four column charts comparing customer priorities over four periods. The charts highlight preferences for product quality, service, and price, with 'Superior Product Quality' being the most consistent top priority across the periods.
Market Analysis and Trends
Professional Services
This slide analyzes consumer priorities, particularly how they have shifted towards valuing product quality over cost and service. This trend suggests that businesses may need to focus more on product enhancements and quality assurance to meet consumer expectations.
Consumer Behavior, Product Quality, Service, Pricing, Market Trends
Mixed Chart
Deloitte
Saved
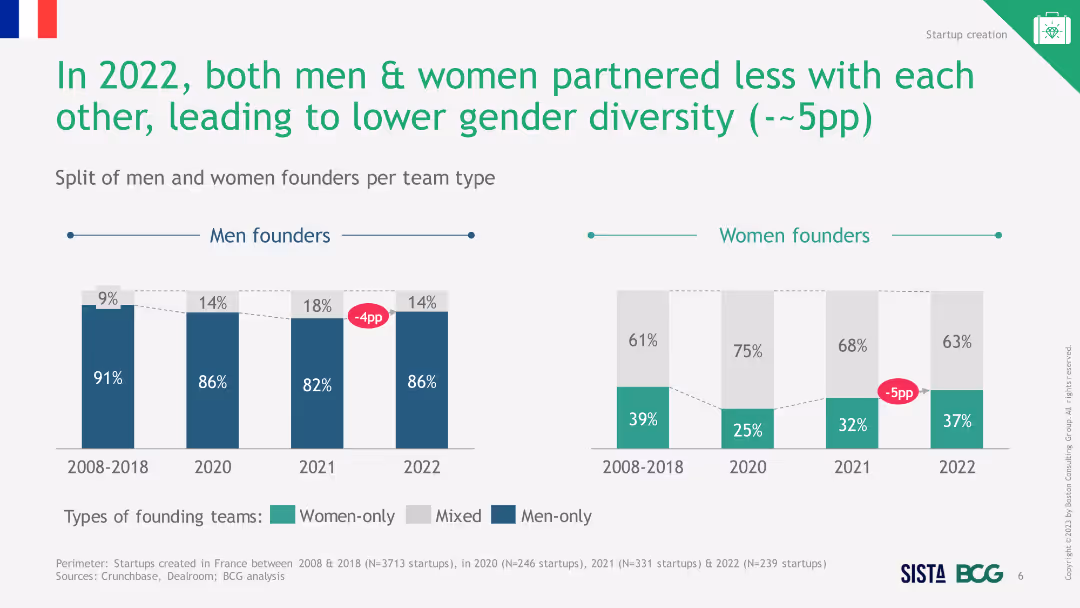
Text and column chart showing the distribution of team types for startups by gender in 2022, highlighting solo and group startups for men and women.
Market Analysis and Trends
Professional Services
The slide indicates that fewer women start businesses solo compared to men and highlights the disparity in partnership types by gender.
women entrepreneurs, solo business, gender disparity
Multiple Chart
BCG
Saved
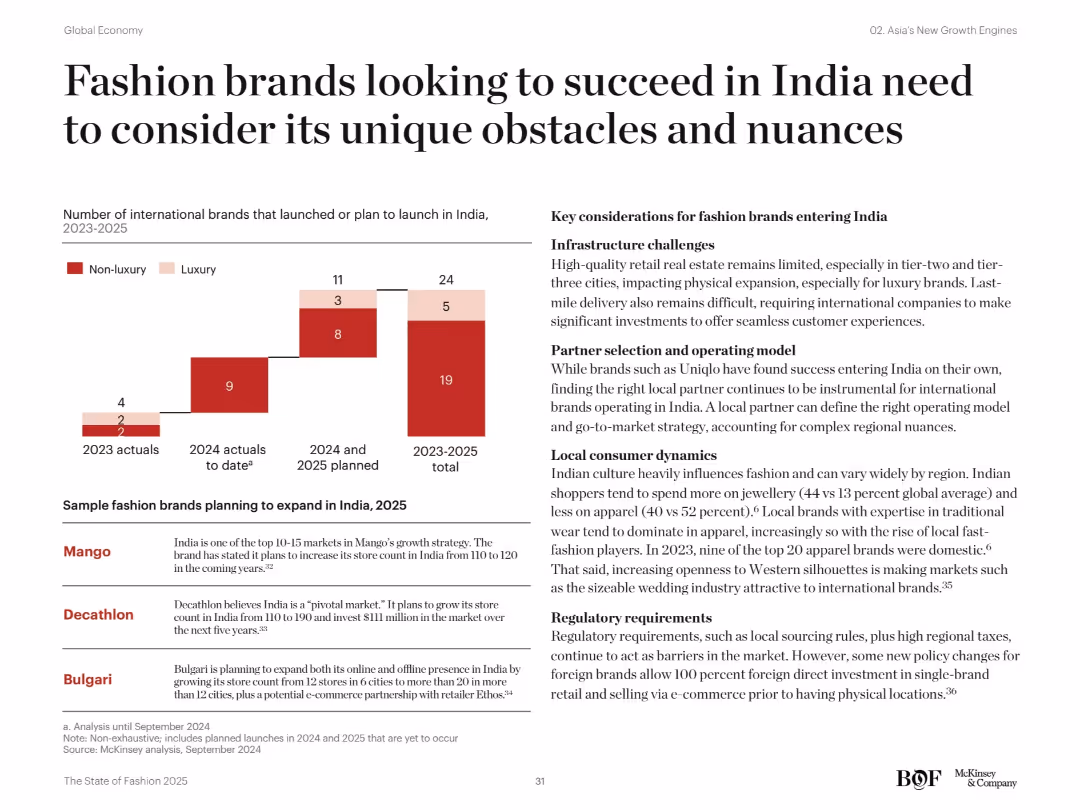
Bar chart on brand launches in India (2023–2025) split by luxury and non-luxury. Text outlines infrastructure, consumer behavior, and regulatory hurdles.
Strategic Planning
Consumer Goods
This slide outlines challenges for fashion brands entering India, such as real estate, complex regulations, and regional cultural differences. It emphasizes the need for strong local partnerships and understanding consumer behavior to navigate India’s growing but nuanced market.
India, fashion brands, infrastructure, regulation, consumer behavior, retail, expansion strategy, partnerships, non-luxury, luxury
Mixed Chart
McKinsey
Saved
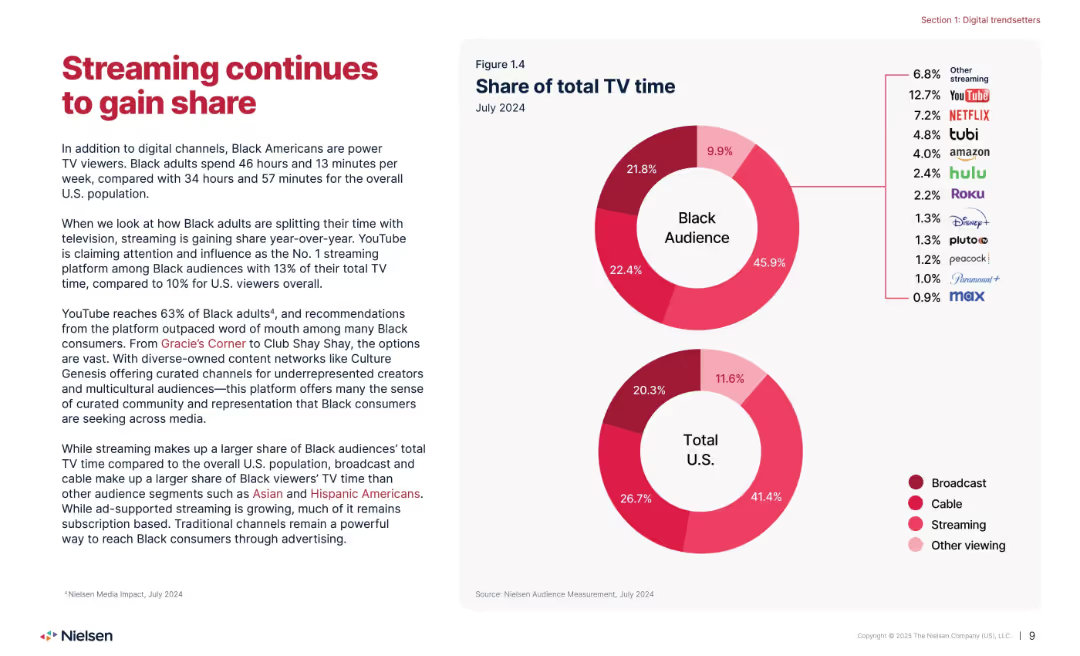
Left column: narrative; right column: donut charts of TV time share by platform.
Market Analysis and Trends
Media & Entertainment
Shows the increasing share of streaming in total TV time among Black audiences, with YouTube as the top streaming platform. Notes differences in platform preferences compared to the total U.S. audience, and highlights representation and cultural connection in content consumption.
streaming, TV, Black audience, YouTube, share, content
Mixed Chart
Nielsen
Saved
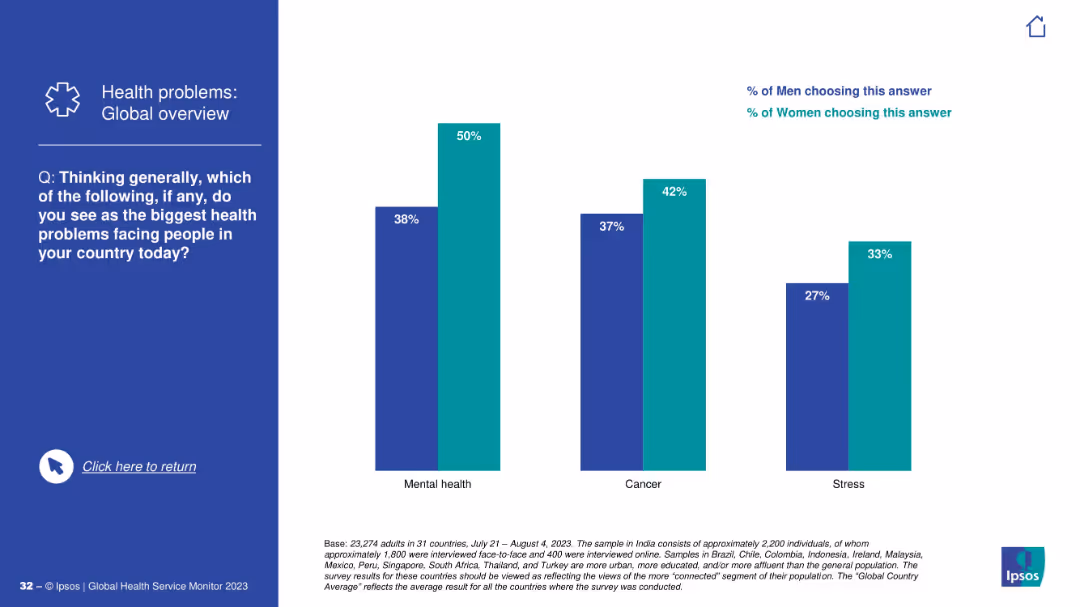
Vertical bar chart comparing gender responses; light blue for women, dark blue for men.
Customer and Market Segmentation
Healthcare & Pharmaceuticals
Gender-specific data reveals that women are significantly more concerned than men about mental health, cancer, and stress, highlighting notable differences in health perception.
gender insights, health concerns, survey data
Mixed Chart
IPSOS
Saved
This slide contains multiple bar graphs and tables presenting data on potential export markets in Asia for Australian battery products. It features countries like Japan, South Korea, India, and Thailand with details on import percentages, partnerships, and vehicle manufacturing statistics. The visual layout is dense with color-coded elements distinguishing different countries and data points.
Competitive Landscape
Energy & Utilities
Discusses how Australia can leverage its reliability and strategic partnerships to boost exports of battery materials to Asian markets, particularly focusing on nations with strong EV growth projections.
exports, Australia, Asia, batteries, materials, EV adoption, market opportunities, partnerships, trade strategy, economic growth
Multiple Chart
Accenture
Saved
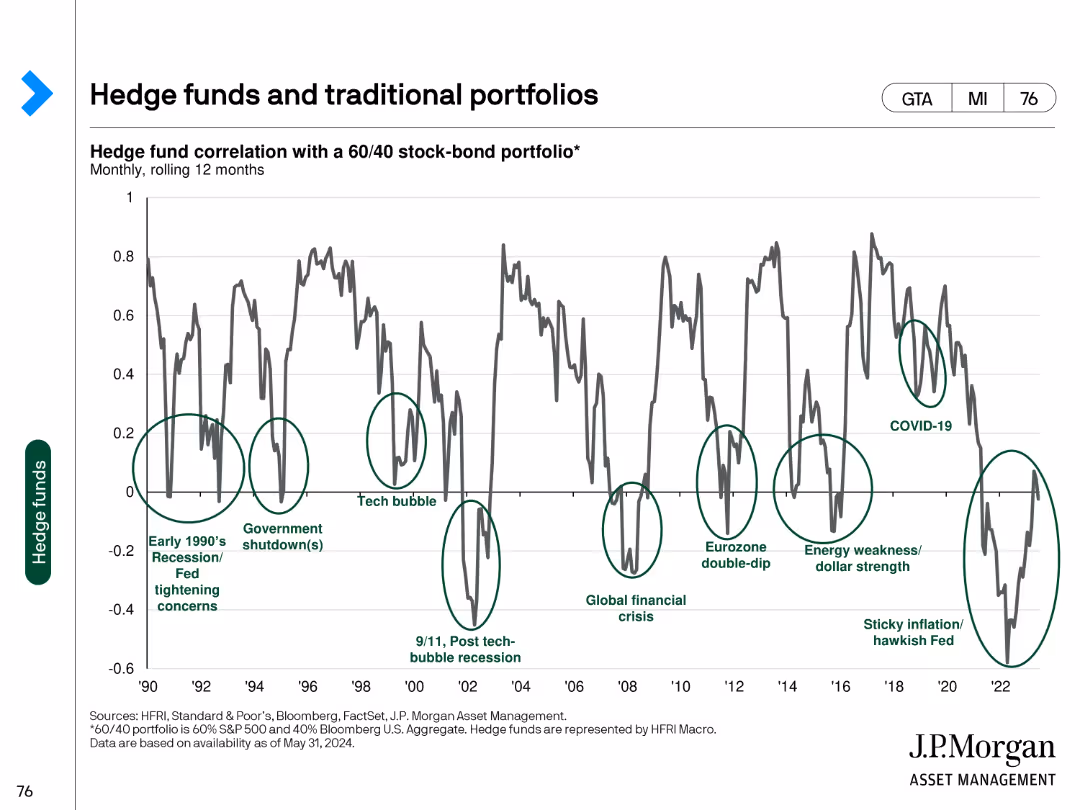
This slide features a line chart showing the correlation of hedge funds with a 60/40 stock-bond portfolio, highlighting major financial events from 1990 to 2024.
Investment Analysis
Financial Services
The slide analyzes the correlation between hedge fund performance and a traditional 60/40 portfolio, indicating how hedge funds behave in different economic conditions.
hedge funds, portfolios, correlation, financial events, investment analysis
Single Chart
JP Morgan
Saved
Features a column chart displaying percentages of brands in different maturity stages, using varying shades of green. The design is straightforward, highlighting key data points effectively.
Market Analysis and Trends
Media & Entertainment
Analyzes the digital marketing maturity of Asia Pacific brands, showing only 2% are at the 'Multi-moment' maturity stage. It provides insights into the distribution of digital marketing maturity among these brands, useful for benchmarking and strategic planning in marketing initiatives.
digital marketing, Asia Pacific, brand maturity, multi-moment, marketing analysis, strategic planning, benchmarking, maturity distribution, column chart
Single Chart
BCG
Saved
This slide displays column charts showing the percentage of publishers utilizing different types of ad targeting in podcast advertising. The types include genre, geo-targeting, context signals, and demo (age & gender). Colors differentiate between current and planned usage.
Market Analysis and Trends
Media & Entertainment
Focuses on the increasing use of demographic and audience overlays in podcast advertising. It highlights a growing trend towards more targeted advertising strategies, reflecting the industry's push towards more precise and effective advertising placements.
targeting, podcast, advertising, demographics, 2021
Single Chart
PwC/Strategy&
Saved
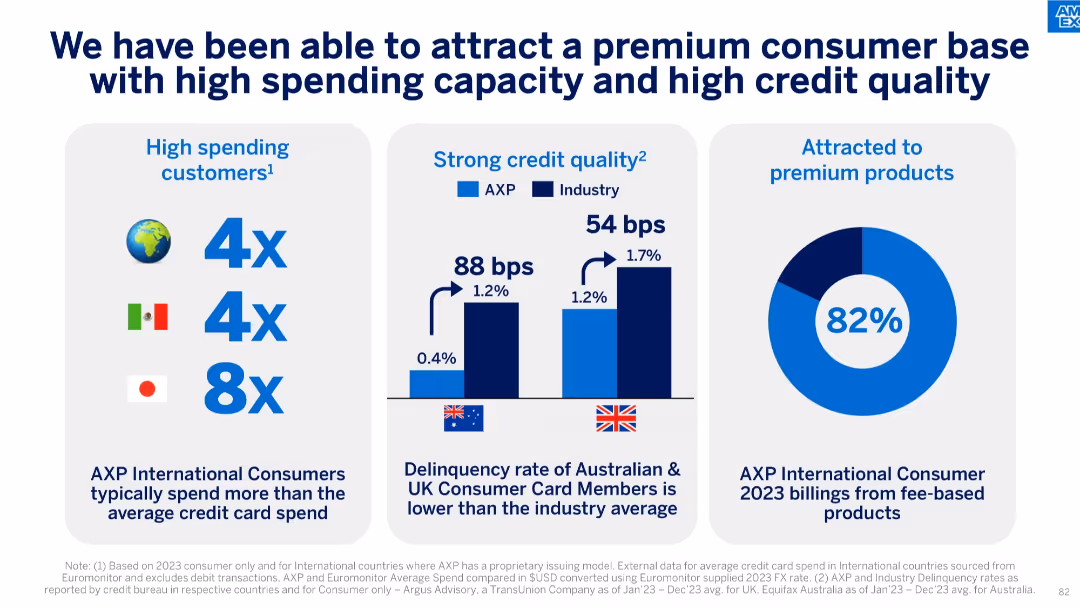
Three-column layout with charts and text; shows high spend, low delinquency, and premium product adoption.
Customer and Market Segmentation
Financial Services
Emphasizes that AXP attracts high-spending and low-risk international consumers, particularly in Japan, Mexico, UK, and Australia. Also shows that 82% of 2023 international consumer billing came from premium fee-based products.
premium customers, credit quality, card spend, delinquency rate, fee-based products, international consumers, segmentation
Multiple Chart
McKinsey
Saved
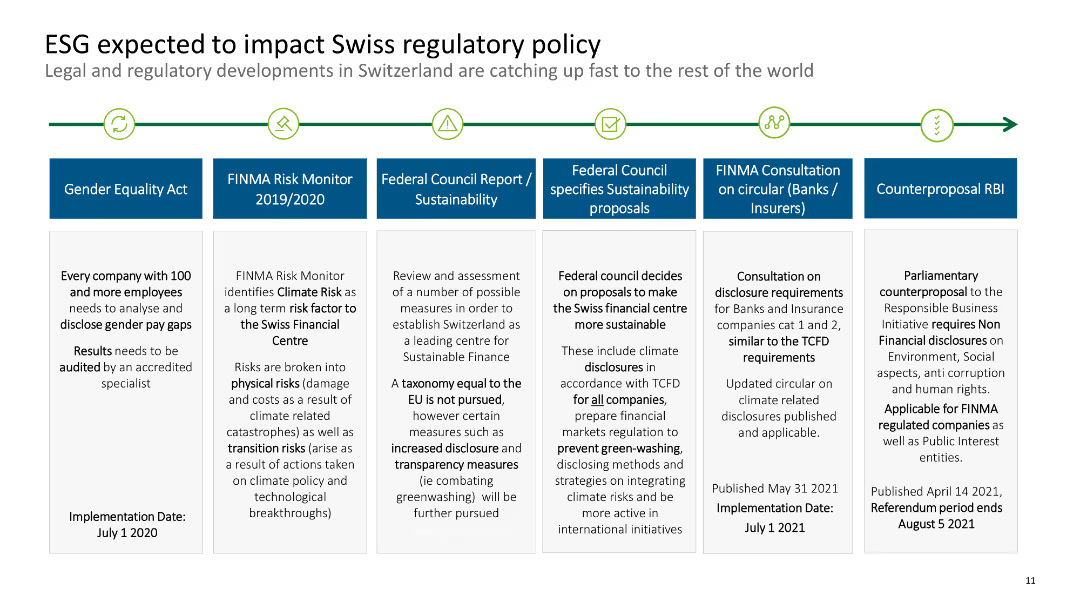
The slide includes a timeline with various regulatory milestones related to ESG and their expected impacts on Swiss policy.
Regulatory and Compliance
Financial Services
It discusses the expected impacts of ESG on Swiss regulatory policy, covering various acts and initiatives from the Gender Equality Act to the Parliamentary Counterproposal RBI.
ESG, Swiss, regulatory, policy, timeline
Linear Flow
Deloitte
Saved
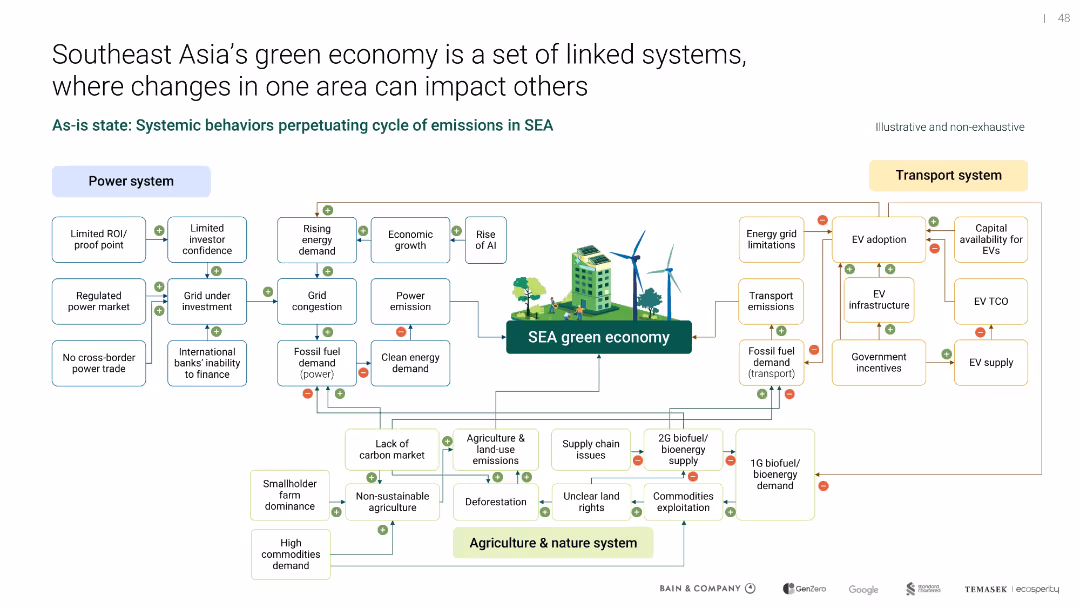
Complex systems map with interlinked categories (power, transport, agriculture) surrounding central “green economy”
Operational Efficiency
Environmental Services & Sustainability
A systems diagram illustrates how power, transport, and agriculture interact to shape SEA’s green economy. It identifies bottlenecks, demand pressures, and feedback loops that hinder decarbonization and sustainability progress.
systems thinking, SEA, emissions, green economy, agriculture, transport
Uncategorized
Bain
Saved
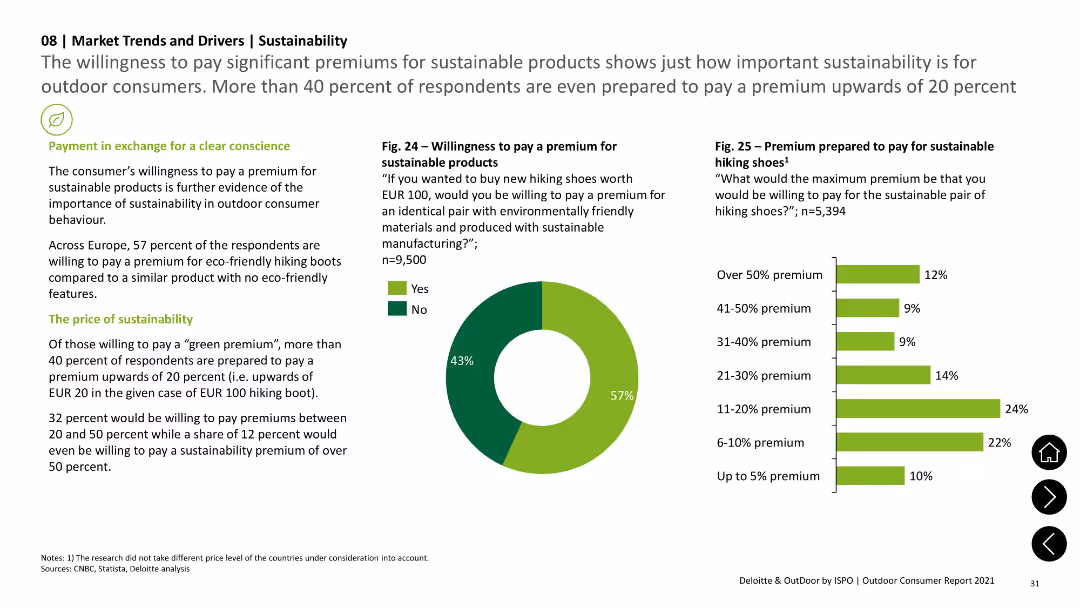
The slide features a pie chart showing willingness to pay a premium for sustainable products and a column chart displaying the range of premiums consumers are willing to pay. Text sections provide context and explanations.
Technology and Digital Transformation
Consumer Goods
The slide focuses on consumers' willingness to pay a premium for sustainable products, with survey data indicating the percentage of respondents ready to pay different premium levels for eco-friendly hiking boots.
sustainability, pricing, consumer behavior, premium, eco-friendly products
Multiple Chart
Deloitte
Saved
Slide contains multiple column charts showing financial metrics from 2021 to 2023 with projections for 2026.
Financial Performance
Financial Services
Highlights key financial targets and progress of a financial institution over several years.
financials, targets, projections, banking, metrics
Multiple Chart
Barclays
Saved
Column chart showing average annual wheat exports by destination region for Australia, Canada, and Ukraine, with text discussing competition in key export markets.
Competitive Landscape
Agriculture & Food Production
The slide analyzes competition in wheat export markets, comparing Australia's export destinations to those of Canada and Ukraine and highlighting competitive pressures.
wheat exports, competition, Australia, Canada, Ukraine
Mixed Chart
LEK
Saved
The slide presents two charts: a bar chart on sector composition by market cap for large and small caps, and a line chart on small vs. large cap relative valuation.
Investment Analysis
Financial Services
Analyzes large vs. small cap equities, focusing on market cap composition and valuation comparisons, useful for portfolio management strategies.
equities, large cap, small cap, market cap, valuation
Multiple Chart
JP Morgan
Saved
Cumulative line chart depicting the cost curve for nickel production against a carbon penalty scenario for 2021 on a dark background.
Regulatory and Compliance
Environmental Services & Sustainability
Explores the implications of carbon pricing on the nickel value chain, quantifying the cost impact and discussing the broader financial and environmental considerations.
nickel, carbon pricing, cost impact, environment, sustainability
Single Chart
McKinsey
Saved
The slide contains multiple column charts with data annotations and a legend. Dense with numerical data, use of blue tones, and clear segmentation of information.
Investment Analysis
Technology & Software
This slide details the year-over-year growth of Indonesia's digital economy, focusing on sectors such as e-commerce and online media, suitable for presentations on investment opportunities and market growth trends.
digital economy, growth, Indonesia, e-commerce, online media
Multiple Chart
Bain
Saved
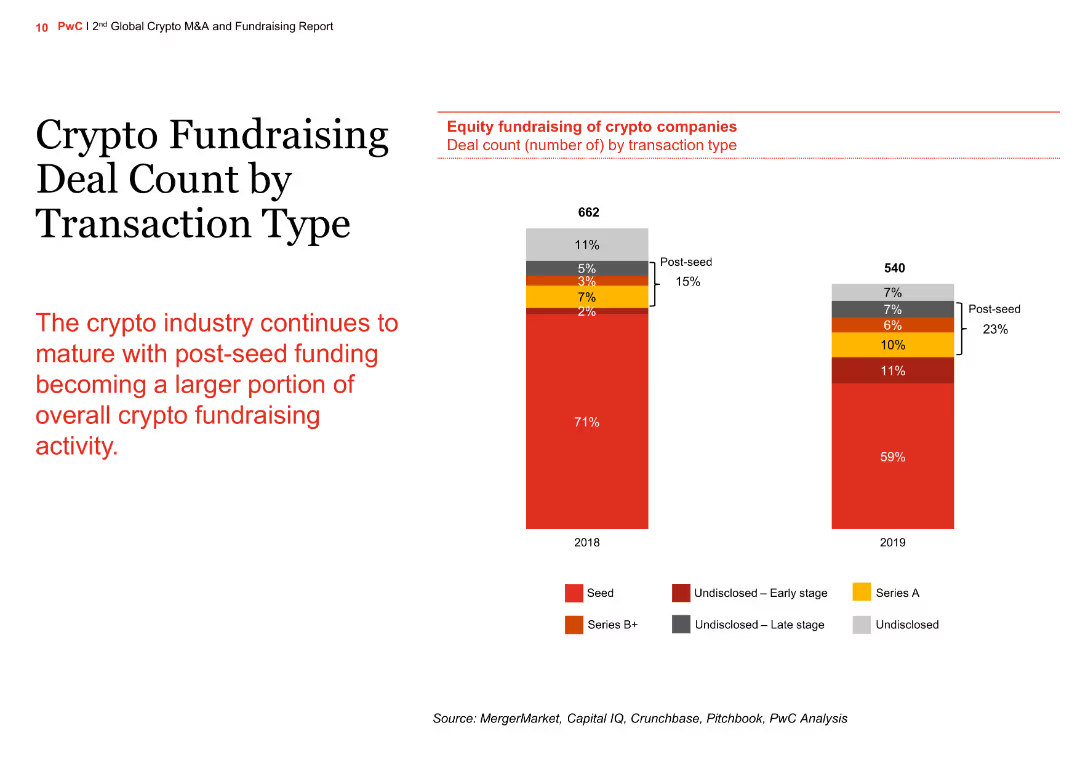
The slide contains a column chart comparing crypto fundraising deal counts by transaction type for the years 2018 and 2019. The chart shows the distribution of seed, Series A, Series B+, and undisclosed funding stages.
Market Analysis and Trends
Financial Services
The slide illustrates the maturation of the crypto industry with an increasing portion of post-seed funding. It compares the number of deals across different funding stages between 2018 and 2019, highlighting the growth in post-seed funding.
crypto, fundraising, transaction type, column chart, comparison
Mixed Chart
PwC/Strategy&
Saved
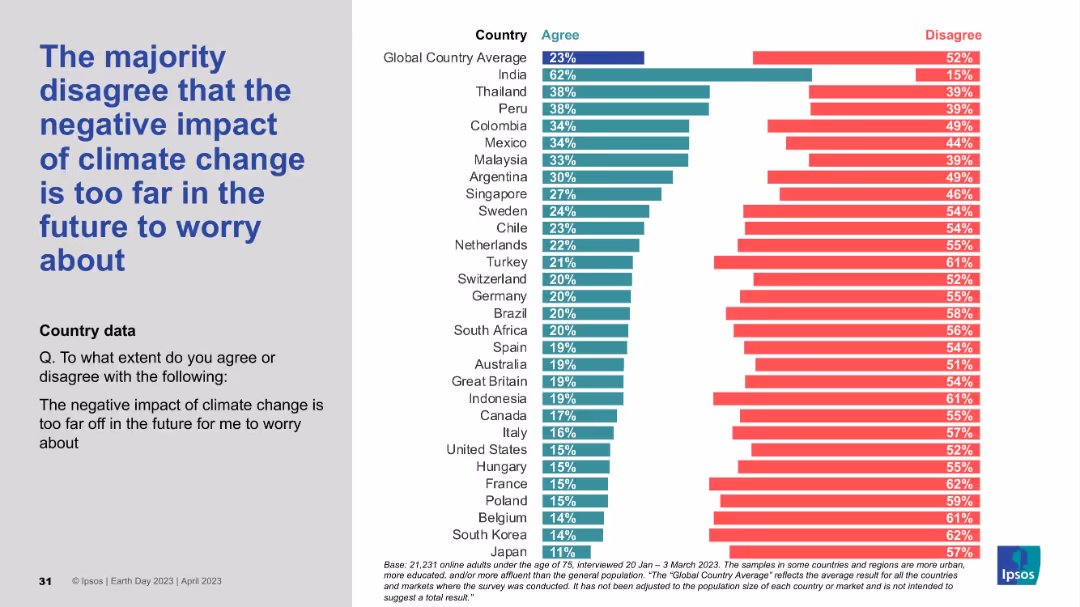
Split layout with bold blue text on the left and a horizontal bar chart on the right comparing country-level opinions.
Market Analysis and Trends
Environmental Services & Sustainability
This slide presents survey results showing that a global majority disagrees with the idea that climate change's negative effects are too distant to be concerned about. It compares agreement/disagreement percentages across countries, with India having the highest agreement and Japan the lowest.
climate change, public opinion, global survey, perception, country comparison, Ipsos, sustainability, environment, concern, urgency
Mixed Chart
IPSOS
Saved
Previous
Next
If nothing, comes up, please save your slides first
Create a FREE account to continue browsing
Receive Instant Access to 1,000+ slides from companies like McKinsey, Google, and Goldman Sachs
First Name
Last Name
Email
Password
I agree to all
Terms & Privacy Policy
Thank you! Your submission has been received!
Oops! Something went wrong while submitting the form.
Have an account?
Sign in
Column Chart
Heatmap
Chevron
Org Chart
Infographic
Callouts
Timeline
List
Graphic
Picture
Process Flow
Diagram
Paragraph
Map
Table
Framework
Subtitle
Takeaway Box
Icon
Other Chart
Radar Chart
Waterfall Chart
Mekko Chart
Pie Chart
Scatter Plot
Line Chart
Bar chart
Bullet points