My Account
My Slides
Search by Category
Templates
View All Templates
Download Template Slides
Leave Feedback
Login
Logout
Get Started
Browse all Slides
Browse all Slides
Create a FREE Account
Instant access to 1,000+ real slides from top companies like McKinsey, BCG, Goldman Sachs, Google and many more!
First Name
Last Name
Email
Password
I agree to all
Terms & Privacy Policy
Thank you! Your submission has been received!
Oops! Something went wrong while submitting the form.
Have an account?
Sign in
Spark Your Next Big Idea with New Presentation Templates
VIEW ALL Templates
Welcome,
Welcome
PRO
Show Featured Only
Checkbox 8
Companies
Mckinsey
Bain
BCG
EY
Deloitte
Accenture
PwC/Strategy&
JP Morgan
Goldman Sachs
Morgan Stanley
Citigroup
Deutsche Bank
Barclays
LEK
KPMG
Kearney
Oliver Wyman
Booz Allen Hamilton
Gartner
IPSOS
Nielsen
Slide type
Text Only
Linear Flow
Vertical Flow
Single Chart
Header Horizontal
Mixed Chart
Header Vertical
Pillar
Multiple Chart
Graphic
Agenda
Title
Table
Framework
Industry
Technology & Software
Artificial Intelligence
Financial Services
Retail & E-commerce
Consumer Goods
Industrial & Manufacturing
Transportation & Logistics
Telecommunications
Real Estate & Construction
Hospitality & Tourism
Professional Services
Education & Training
Media & Entertainment
Agriculture & Food Production
Healthcare & Pharmaceuticals
Environmental Services & Sustainability
Government & Public Sector
Use Case
Mergers and Acquisitions
Performance Metrics and KPIs
Client Case Studies
Competitive Landscape
Corporate Finance and Valuation
Product and Service Analysis
Customer and Market Segmentation
Organizational Structure and Change
Industry Overview
Regulatory and Compliance
Risk Assessment and Management
Investment Analysis
Organizational Structure and Change
Human Resources and Talent Management
Financial Performance
Market Analysis and Trends
Sales and Business Development
Human Resources and Talent Management
Clear all
Thank you! Your submission has been received!
Oops! Something went wrong while submitting the form.
Tag
View slide
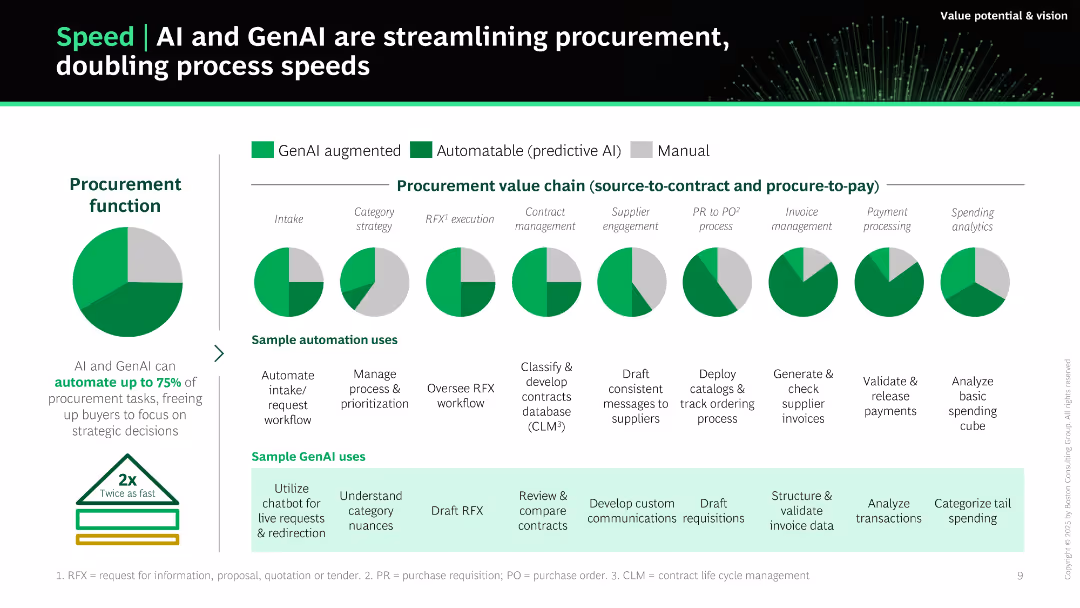
Bar chart-style layout with pie charts under each procurement function. Color-coded segments show GenAI, predictive AI, and manual tasks. Green tones dominate.
Operational Efficiency
Technology & Software
Shows how AI and GenAI accelerate procurement by automating 75% of tasks. Highlights AI applications across the procurement value chain (e.g., intake, contract management, payments). Each step is broken down with sample automation and GenAI use cases.
AI, GenAI, procurement, automation, efficiency, speed, process, sourcing
false
Operational Efficiency
Technology & Software technology-and-software
Mixed Chart
BCG
View slide
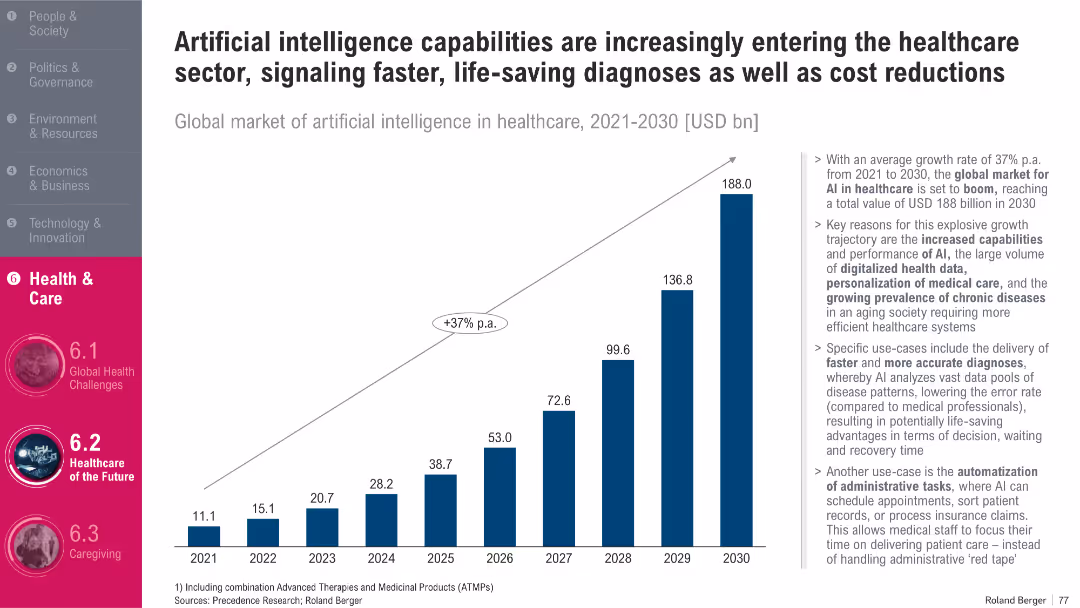
Vertical bar graph with year-by-year projections; upward growth trend; side bullet list on impact and use-cases
Technology and Digital Transformation
Artificial Intelligence
The slide presents forecasts for the AI healthcare market, expected to grow at 37% annually until 2030. It outlines how AI enhances diagnosis speed, reduces administrative workload, and supports chronic disease management. Emphasis is placed on the expanding role of AI in transforming healthcare delivery.
AI, Healthcare, Forecast, Digital Health, Diagnosis, Automation
false
Technology and Digital Transformation
Artificial Intelligence artificial-intelligence
Mixed Chart
Roland Berger
View slide
Four column charts presenting results from a global survey about the use of AI in 2019, with selected views of entrepreneurs and scientists on AI.
Technology and Digital Transformation
Technology & Software
The slide discusses the mixed reactions to the growing power of AI, presenting survey results that show both enthusiasm and concern about its use. It emphasizes the importance of maintaining human values in AI development and includes perspectives from prominent figures in the technology industry.
AI, Human Values, Survey, Perspectives
false
Technology and Digital Transformation
Technology & Software technology-and-software
Mixed Chart
Roland Berger
View slide
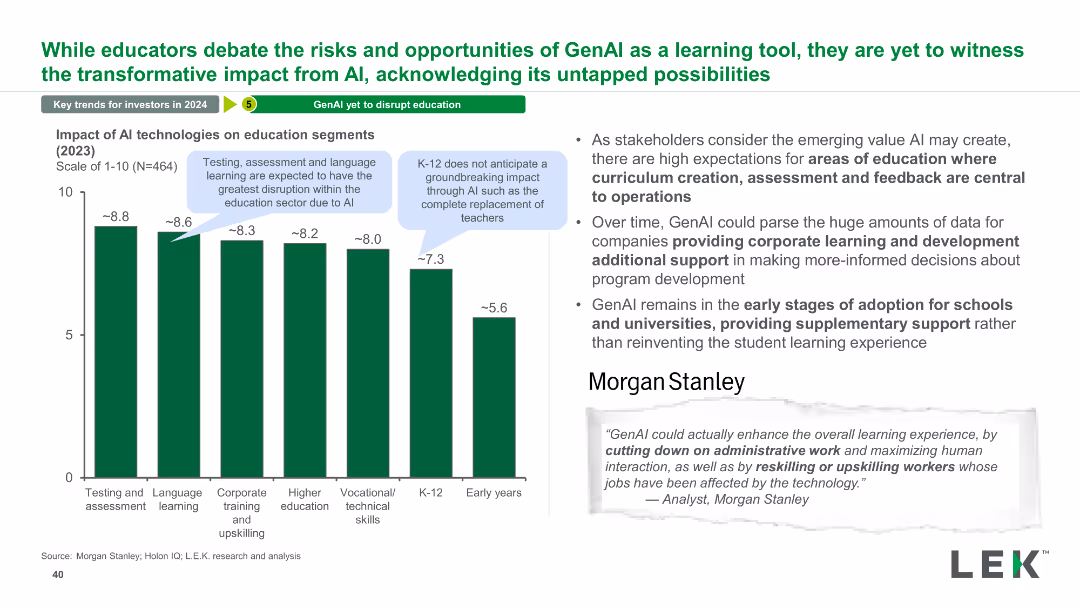
The slide has a column chart showing the impact of AI technologies on various education segments, with a narrative section explaining potential benefits and stakeholder expectations.
Technology and Digital Transformation
Education & Training
This slide explores the potential impact of AI on different segments of the education sector, highlighting areas like testing, assessment, and corporate training.
AI, Impact, Education, Segments, Technology, Testing, Assessment, Training, Benefits, Expectations
false
Technology and Digital Transformation
Education & Training education-and-training
Mixed Chart
LEK
View slide
The slide contains a column chart, bullet points, and icons. It utilizes a balanced design with green growth indicators and well-structured textual information.
Market Analysis and Trends
Technology & Software
This slide emphasizes the impact of AI/ML on business, showcasing past performance and future targets, with mentions of use cases for personalization and client relationships, as well as the growth of the AI team.
AI, ML, data, impact, personalization, analytics, team growth, technology platforms, business value
false
Market Analysis and Trends
Technology & Software technology-and-software
Mixed Chart
JP Morgan
View slide
The slide features a robotic hand reaching towards textual content against a dark blue background. It includes a two-column layout with selected AI technologies and use cases. Icons are used to represent different concepts like machine learning and risk management.
Industry Overview
Technology & Software
This slide discusses the application of AI in business, listing foundational methods and practical use cases such as risk management and service operations optimization. It suggests a growing adoption of AI across industries.
AI, Machine Learning, Risk Management, Service Operations, Technology Adoption, Business Use Cases
false
Industry Overview
Technology & Software technology-and-software
Header Horizontal
McKinsey
View slide
Contains bar charts and a narrative section. The charts illustrate media coverage trends focusing on AI-related topics like job displacement and privacy, using different shades of purple to represent varying amounts of media mentions over time.
Technology and Digital Transformation
Technology & Software
Discusses shifts in public and media focus regarding AI, from job displacement concerns to privacy and job creation opportunities.
AI, Media, Job Displacement, Privacy, Trust, Public Perception, Coverage, Trends, Technology
false
Technology and Digital Transformation
Technology & Software technology-and-software
Multiple Chart
Accenture
View slide
Slide includes horizontal column charts categorized by business line and account size in purple and yellow tones, highlighting technology usage in underwriting.
Technology and Digital Transformation
Financial Services
Discusses how AI and NLP technologies are used to extract information for underwriting, segmented by business size.
AI, NLP, underwriting, business size, data extraction
false
Technology and Digital Transformation
Financial Services financial-services
Mixed Chart
Accenture
View slide
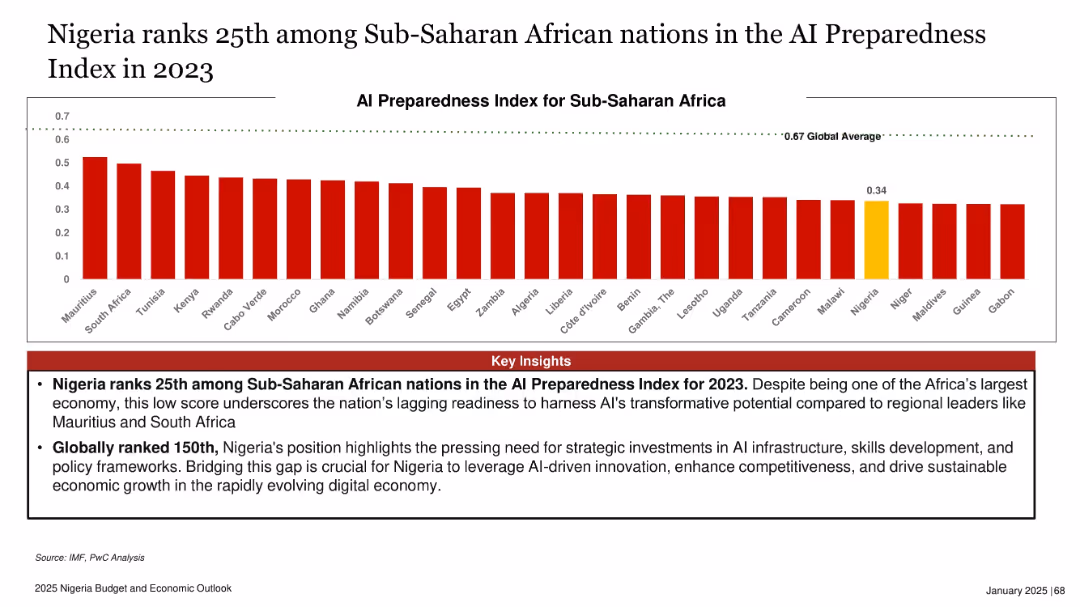
Horizontal bar chart comparing AI readiness index scores of SSA countries; Nigeria highlighted in yellow
Industry Overview
Artificial Intelligence
The slide ranks Nigeria low in AI preparedness among Sub-Saharan African nations, with a score of 0.34—below the global average of 0.67. Insights emphasize the urgent need for investments in infrastructure, policy, and skills to leverage AI’s economic potential and competitiveness in the digital age.
AI, Nigeria, digital economy, infrastructure, readiness, innovation, skills, policy
false
Industry Overview
Artificial Intelligence artificial-intelligence
Mixed Chart
PwC/Strategy&
View slide
A slide with two bar charts and a pie chart, detailing AI firms' stages in VC and PE funding and their likelihood of exiting via IPO. The visual complexity is moderate, focusing on investment stages and geographical data.
Technology and Digital Transformation
Technology & Software
The slide discusses the growth of AI firms in private domains, highlighting their stages in venture capital and private equity funding rounds. It provides data on the geographical distribution of these firms and their likelihood of going public, with a focus on future growth and public market potential.
AI, Private Domain, IPO, VC, PE, Growth, Technology
false
Technology and Digital Transformation
Technology & Software technology-and-software
Multiple Chart
EY
View slide
This slide contains bar charts showing percentage increases in productivity, confidence, meaningful impact, and stress management among sales professionals using AI tools. Each bar is labeled with the exact percentage increase, providing a clear quantitative measure.
Strategic Planning
Technology & Software
Examines the positive changes in productivity, confidence, and stress management reported by sales professionals using AI tools.
AI, Sales, Productivity, Confidence, Impact, Stress Management, Tools, Professional Services, Technology
false
Strategic Planning
Technology & Software technology-and-software
Mixed Chart
Accenture
View slide
Bar chart displays the expected emphasis on workforce skills needed for AI integration, categorized into technical, cognitive, and social skills, among others. Each category has columns for increase, stay the same, and decrease.
Human Resources and Talent Management
Education & Training
Discusses the workforce skills necessary for effective AI adoption in enterprises, focusing on areas like technical skills and cognitive abilities, based on a global survey.
AI, Skills, Workforce, Training, Adoption
false
Human Resources and Talent Management
Education & Training education-and-training
Single Chart
Kearney
View slide
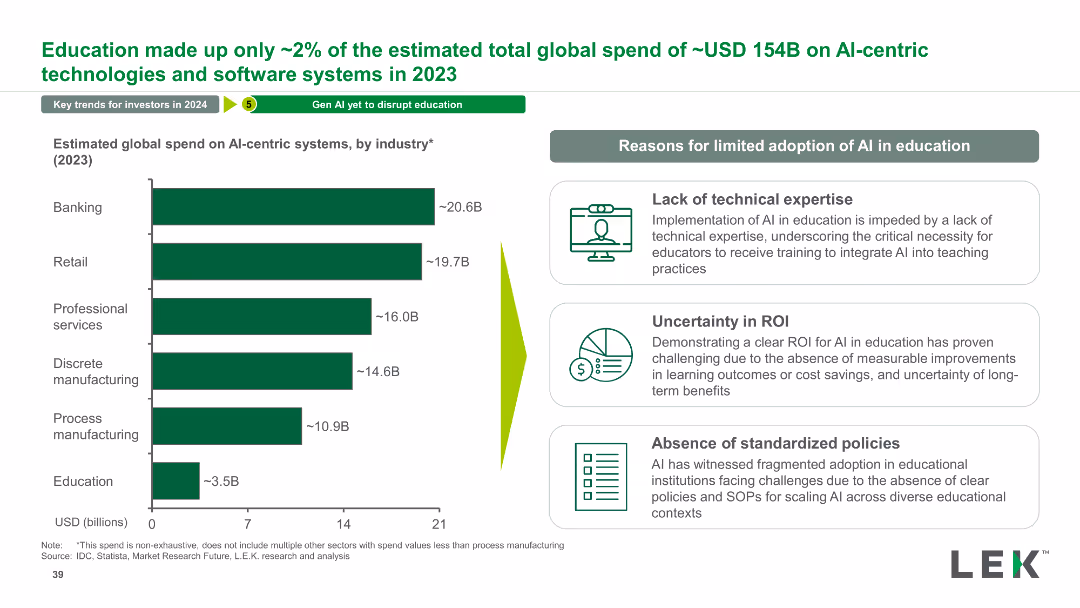
The slide features a column chart showing the estimated global spend on AI-centric systems by various industries in 2023, alongside a list of reasons for limited adoption of AI in education.
Market Analysis and Trends
Technology & Software
This slide provides an overview of global spending on AI systems across industries, emphasizing the limited adoption of AI in education and explaining the reasons behind it.
AI, Spending, Industry, Technology, Education, Analysis, Trends, Global, Market, Adoption
false
Market Analysis and Trends
Technology & Software technology-and-software
Mixed Chart
LEK
View slide
Column chart showing the role of AI as an enabler or inhibitor under various sustainable development goals (SDGs) to 2030.
Technology and Digital Transformation
Technology & Software
The slide evaluates the impact of AI on achieving global sustainable development goals by 2030, suggesting that AI is more often seen as an enabler rather than an inhibitor. It presents data on AI's potential to contribute positively to various societal categories, such as no poverty, quality education, and clean water and sanitation.
AI, Sustainable Development Goals, Enabler
false
Technology and Digital Transformation
Technology & Software technology-and-software
Mixed Chart
Roland Berger
View slide
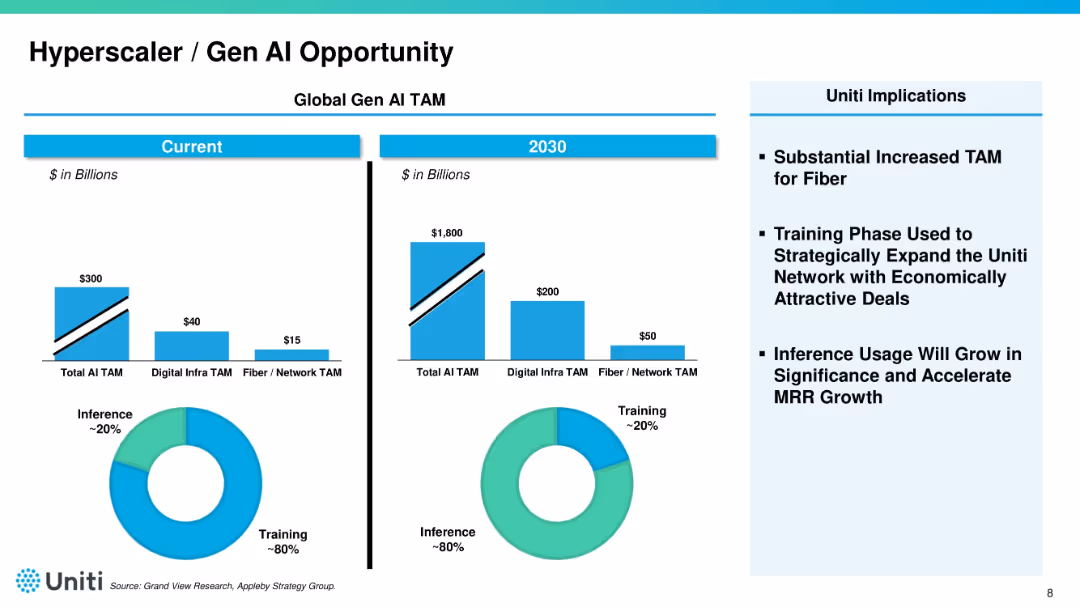
Split-panel layout showing "Current" vs. "2030" projections for AI TAM with bar charts and pie charts. Right side shows bullet-pointed implications for Uniti. Blue color palette dominates.
Market Analysis and Trends
Telecommunications
Compares current and projected total addressable market (TAM) for AI, digital infrastructure, and fiber. Notes a shift from training to inference usage by 2030. Emphasizes the strategic opportunity for Uniti in the AI infrastructure space.
AI, TAM, hyperscaler, fiber, training, inference, growth opportunity
false
Market Analysis and Trends
Telecommunications telecommunications
Multiple Chart
Goldman Sachs
View slide
Includes bullet points and case study examples from various sectors showing AI's role in team dynamics.
Human Resources and Talent Management
Technology & Software
Discusses AI's role in enhancing team effectiveness, learning, and morale across different organizational contexts.
AI, Team Effectiveness, Organizational Learning, Role Clarity, Morale Boost, Case Studies, Human Resources
false
Human Resources and Talent Management
Technology & Software technology-and-software
Table
BCG
View slide
Incorporates a pie chart displaying the adoption status of AI tools and a bar graph showing the top business applications of AI, complete with accompanying descriptions.
Technology and Digital Transformation
Technology & Software
Highlights the uptake of AI technologies in business with an emphasis on operational applications, signaling a trend towards digital transformation and the integral role of AI in business strategies.
AI, Technology, Adoption, Business Operations
false
Technology and Digital Transformation
Technology & Software technology-and-software
Multiple Chart
JP Morgan
View slide
The slide includes a gradient purple background with three phases of AI evolution (Diagnostic, Predictive, Generative) represented in a timeline format. Icons and brief descriptions mark each phase, providing a visual and textual overview of AI's development through the years.
Technology and Digital Transformation
Technology & Software
Provides an overview of the phases of AI development, highlighting key characteristics and advancements in each phase.
AI, Technology, Evolution, Diagnostic, Predictive, Generative, Development, Phases, Software
false
Technology and Digital Transformation
Technology & Software technology-and-software
Table
Accenture
View slide
This slide features multiple column charts comparing the impact of generative AI on different countries and industries. It uses shades of purple to differentiate between augmentation and automation potential, with detailed percentage labels for clarity.
Technology and Digital Transformation
Technology & Software
Analyzes the projected impact of generative AI on working hours across various industries and countries.
AI, Work, Automation, Augmentation, Industries, Countries, Impact, Technology, Labor
false
Technology and Digital Transformation
Technology & Software technology-and-software
Multiple Chart
Accenture
View slide
This slide presents survey data comparing worker and executive opinions on AI's impacts. It uses contrasting colors to differentiate between groups, and includes key statistics for areas like job security and technology understanding.
Strategic Planning
Technology & Software
Highlights differences in perception between executives and workers regarding the impact of AI on job security and workplace integration.
AI, Workers, Executives, Perceptions, Impact, Job Security, Technology, Survey, Professional Services
false
Strategic Planning
Technology & Software technology-and-software
Mixed Chart
Accenture
View slide
The slide features a diagram illustrating Ipsos's reputation and policy legislation intelligence platform, highlighting data sources, analytics, and actionable alerts.
Technology and Digital Transformation
Technology & Software
It details Ipsos’s AI and advanced analytics platforms, explaining how they help clients sense and respond in real time using various data sources and technologies.
AI, analytics, Ipsos, data, real-time response
false
Technology and Digital Transformation
Technology & Software technology-and-software
Linear Flow
IPSOS
View slide
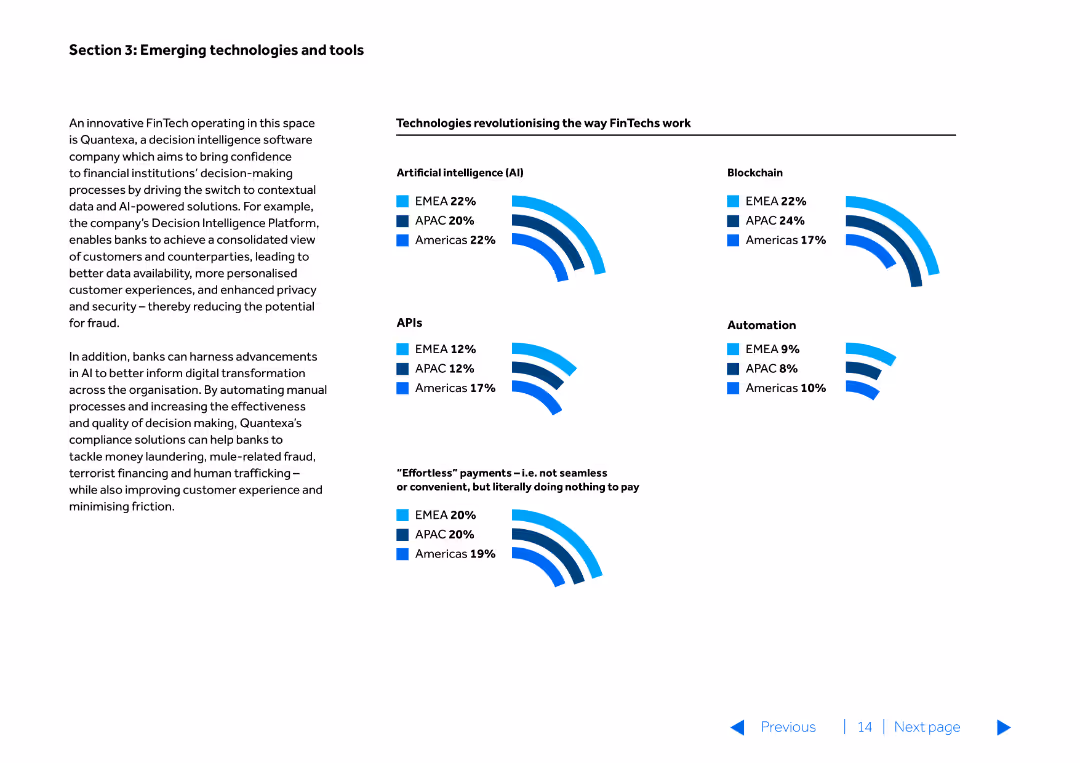
This slide is text-heavy with multiple icons representing different technologies (AI, Blockchain, APIs, Automation). The layout is simple, focusing on the descriptive text and technological impact.
Technology and Digital Transformation
Financial Services
Describes various emerging technologies like AI, blockchain, APIs, and automation, and their transformative impact on the financial services industry.
AI, blockchain, APIs, automation, FinTech
false
Technology and Digital Transformation
Financial Services financial-services
Multiple Chart
Barclays
View slide
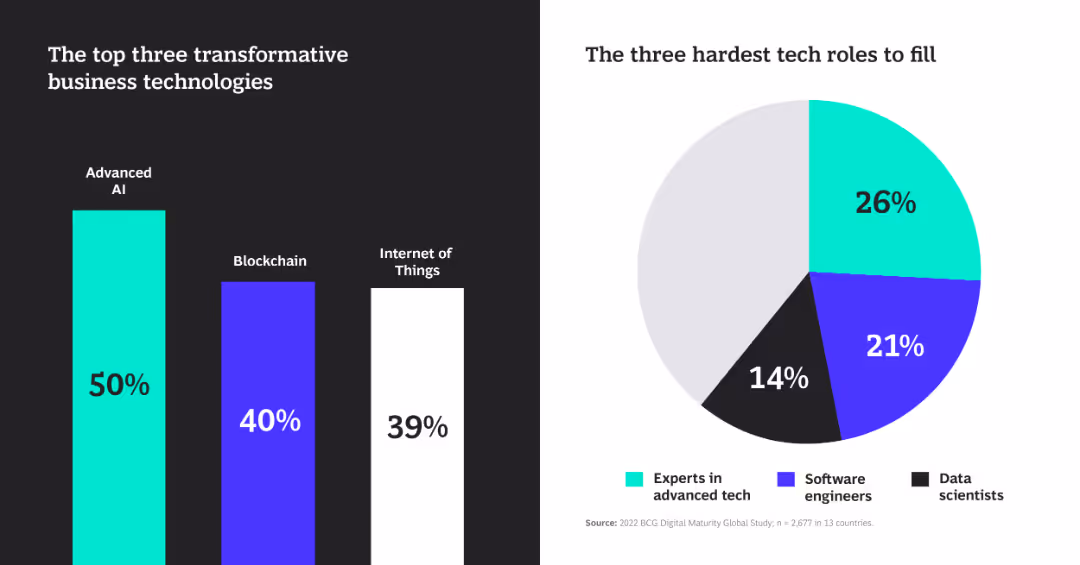
The slide includes a column chart and a pie chart. The column chart shows percentages for transformative technologies, and the pie chart shows hard-to-fill tech roles.
Technology and Digital Transformation
Technology & Software
The slide highlights advanced AI, blockchain, and IoT as top transformative technologies and shows tech roles that are hardest to fill.
AI, blockchain, IoT, technology, roles
false
Technology and Digital Transformation
Technology & Software technology-and-software
Multiple Chart
BCG
View slide
Features a stacked column chart representing the importance of AI to American companies' performance in 2023, supplemented by quotes from industry leaders about AI's impact.
Market Analysis and Trends
Technology & Software
Highlights the significant role of AI in enhancing company performance in the U.S., with insights from industry leaders on how AI is transforming business operations and strategy.
AI, business impact, American investors, technology, performance
false
Market Analysis and Trends
Technology & Software technology-and-software
Mixed Chart
Bain
View slide
The slide includes a pie chart and a quote, with a clean design focusing on the critical role of AI in business success. The pie chart is green, and the text is concise, making the data and quote stand out effectively.
Technology and Digital Transformation
Technology & Software
Discusses the importance of AI in business, noting that 94% of business leaders believe AI is crucial for success over the next five years. This slide is suitable for presentations on digital transformation and its impact on business growth.
AI, business success, digital transformation, business leaders, future planning, technology impact, enterprise
false
Technology and Digital Transformation
Technology & Software technology-and-software
Mixed Chart
Deloitte
View slide
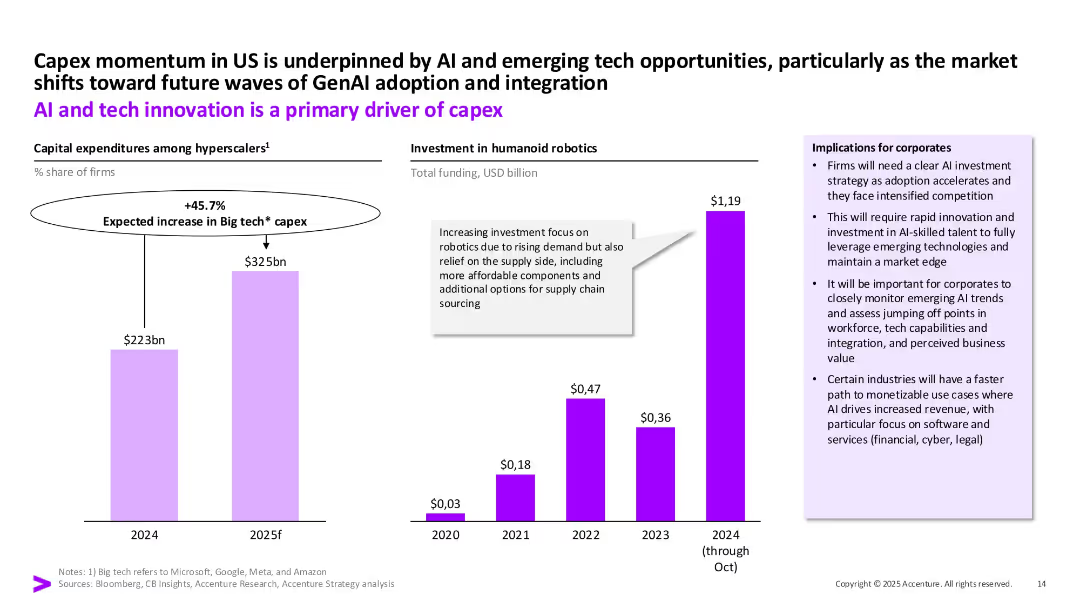
Two side-by-side bar charts (capital expenditures and humanoid robotics investment) with a highlighted box for implications and a callout balloon in center. Purple theme.
Strategic Planning
Technology & Software
This slide outlines how AI and emerging tech, particularly GenAI, are driving capital expenditures in the US. It shows a 45.7% increase in big tech capex and a rising trend in humanoid robotics investment, with corporate implications focused on AI readiness and strategy.
AI, capex, robotics, hyperscalers, investment, GenAI, strategy, innovation
false
Strategic Planning
Technology & Software technology-and-software
Multiple Chart
Accenture
View slide
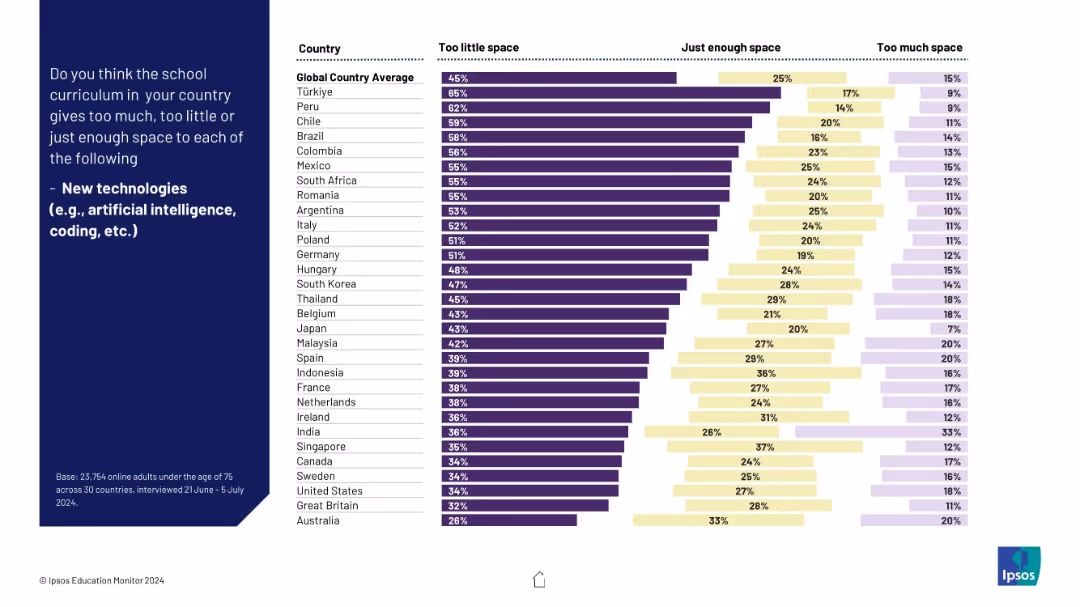
Bar chart with three horizontal sections per country; left-aligned titles; dark to light gradient color bars.
Market Analysis and Trends
Education & Training
The slide illustrates public sentiment about the inclusion of new technologies in school curricula. Many countries believe current curricula allocate too little space for topics like AI and coding, revealing a push for modernization.
AI, coding, curriculum, new tech, digital education, global education, Ipsos, education reform, country comparison, technology integration
false
Market Analysis and Trends
Education & Training education-and-training
Mixed Chart
IPSOS
View slide
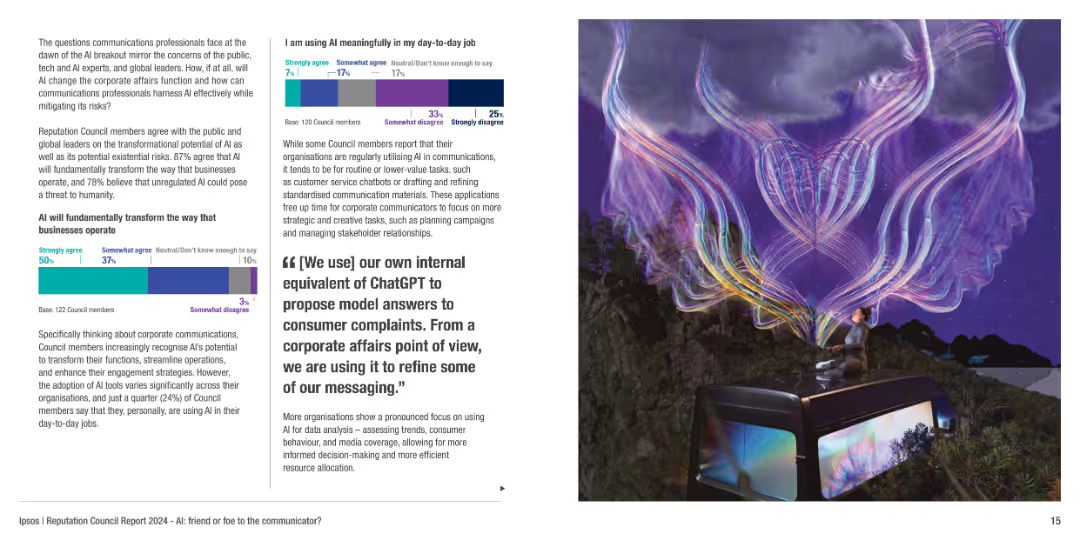
The slide includes a mixture of text, column charts, and a visually striking image depicting AI's impact on communication.
Technology and Digital Transformation
Technology & Software
Discusses the transformative potential of AI in corporate communications, its risks, and how organizations are adapting AI tools for efficiency and engagement.
AI, communication, technology impact, digital transformation, risks
false
Technology and Digital Transformation
Technology & Software technology-and-software
Multiple Chart
IPSOS
View slide
The slide includes two pie charts showing percentages and timelines representing early mover advantage in technology. It uses a minimalistic design with a black background and white and red text.
Market Analysis and Trends
Technology & Software
This slide presents data on how AI influences competition in business, emphasizing the advantages of being an early adopter in technological advancements.
AI, competition, technology, early adoption, business models
false
Market Analysis and Trends
Technology & Software technology-and-software
Multiple Chart
Bain
View slide
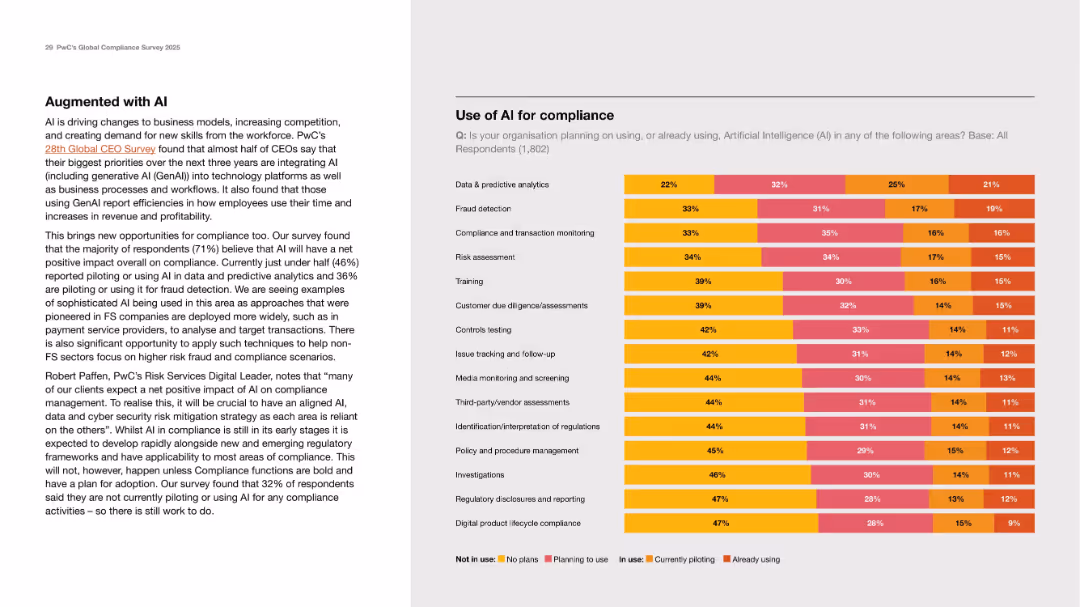
Two-column layout with descriptive text on left and multicolored horizontal stacked bar chart on right.
Technology and Digital Transformation
Artificial Intelligence
This slide explores how organizations are using or planning to use AI for compliance activities. It presents a chart showing the level of AI adoption across 15 areas such as fraud detection, training, and transaction monitoring. The text discusses how AI is expected to positively impact compliance, with 71% expecting a net benefit.
AI, compliance, predictive analytics, fraud detection, digital strategy
false
Technology and Digital Transformation
Artificial Intelligence artificial-intelligence
Mixed Chart
PwC/Strategy&
Previous
Loading...
Hold On!
We are searching in our database
If nothing, comes up, please try different filters!
Column Chart
Heatmap
Chevron
Org Chart
Infographic
Callouts
Timeline
List
Graphic
Picture
Process Flow
Diagram
Paragraph
Map
Table
Framework
Subtitle
Takeaway Box
Icon
Other Chart
Radar Chart
Waterfall Chart
Mekko Chart
Pie Chart
Scatter Plot
Line Chart
Bar chart
Bullet points
Create a FREE account to continue browsing
Receive Instant Access to 1,000+ slides from companies like McKinsey, Google, and Goldman Sachs
First Name
Last Name
Email
Password
I agree to all
Terms & Privacy Policy
Thank you! Your submission has been received!
Oops! Something went wrong while submitting the form.
Have an account?
Sign in
Upgrade to PRO to Save slides
Advanced Search and Filters
Access to 15,000+ slides
Access to Category Pages
Save/Bookmark Slides
PowerPoint Template Library
Pick a Plan
MONTHLY
$12/month
Billed every month, Cancel anytime.
YEARLY
$9/year
Billed $108 annually, Cancel anytime.
Checkout for $12/month
Checkout for $108/yr
Secured by Stripe | AES-256 bit encryption