My Account
My Slides
Search by Category
Templates
View All Templates
Download Template Slides
Leave Feedback
Login
Logout
Get Started
Browse all Slides
Browse all Slides
Create a FREE Account
Instant access to 1,000+ real slides from top companies like McKinsey, BCG, Goldman Sachs, Google and many more!
First Name
Last Name
Email
Password
I agree to all
Terms & Privacy Policy
Thank you! Your submission has been received!
Oops! Something went wrong while submitting the form.
Have an account?
Sign in
Spark Your Next Big Idea with New Presentation Templates
VIEW ALL Templates
Welcome,
Welcome
PRO
Show Featured Only
Checkbox 8
Companies
Mckinsey
Bain
BCG
EY
Deloitte
Accenture
PwC/Strategy&
JP Morgan
Goldman Sachs
Morgan Stanley
Citigroup
Deutsche Bank
Barclays
LEK
KPMG
Kearney
Oliver Wyman
Booz Allen Hamilton
Gartner
IPSOS
Nielsen
Slide type
Text Only
Linear Flow
Vertical Flow
Single Chart
Header Horizontal
Mixed Chart
Header Vertical
Pillar
Multiple Chart
Graphic
Agenda
Title
Table
Framework
Industry
Technology & Software
Artificial Intelligence
Financial Services
Retail & E-commerce
Consumer Goods
Industrial & Manufacturing
Transportation & Logistics
Telecommunications
Real Estate & Construction
Hospitality & Tourism
Professional Services
Education & Training
Media & Entertainment
Agriculture & Food Production
Healthcare & Pharmaceuticals
Environmental Services & Sustainability
Government & Public Sector
Use Case
Mergers and Acquisitions
Performance Metrics and KPIs
Client Case Studies
Competitive Landscape
Corporate Finance and Valuation
Product and Service Analysis
Customer and Market Segmentation
Organizational Structure and Change
Industry Overview
Regulatory and Compliance
Risk Assessment and Management
Investment Analysis
Organizational Structure and Change
Human Resources and Talent Management
Financial Performance
Market Analysis and Trends
Sales and Business Development
Human Resources and Talent Management
Clear all
Thank you! Your submission has been received!
Oops! Something went wrong while submitting the form.
Tag
View slide
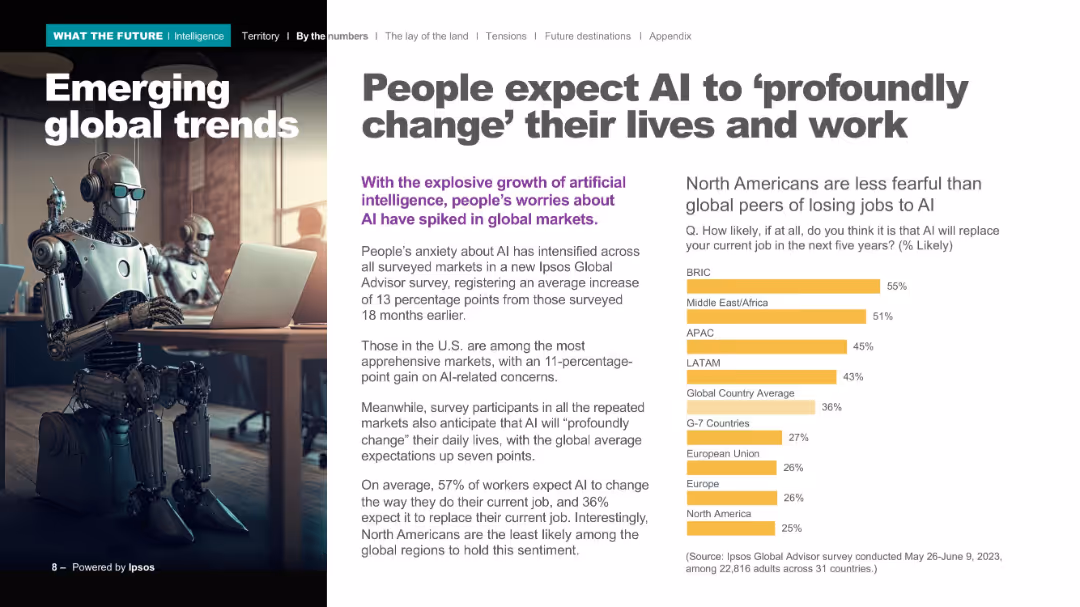
Full-page photo on left with humanoid robot, right side includes text block and yellow horizontal bar chart.
Market Analysis and Trends
Artificial Intelligence
Details global perspectives on AI’s impact on jobs and daily life. Emphasizes rising concern levels, with a breakdown of expected job displacement likelihood by region. North America is shown as least concerned compared to others.
AI transformation, job loss, global sentiment, Ipsos Global Advisor, survey, BRIC, regional trends
false
Market Analysis and Trends
Artificial Intelligence artificial-intelligence
Mixed Chart
IPSOS
View slide
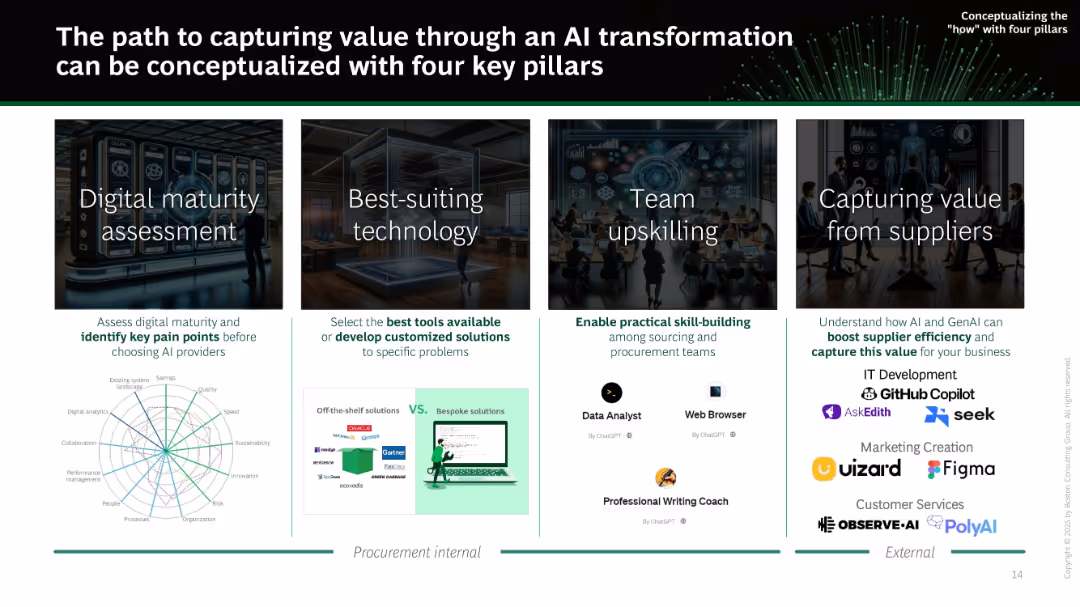
Four-column layout showing pillars: digital maturity, best-suiting tech, upskilling, and supplier value. Each pillar is supported with icons, example tools, and brief descriptions.
Strategic Planning
Technology & Software
Outlines the four pillars necessary for successful AI transformation in procurement: assessing digital maturity, selecting appropriate tools, upskilling teams, and capturing value from suppliers. Emphasizes internal and external approaches and integration of various AI tools.
AI transformation, maturity, tools, upskilling, procurement, suppliers, enablement, digital strategy
false
Strategic Planning
Technology & Software technology-and-software
Mixed Chart
BCG
View slide
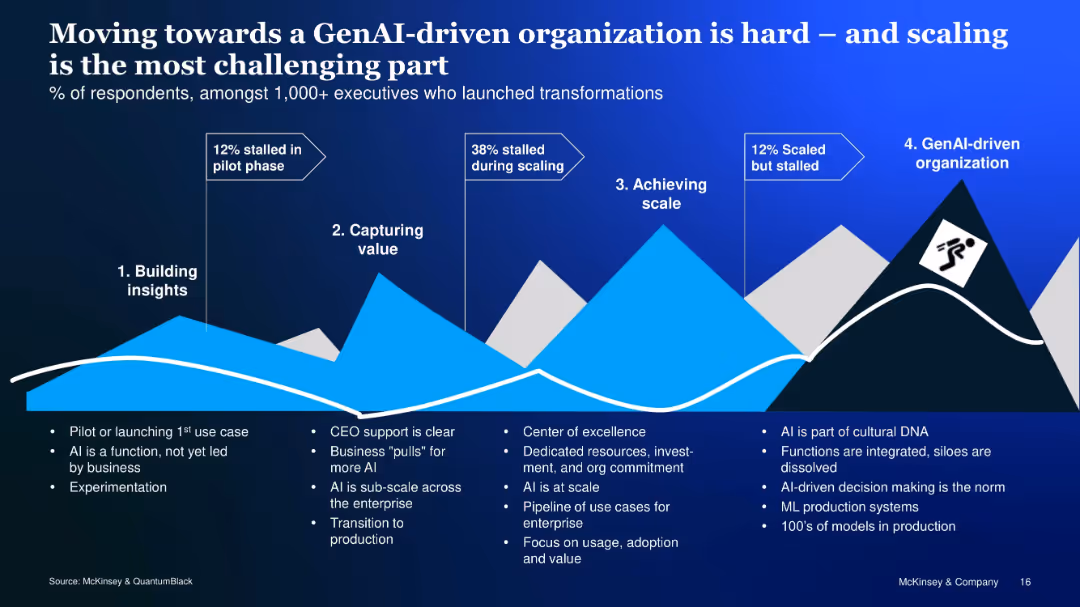
Mountain-like visual with 4-stage AI transformation journey and text explanations at each stage
Organizational Structure and Change
Artificial Intelligence
Outlines the challenges of progressing through GenAI transformation, identifying pain points at each phase—from piloting and value capture to scaling and cultural integration—with respondent data to highlight key barriers.
AI transformation, scaling, GenAI, organization, adoption, maturity
false
Organizational Structure and Change
Artificial Intelligence artificial-intelligence
Linear Flow
McKinsey
View slide
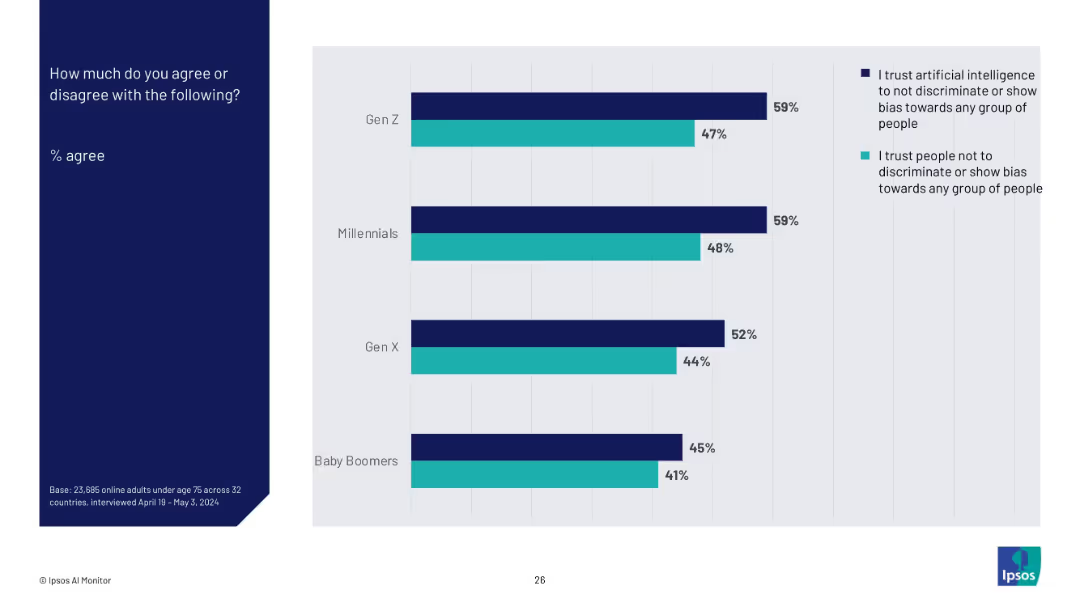
Horizontal bar chart comparing Gen Z, Millennials, Gen X, and Baby Boomers with two colored bars each (AI trust vs. people trust), on a light gray background. Left-aligned title in a dark blue block.
Market Analysis and Trends
Artificial Intelligence
This slide compares generational trust in artificial intelligence versus people regarding fairness and bias. Gen Z and Millennials show higher trust in AI over people, with trust levels gradually decreasing among older generations.
AI trust, generational comparison, bias perception, Ipsos, trust metrics, societal views, survey, discrimination, fairness, 2024 data
false
Market Analysis and Trends
Artificial Intelligence artificial-intelligence
Mixed Chart
IPSOS
View slide
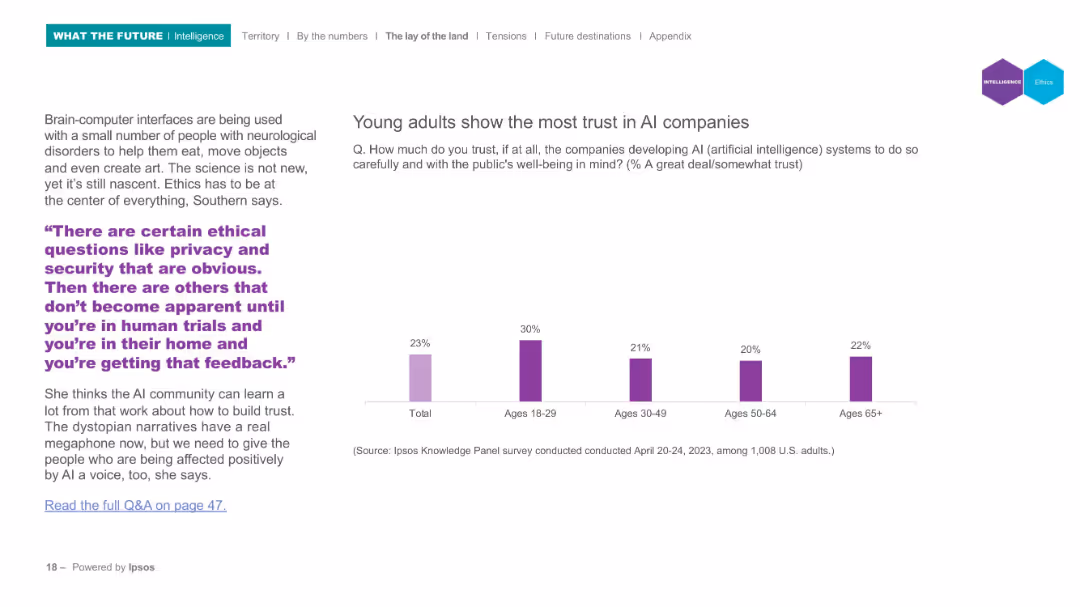
Bar chart comparing AI trust across age groups; left side features quote and ethics discussion; minimalistic design.
Regulatory and Compliance
Artificial Intelligence
Examines trust in AI companies across different age groups. Young adults (18–29) are shown to trust AI developers the most. Commentary includes ethical considerations surrounding privacy and feedback during AI-human interaction trials.
AI trust, generational comparison, ethics, transparency, Ipsos, public opinion, regulation
false
Regulatory and Compliance
Artificial Intelligence artificial-intelligence
Mixed Chart
IPSOS
View slide
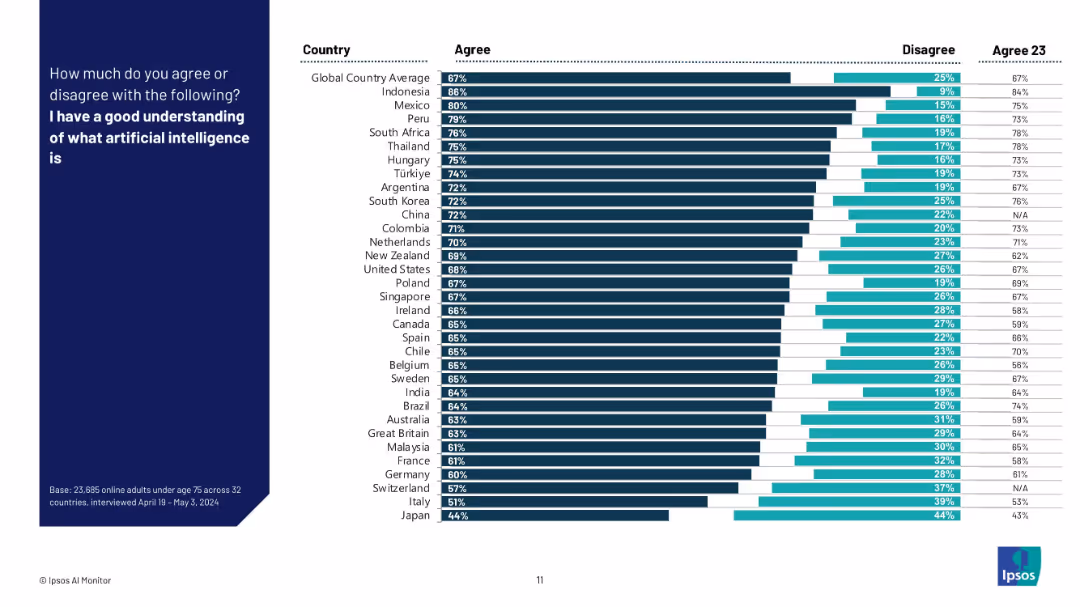
Horizontal bar chart with agree/disagree levels for "I have a good understanding of AI" by country.
Technology and Digital Transformation
Artificial Intelligence
This slide presents a ranked comparison of 32 countries on how strongly their populations agree with understanding what AI is. It includes both 2024 and 2023 comparison data for each country and shows shifts in public confidence.
AI understanding, global ranking, country comparison, Ipsos, AI awareness, survey results, confidence in AI, perception trends
false
Technology and Digital Transformation
Artificial Intelligence artificial-intelligence
Mixed Chart
IPSOS
View slide
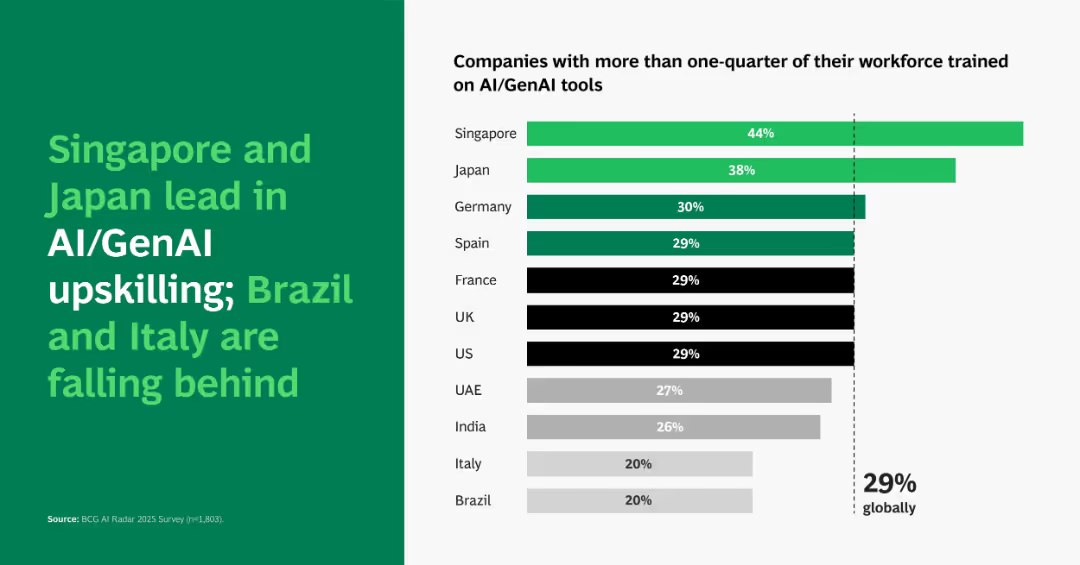
Horizontal bar chart ranking countries by % of workforce trained (>25%) on AI/GenAI tools, with global average marked.
Performance Metrics and KPIs
Artificial Intelligence
Highlights a country-level breakdown of AI training progress, showing Singapore (44%) and Japan (38%) as leaders. Brazil and Italy trail at 20%, under the global average. Shows disparities in AI preparedness by region.
AI upskilling, country comparison, GenAI tools, workforce training
false
Performance Metrics and KPIs
Artificial Intelligence artificial-intelligence
Single Chart
BCG
View slide
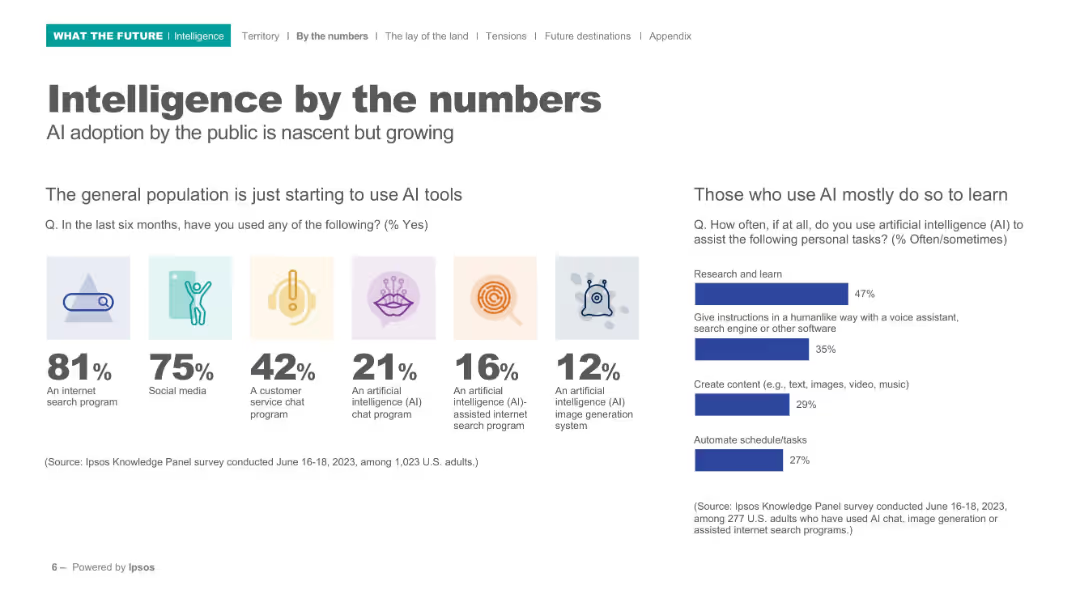
Split layout with icons, bold percentages, and bar charts; clean white background; left section shows icon-based usage stats, right shows bar chart.
Technology and Digital Transformation
Artificial Intelligence
Highlights early adoption trends in AI usage among the general population. Shows top tools used (e.g., search, chat, image generation), and indicates that AI is mostly used for learning. Includes survey data and clear icons to enhance understanding.
AI usage, internet tools, public adoption, learning, survey, Ipsos, image generation, chatbot, statistics, behavior
false
Technology and Digital Transformation
Artificial Intelligence artificial-intelligence
Mixed Chart
IPSOS
View slide
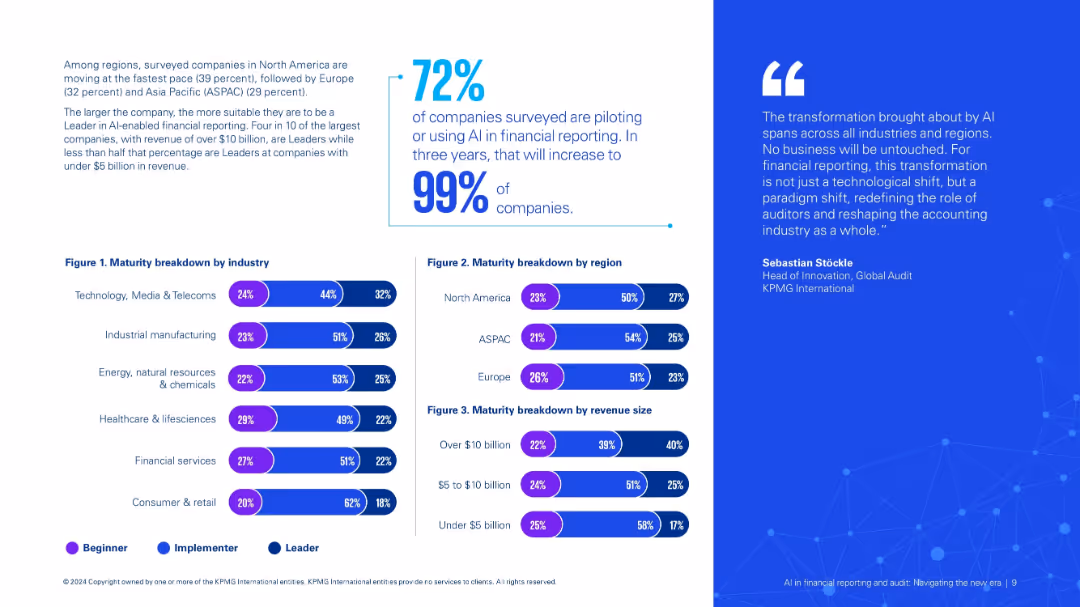
Split layout: left side text/statistics, right side quote; bottom contains horizontal stacked bar charts by industry, region, and revenue.
Technology and Digital Transformation
Financial Services
Analyzes AI usage maturity across industries, regions, and revenue groups. Shows current progress and forecasts growth. Emphasizes that larger firms tend to lead in AI adoption and transformation.
AI usage, maturity breakdown, financial reporting, regional trends, enterprise adoption
false
Technology and Digital Transformation
Financial Services financial-services
Mixed Chart
KPMG
View slide
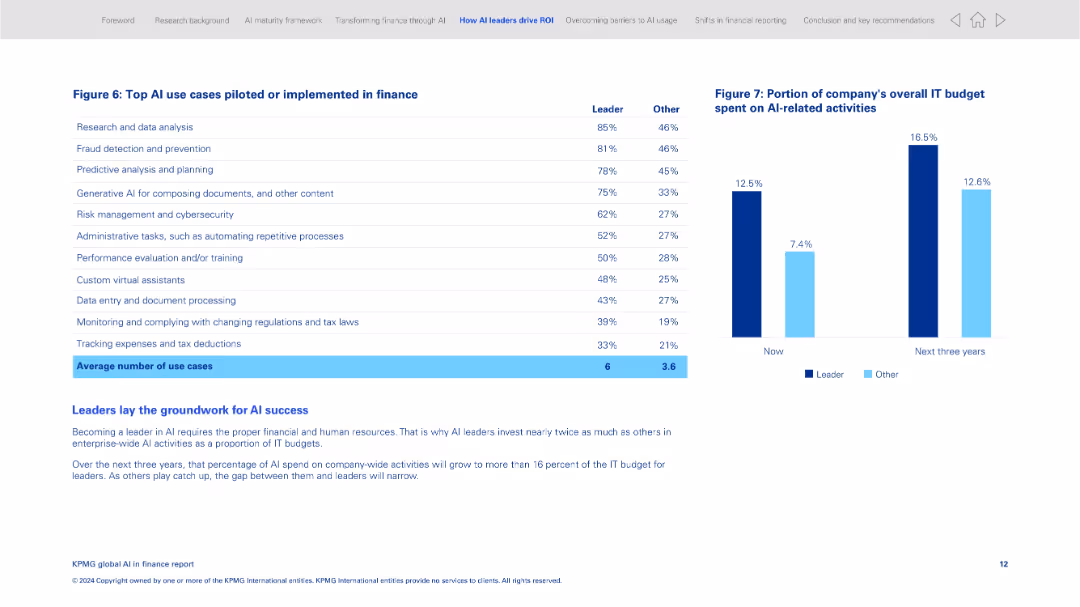
Two-panel layout with a data table on the left and a bar chart on the right; clean and grid-aligned
Product and Service Analysis
Financial Services
This slide lists the most common AI use cases implemented in finance, including research, fraud detection, and document processing. It compares leaders and other organizations in adoption levels and shows IT budget allocation to AI activities now and projected in 3 years.
AI use cases, finance operations, AI leaders, IT budget, fraud detection, predictive planning, automation, investment
false
Product and Service Analysis
Financial Services financial-services
Mixed Chart
KPMG
View slide
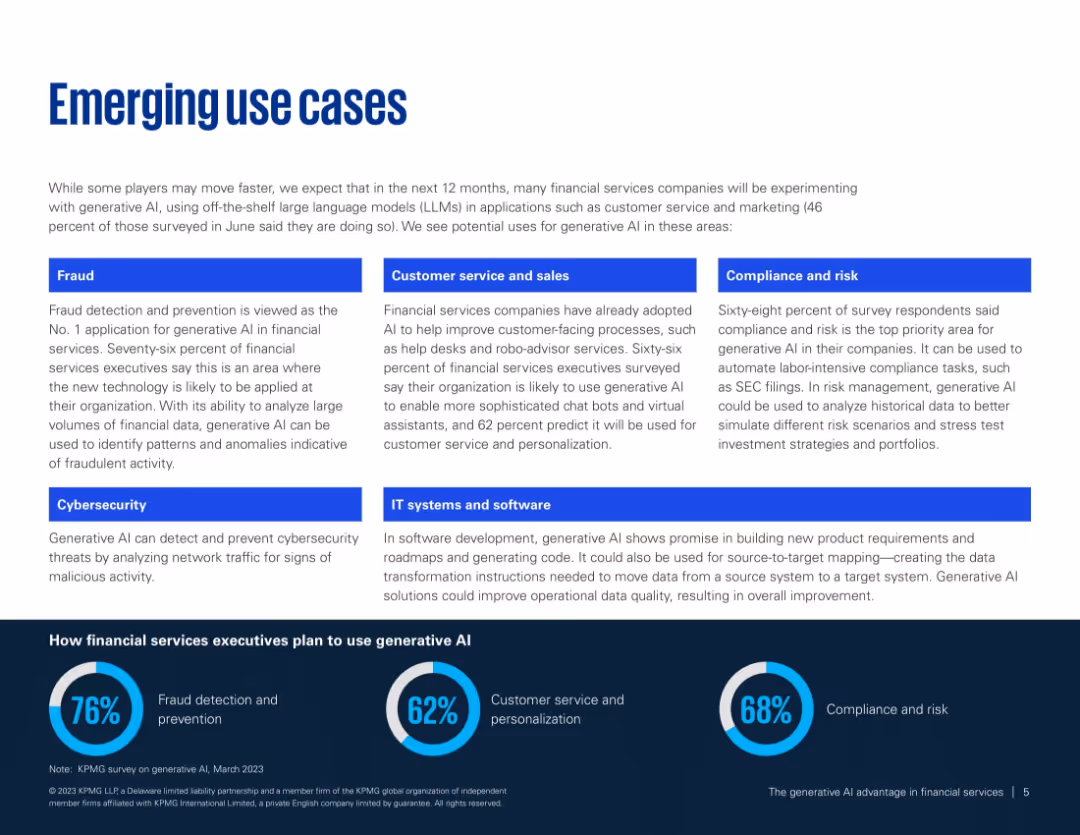
Two-column layout with blue category labels and short paragraphs per use case; footer shows usage statistics.
Product and Service Analysis
Financial Services
Outlines key generative AI use cases in financial services such as fraud detection, customer service, compliance, and IT systems. Supports findings with survey data on AI implementation intentions and perceived value areas.
AI use cases, fraud detection, compliance, customer service, IT transformation, financial tech
false
Product and Service Analysis
Financial Services financial-services
Mixed Chart
KPMG
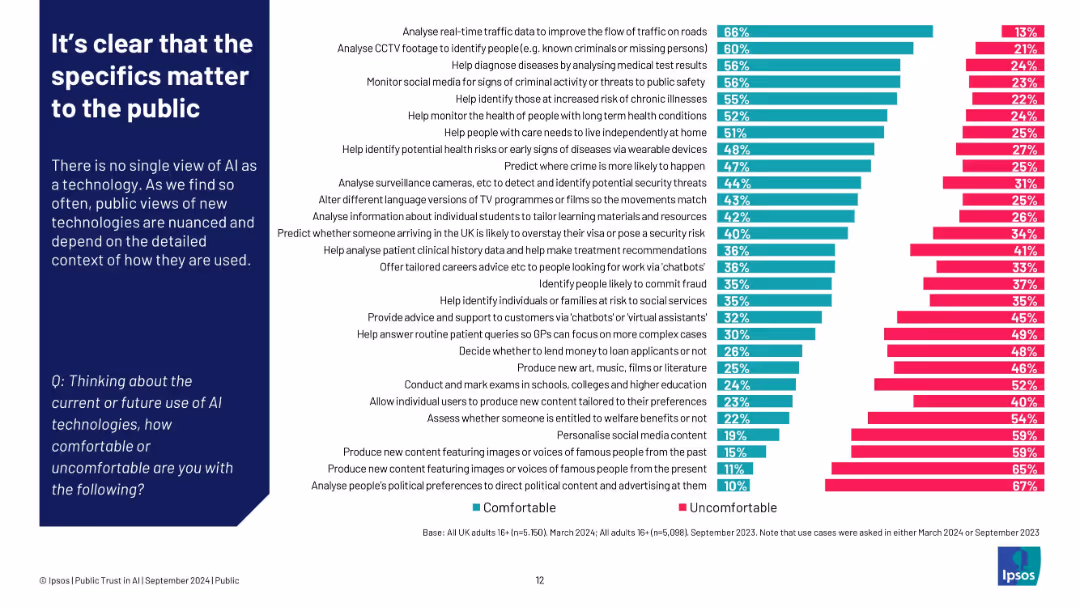
View slide
Left: paragraph explaining context dependence; right: bar chart ranking comfort vs discomfort by use case
Customer and Market Segmentation
Artificial Intelligence
Public comfort with AI varies greatly depending on its application. People feel most comfortable when AI supports societal needs (e.g., traffic, healthcare), but uncomfortable with tasks involving content creation, surveillance, or political manipulation.
AI use cases, public comfort, Ipsos, detailed context, segmentation, content creation, healthcare
false
Customer and Market Segmentation
Artificial Intelligence artificial-intelligence
Single Chart
IPSOS
View slide
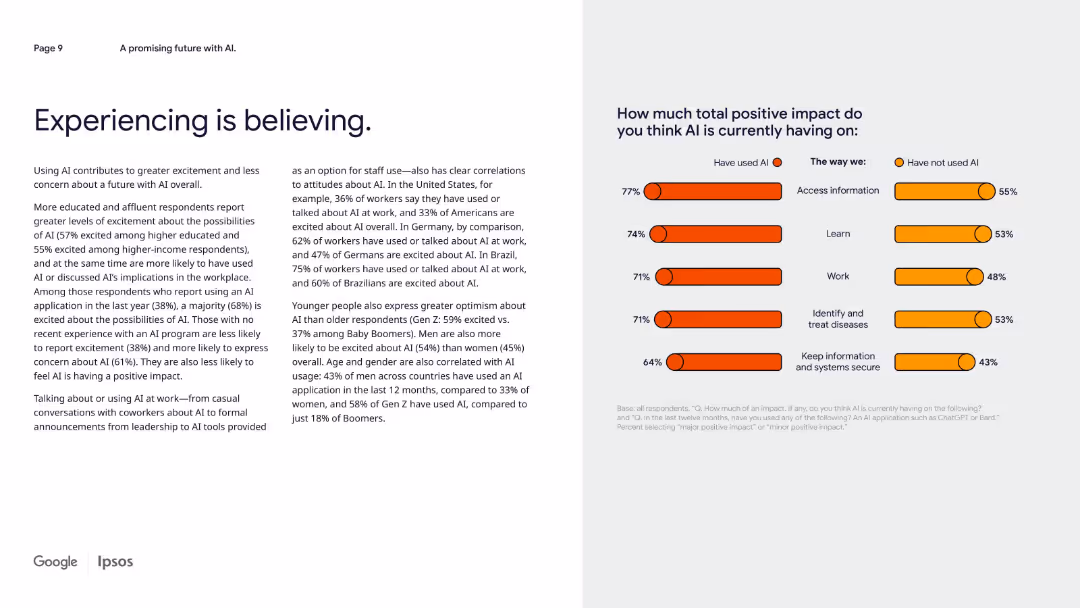
Two-column format with dense text on left and horizontal bar comparison on right (AI users vs non-users).
Performance Metrics and KPIs
Artificial Intelligence
This slide shows that people who use AI are more optimistic about its benefits. AI users report higher perceived positive impact across domains like learning, working, and health, suggesting familiarity drives confidence.
AI user sentiment, usage impact, adoption effects, perception difference, learning, trust
false
Performance Metrics and KPIs
Artificial Intelligence artificial-intelligence
Mixed Chart
IPSOS
View slide
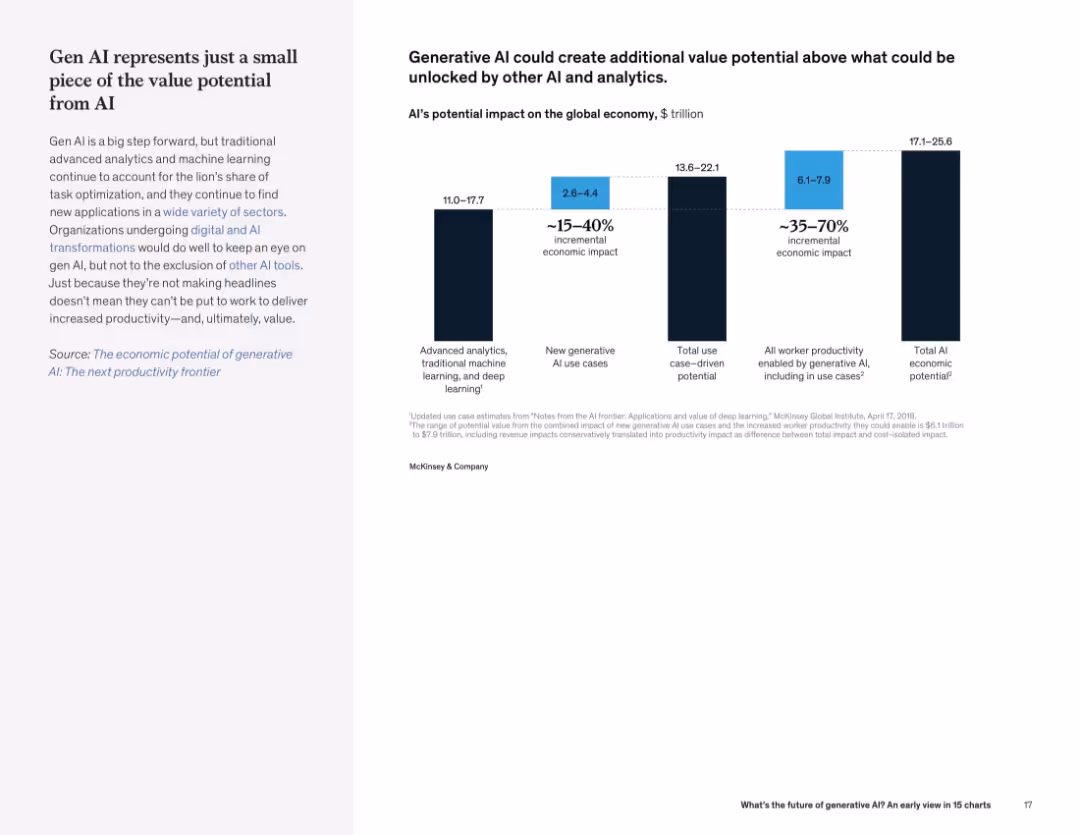
Left text description with bar chart on right showing estimated economic value from various AI categories, including gen AI.
Investment Analysis
Artificial Intelligence
Generative AI, while impactful, is part of a larger AI ecosystem. Traditional AI methods still contribute the majority of economic value. The slide quantifies the incremental and total economic potential.
AI value, economic impact, generative AI, analytics, investment potential, productivity
false
Investment Analysis
Artificial Intelligence artificial-intelligence
Mixed Chart
McKinsey
View slide
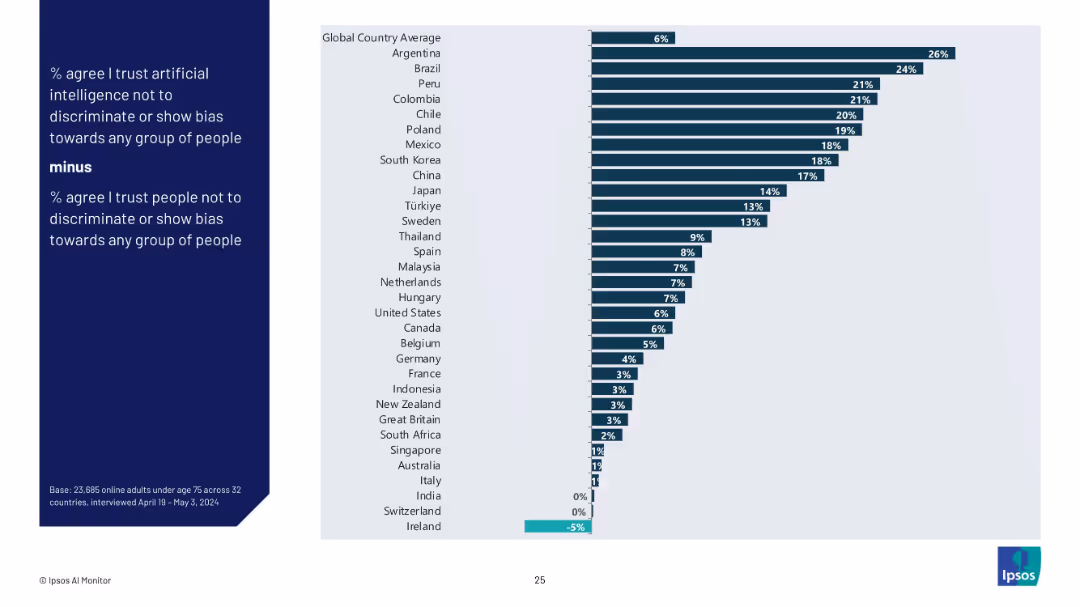
Bar chart showing difference between trust in AI vs trust in people for fairness by country (% AI trust minus % people trust).
Regulatory and Compliance
Artificial Intelligence
This slide visualizes the delta between trust in AI and trust in people to avoid bias, illustrating where AI is perceived as more or less fair than humans. Positive values favor AI; negative values favor people.
AI vs human trust, discrimination, bias perception, fairness, Ipsos, public opinion, country gap, ethical AI
false
Regulatory and Compliance
Artificial Intelligence artificial-intelligence
Mixed Chart
IPSOS
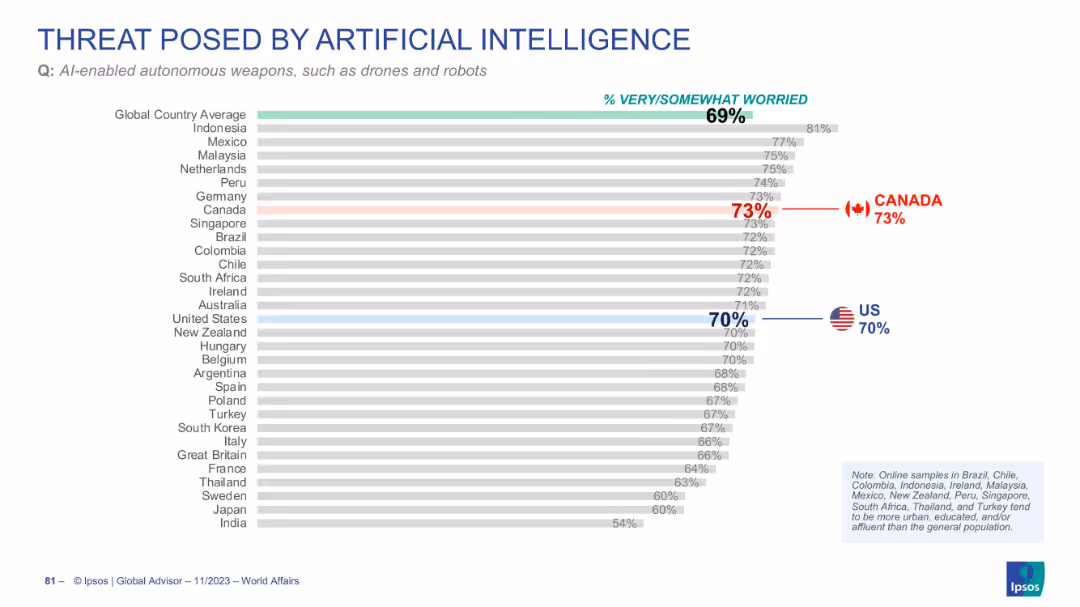
View slide
Horizontal bar chart ranking countries by concern over AI-enabled autonomous weapons
Risk Assessment and Management
Artificial Intelligence
This slide shows the percentage of people who are concerned about AI-powered weapons. Canada (73%) and the US (70%) are slightly above the global average (69%) in their concern.
AI weapons, drones, public concern, global comparison, military AI, Ipsos
false
Risk Assessment and Management
Artificial Intelligence artificial-intelligence
Single Chart
IPSOS
View slide
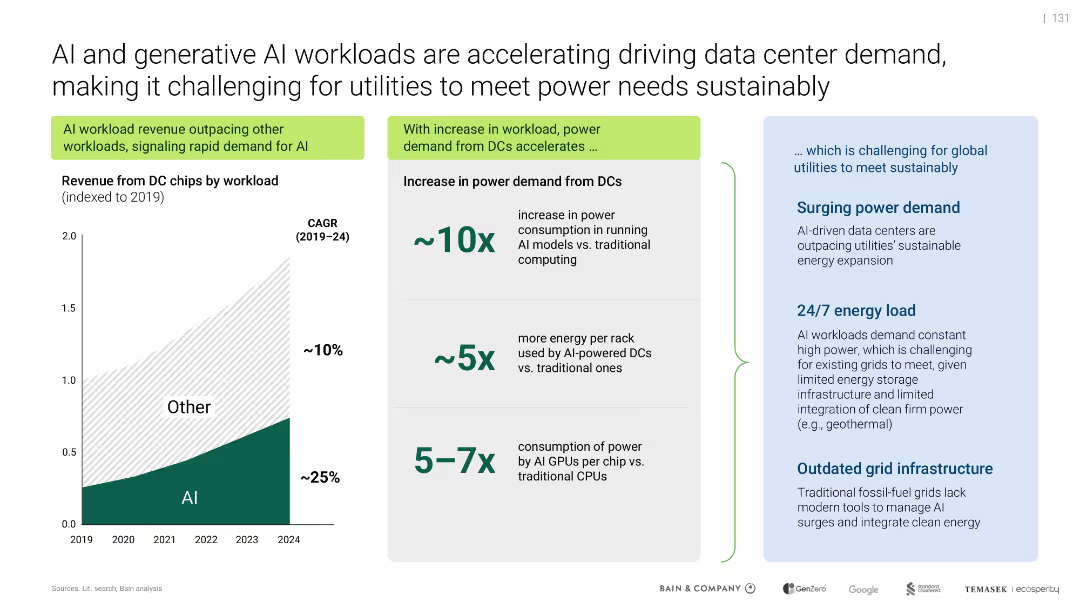
Split layout: left-side line chart on AI chip revenue; right-side infographic of power consumption increases; blue highlight box outlines utility challenges.
Operational Efficiency
Artificial Intelligence
Shows exponential growth in AI workloads, causing power demand to surge (10x more than traditional). Highlights strain on global utilities and grid systems due to constant AI processing and outdated infrastructure.
AI workload, power demand, utilities, grid, GPUs, sustainability
false
Operational Efficiency
Artificial Intelligence artificial-intelligence
Mixed Chart
Bain
View slide
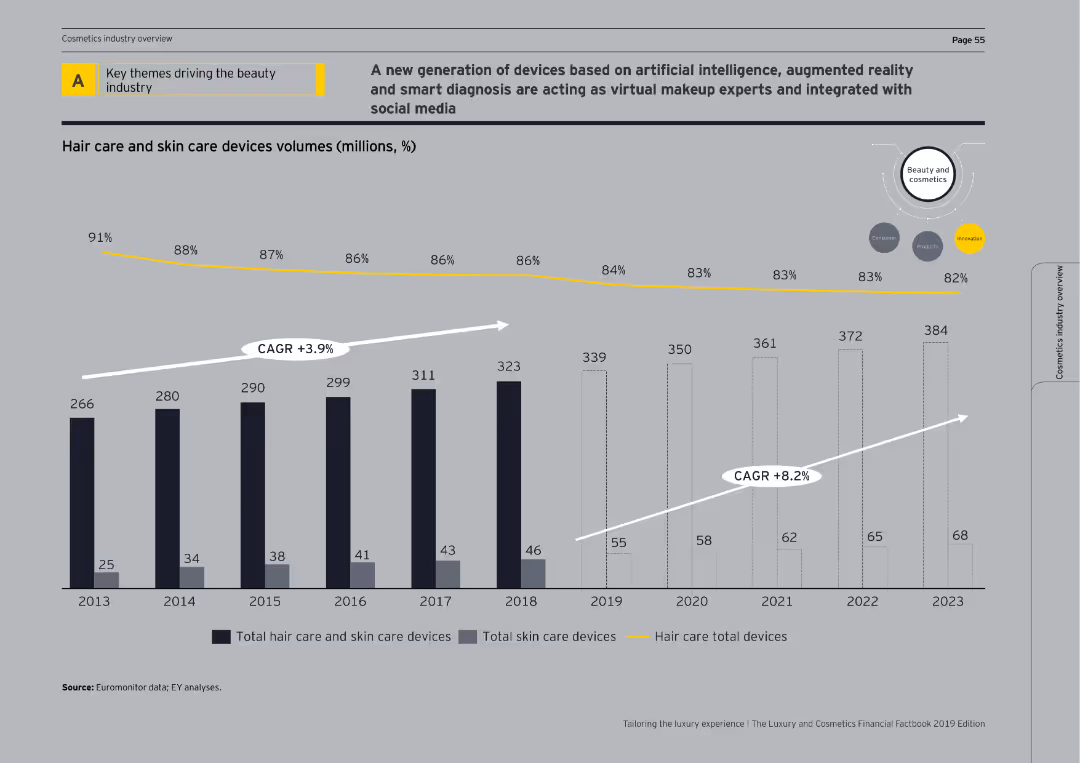
This slide features a column chart showing the volume of hair care and skin care devices from 2013 to 2023. Annotations indicate CAGR for total skin care and hair care total devices.
Market Analysis and Trends
Consumer Goods
The slide highlights the trends in the beauty industry focusing on the adoption of AI, AR, and social media integration in virtual makeup and smart diagnosis devices.
AI, AR, beauty industry, market trends, CAGR
false
Market Analysis and Trends
Consumer Goods consumer-goods
Single Chart
EY
View slide
The slide displays a diagram contrasting the current and future state of AI at Morgan Stanley, with icons representing AI tools and their integration into advisor-client interactions.
Technology and Digital Transformation
Technology & Software
The slide highlights Morgan Stanley's leadership in AI, showcasing current tools like AI@MS Assistant and future state interactions to enhance advisor-client experiences.
AI, Artificial Intelligence, Morgan Stanley, Technology Integration, Advisor Tools, Client Interaction, Diagram, Innovation
false
Technology and Digital Transformation
Technology & Software technology-and-software
Diagram
Morgan Stanley
View slide
Five icons representing different factors such as 'Technical feasibility', 'Cost of labor', and 'Regulatory and social factors', each with a descriptive subheading and arranged in a clean, circular layout.
Strategic Planning
Technology & Software
Outlines the major factors that influence the pace and extent of AI and automation adoption in industries, discussing technical, economic, and regulatory considerations.
AI, Automation, Factors, Adoption, Industry
false
Strategic Planning
Technology & Software technology-and-software
Pillar
McKinsey
View slide
Two comparative charts showing AI-enabled consumer intelligence platforms and marketing measurement and optimization solutions. One is in green shades, the other in blue.
Market Analysis and Trends
Technology & Software
This slide compares leading AI-enabled solutions in consumer intelligence and marketing measurement. It highlights strong performers and leaders in the market.
AI, Consumer Intelligence, Marketing, Optimization, Trends
false
Market Analysis and Trends
Technology & Software technology-and-software
Multiple Chart
IPSOS
View slide
Diagram highlighting AI's entrance into the creative industries, with examples from performing, literary, media, and visual arts.
Market Analysis and Trends
Media & Entertainment
The slide explores how AI has been successfully integrated into creative fields, providing examples of AI-generated works in music, art, literature, and media. It highlights the diverse applications of AI in the creative realm, showcasing its potential to innovate and transform traditional artistic processes.
AI, Creative Industries, Music, Art
false
Market Analysis and Trends
Media & Entertainment media-and-entertainment
Framework
Roland Berger
View slide
Bar chart showing the number of AI players by country and column charts comparing the revealed comparative advantage of leading geographic areas for various AI domains.
Technology and Digital Transformation
Technology & Software
This slide emphasizes the importance of data in optimizing artificial intelligence and presents data on the number of AI players by country. It compares the strengths of different regions in AI domains like natural language processing and machine learning, highlighting the global competition in AI development.
AI, Data Optimization, Geographic Advantage, AI Players
false
Technology and Digital Transformation
Technology & Software technology-and-software
Multiple Chart
Roland Berger
View slide
The slide features two sections: "Automated Buying" on the left with an icon of a smart fridge and text, and "Interactive Shelves" on the right with a photo of a woman interacting with a screen. Both sections have trend assessment bars indicating "Prepare" and "Watch" with impact on industry and time of mainstream adoption.
Technology and Digital Transformation
Technology & Software
Describes the concepts of automated buying and interactive shelves in the context of AI and data era, highlighting how these technologies can improve shopping experiences and customer retention. The slide also includes trend assessments and industry impact projections.
AI, Data, Retail, Technology, Innovation
false
Technology and Digital Transformation
Technology & Software technology-and-software
Multiple Chart
Deloitte
View slide
Features a line graph projecting economic growth under different AI adoption scenarios against a baseline. The graph is color-coded to distinguish between aggressive, cautious, and people-centric adoption scenarios, showing potential gains in trillions of dollars.
Strategic Planning
Technology & Software
Outlines the economic potential of adopting AI responsibly, highlighting different scenarios and their impact on economic growth.
AI, Economy, Growth, Adoption Scenarios, Potential, Trillions, Impact, Responsible, Technology
false
Strategic Planning
Technology & Software technology-and-software
Single Chart
Accenture
View slide
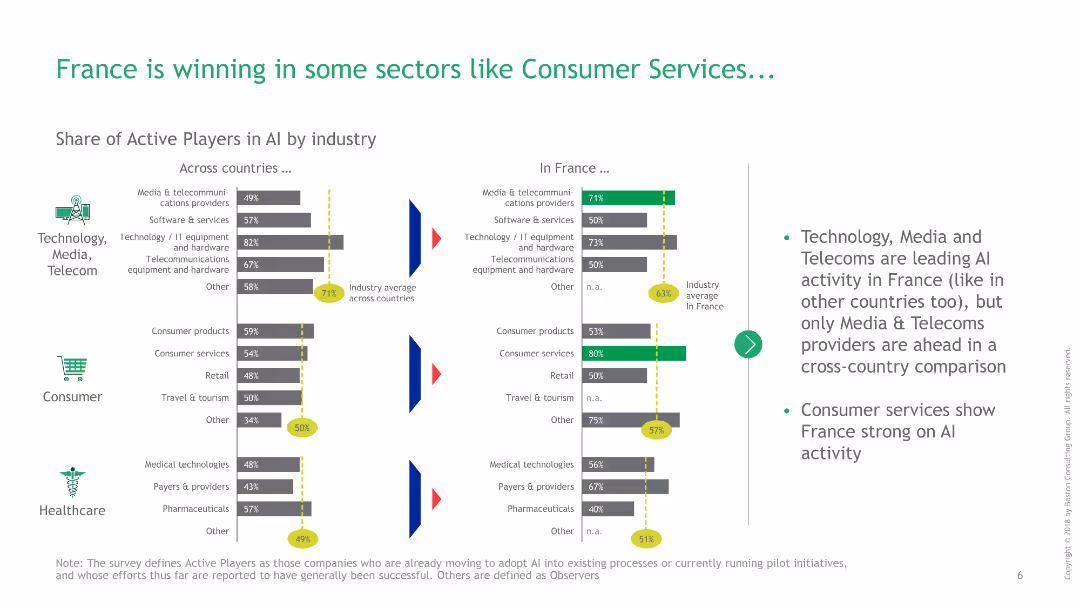
Bar charts comparing the share of active AI players across different industries between France and other countries, with detailed annotations.
Market Analysis and Trends
Technology & Software
This slide compares the share of active AI players in various sectors between France and other countries, highlighting France's strengths in AI.
AI, France, consumer services, technology, comparison, active players, sectors, bar charts, annotations, industry average
false
Market Analysis and Trends
Technology & Software technology-and-software
Multiple Chart
BCG
View slide
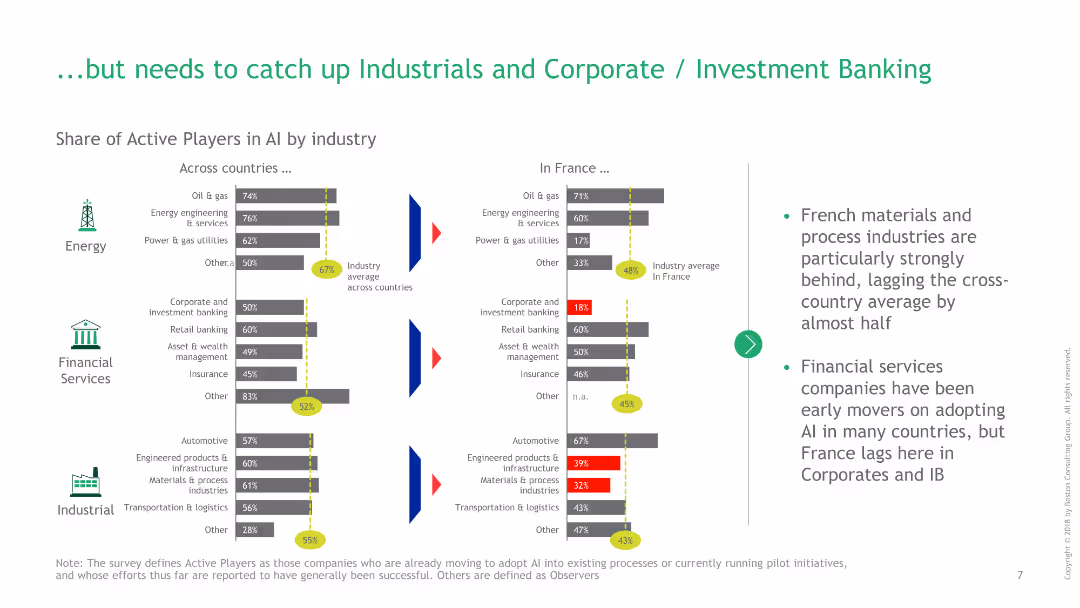
Bar charts showing the share of active AI players in energy, financial services, and industrial sectors between France and other countries.
Competitive Landscape
Financial Services
This slide highlights areas where France lags in AI adoption, particularly in industrial and corporate banking sectors, compared to other countries.
AI, France, financial services, industrial, investment banking, energy, comparison, active players, bar charts, industry average
false
Competitive Landscape
Financial Services financial-services
Multiple Chart
BCG
View slide
Four-column layout describing possible future applications of AI by 2030, 2035, 2040, and 2050 in areas like healthcare, trust and governance, sustainable business, and service innovation.
Technology and Digital Transformation
Technology & Software
The slide explores the transformative potential of AI across various sectors, outlining future applications from 2030 to 2050. It discusses the impact of AI on healthcare, trust and governance, sustainable business practices, and service innovation, emphasizing how AI could fundamentally change these areas.
AI, Future Applications, Healthcare, Governance
false
Technology and Digital Transformation
Technology & Software technology-and-software
Linear Flow
Roland Berger
View slide
Key statistics related to AI/Gen-AI impacts in the banking sector, including CAGR, adoption rates, and revenue generation. Simple layout with text and icons.
Technology and Digital Transformation
Financial Services
Summarizes key figures on AI and Gen-AI in banking, highlighting adoption rates, revenue impact, and productivity improvements.
AI, Gen-AI, banking, adoption, revenue
false
Technology and Digital Transformation
Financial Services financial-services
Header Horizontal
Kearney
Previous
Loading...
Hold On!
We are searching in our database
If nothing, comes up, please try different filters!
Column Chart
Heatmap
Chevron
Org Chart
Infographic
Callouts
Timeline
List
Graphic
Picture
Process Flow
Diagram
Paragraph
Map
Table
Framework
Subtitle
Takeaway Box
Icon
Other Chart
Radar Chart
Waterfall Chart
Mekko Chart
Pie Chart
Scatter Plot
Line Chart
Bar chart
Bullet points
Create a FREE account to continue browsing
Receive Instant Access to 1,000+ slides from companies like McKinsey, Google, and Goldman Sachs
First Name
Last Name
Email
Password
I agree to all
Terms & Privacy Policy
Thank you! Your submission has been received!
Oops! Something went wrong while submitting the form.
Have an account?
Sign in
Upgrade to PRO to Save slides
Advanced Search and Filters
Access to 15,000+ slides
Access to Category Pages
Save/Bookmark Slides
PowerPoint Template Library
Pick a Plan
MONTHLY
$12/month
Billed every month, Cancel anytime.
YEARLY
$9/year
Billed $108 annually, Cancel anytime.
Checkout for $12/month
Checkout for $108/yr
Secured by Stripe | AES-256 bit encryption