My Account
My Slides
Search by Category
Templates
View All Templates
Download Template Slides
Leave Feedback
Login
Logout
Get Started
Browse all Slides
Browse all Slides
Create a FREE Account
Instant access to 1,000+ real slides from top companies like McKinsey, BCG, Goldman Sachs, Google and many more!
First Name
Last Name
Email
Password
I agree to all
Terms & Privacy Policy
Thank you! Your submission has been received!
Oops! Something went wrong while submitting the form.
Have an account?
Sign in
Spark Your Next Big Idea with New Presentation Templates
VIEW ALL Templates
Welcome,
Welcome
PRO
Show Featured Only
Checkbox 8
Companies
Mckinsey
Bain
BCG
EY
Deloitte
Accenture
PwC/Strategy&
JP Morgan
Goldman Sachs
Morgan Stanley
Citigroup
Deutsche Bank
Barclays
LEK
KPMG
Kearney
Oliver Wyman
Booz Allen Hamilton
Gartner
IPSOS
Nielsen
Slide type
Text Only
Linear Flow
Vertical Flow
Single Chart
Header Horizontal
Mixed Chart
Header Vertical
Pillar
Multiple Chart
Graphic
Agenda
Title
Table
Framework
Industry
Technology & Software
Artificial Intelligence
Financial Services
Retail & E-commerce
Consumer Goods
Industrial & Manufacturing
Transportation & Logistics
Telecommunications
Real Estate & Construction
Hospitality & Tourism
Professional Services
Education & Training
Media & Entertainment
Agriculture & Food Production
Healthcare & Pharmaceuticals
Environmental Services & Sustainability
Government & Public Sector
Use Case
Mergers and Acquisitions
Performance Metrics and KPIs
Client Case Studies
Competitive Landscape
Corporate Finance and Valuation
Product and Service Analysis
Customer and Market Segmentation
Organizational Structure and Change
Industry Overview
Regulatory and Compliance
Risk Assessment and Management
Investment Analysis
Organizational Structure and Change
Human Resources and Talent Management
Financial Performance
Market Analysis and Trends
Sales and Business Development
Human Resources and Talent Management
Clear all
Thank you! Your submission has been received!
Oops! Something went wrong while submitting the form.
Tag
View slide
Features a line chart on battery price outlook and images of various battery types.
Financial Performance
Energy & Utilities
Details the expected decline in EV battery costs and market predictions up to 2030.
EV, battery cost, market forecast, lithium-ion, price decline
false
Financial Performance
Energy & Utilities energy-and-utilities
Mixed Chart
PwC/Strategy&
View slide
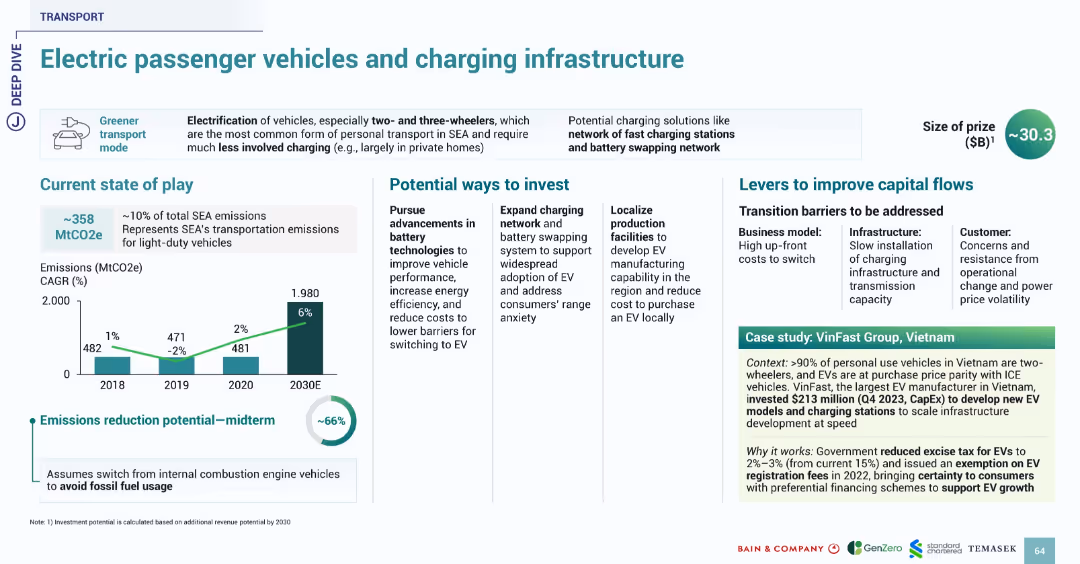
Uses familiar slide format with sections on current state, investment, barriers, and case study. Bright icons and data visualization maintain consistent transport theme.
Technology and Digital Transformation
Transportation & Logistics
Highlights the opportunity in electric passenger vehicles and associated charging infrastructure in SEA, which contributes 10% to SEA emissions. Suggests up to 66% reduction potential with a shift from fossil fuel vehicles. VinFast’s $213M investment in Vietnam illustrates local EV production and policy support. Government incentives like excise tax reduction and fee exemption are noted.
EV, charging, transport, SEA, emissions, VinFast, Vietnam, infrastructure, battery
false
Technology and Digital Transformation
Transportation & Logistics transportation-and-logistics
Multiple Chart
Bain
View slide
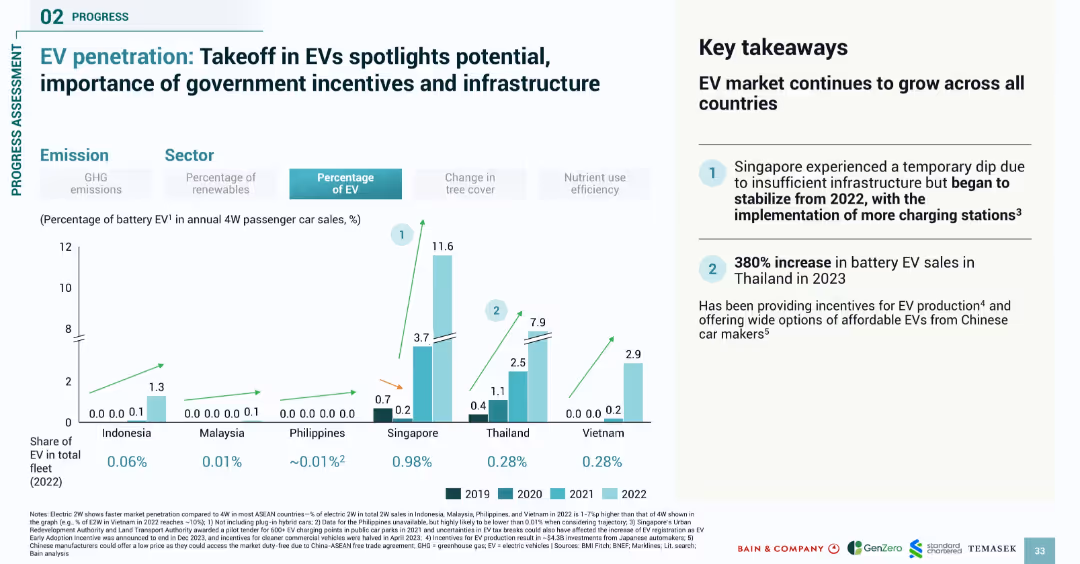
Bar chart comparing EV adoption from 2019 to 2022; right-side summary box with key findings
Market Analysis and Trends
Transportation & Logistics
Analyzes electric vehicle (EV) penetration across SEA countries from 2019–2022, revealing growth in EV sales, particularly in Singapore and Thailand. Highlights government incentives and infrastructure as critical drivers of EV market expansion.
EV, electric vehicles, SEA, adoption trends, incentives, infrastructure, passenger cars
false
Market Analysis and Trends
Transportation & Logistics transportation-and-logistics
Mixed Chart
Bain
View slide
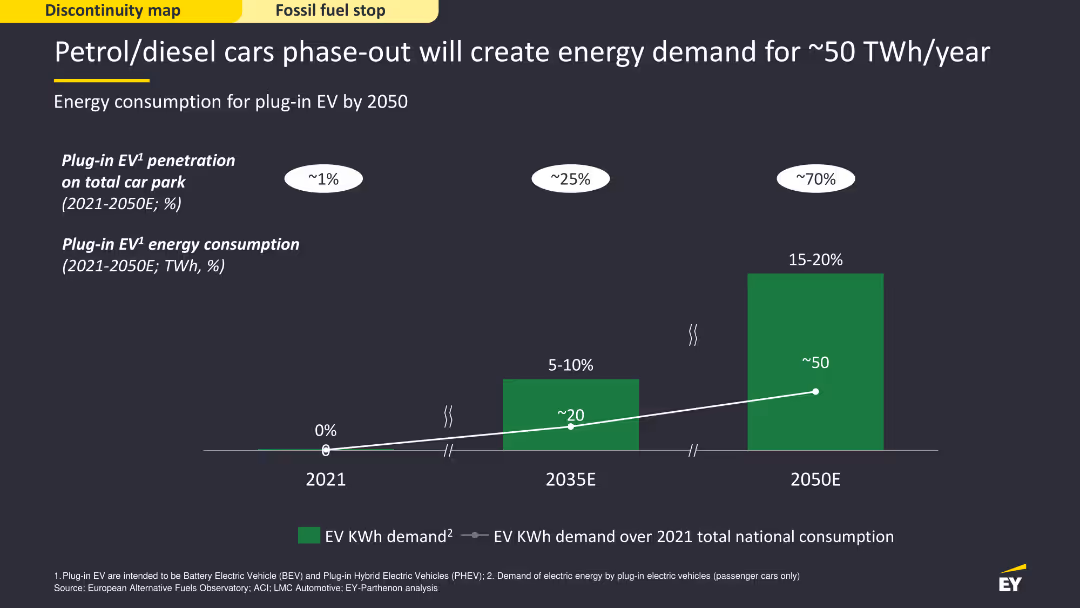
The slide features a column chart showing the projected energy consumption for plug-in electric vehicles (EV) from 2021 to 2050. The chart uses green bars and a dark background to display data clearly, with projections marked for significant future years. The layout is visually simple but informative, focusing on the energy demand increase.
Strategic Planning
Energy & Utilities
The slide forecasts the energy demand created by phasing out petrol/diesel cars, projecting the consumption for plug-in EVs up to 2050. It shows how EV penetration will grow, leading to a significant rise in energy requirements, emphasizing the need for strategic energy planning to accommodate this shift.
EV, energy demand, petrol, diesel, phase-out
false
Strategic Planning
Energy & Utilities energy-and-utilities
Single Chart
EY
View slide
Includes a bar chart comparing EV and ICE performance across temperatures.
Operational Efficiency
Transportation & Logistics
Discusses how different cell types and vehicle configurations impact EV performance.
EV, performance challenges, temperature, cell types, vehicle configuration
false
Operational Efficiency
Transportation & Logistics transportation-and-logistics
Mixed Chart
PwC/Strategy&
View slide
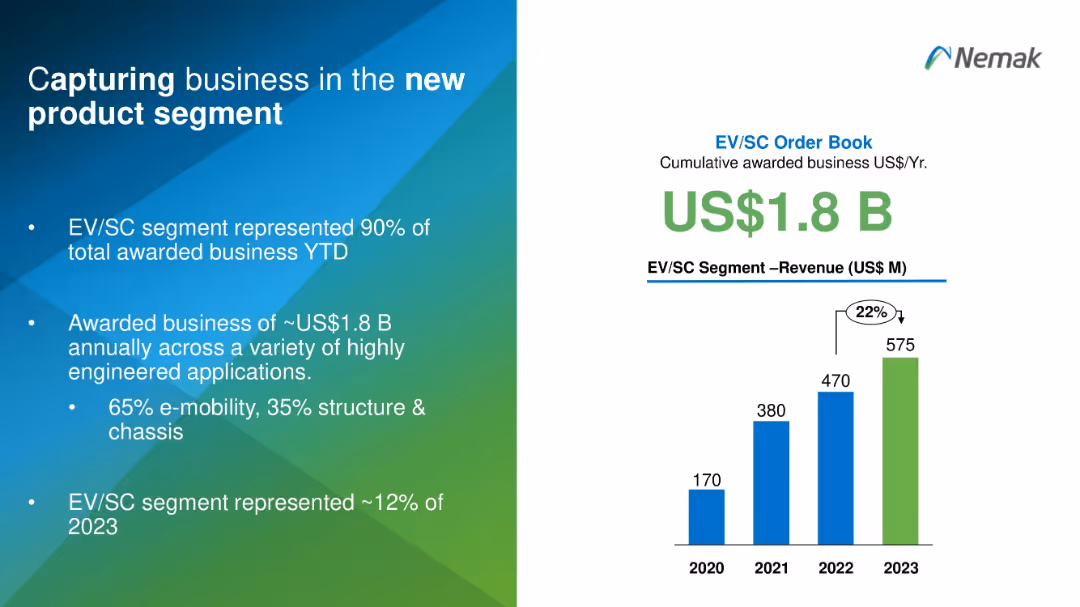
Split design with text on the left and a vertical bar chart on the right in blue and green gradients.
Sales and Business Development
Industrial & Manufacturing
This slide highlights Nemak's success in securing US$1.8B in EV/SC business, representing 90% of total awarded projects. It shows revenue growth from 2020 to 2023 and emphasizes Nemak's diversification into high-tech engineered applications, especially in e-mobility.
EV, product segment, revenue, business capture, e-mobility, engineering
false
Sales and Business Development
Industrial & Manufacturing industrial-and-manufacturing
Mixed Chart
Barclays
View slide
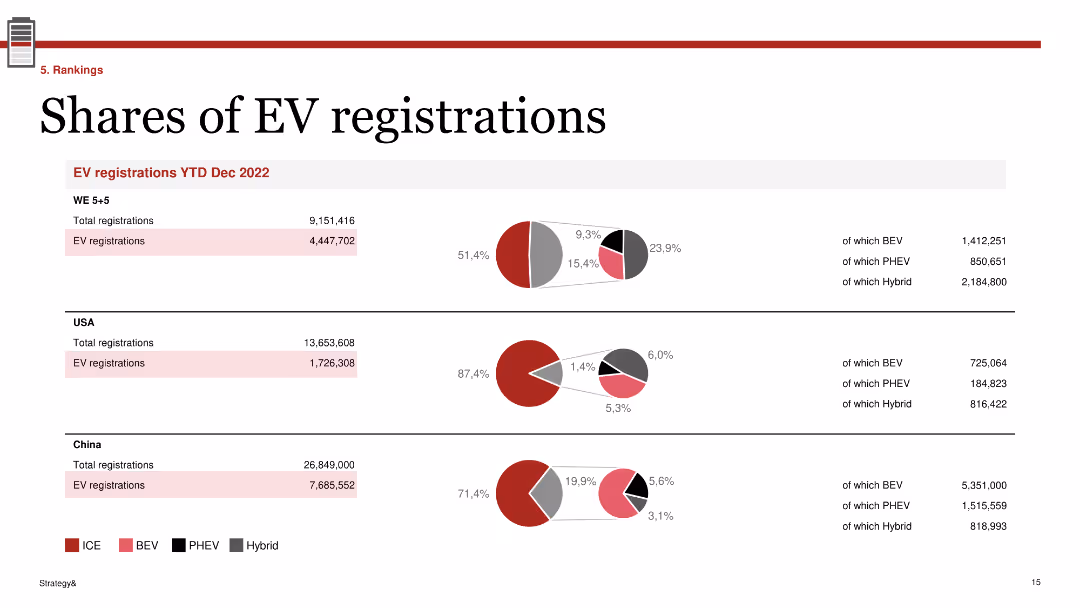
Three pie charts showing EV registration shares for WE 5+5, USA, and China, with additional data on BEV, PHEV, and Hybrid registrations.
Market Analysis and Trends
Transportation & Logistics
Provides an analysis of electric vehicle (EV) registration shares across different regions as of December 2022, highlighting BEV, PHEV, and Hybrid segments.
EV, registration, market, shares, BEV, PHEV, hybrid, USA, China, WE 5+5
false
Market Analysis and Trends
Transportation & Logistics transportation-and-logistics
Multiple Chart
PwC/Strategy&
View slide
Column chart showing VC deals and investments in the Indian EV sector.
Investment Analysis
Transportation & Logistics
Highlights the growth and distribution of venture capital investments in India’s EV ecosystem.
EV, venture capital, investments, India, market growth
false
Investment Analysis
Transportation & Logistics transportation-and-logistics
Mixed Chart
PwC/Strategy&
View slide
The slide features a column chart displaying the percentage of respondents planning to buy different types of EVs from 2020 to 2023. Key points are highlighted on the right side with yellow text boxes.
Market Analysis and Trends
Transportation & Logistics
This slide shows the increasing consumer intent to buy electric vehicles, including BEVs, hybrids, and plug-in hybrids, across several years. It indicates strong sales volume and government incentives.
EV-buying intent, consumer confidence, market share, sales volume, government incentives
false
Market Analysis and Trends
Transportation & Logistics transportation-and-logistics
Mixed Chart
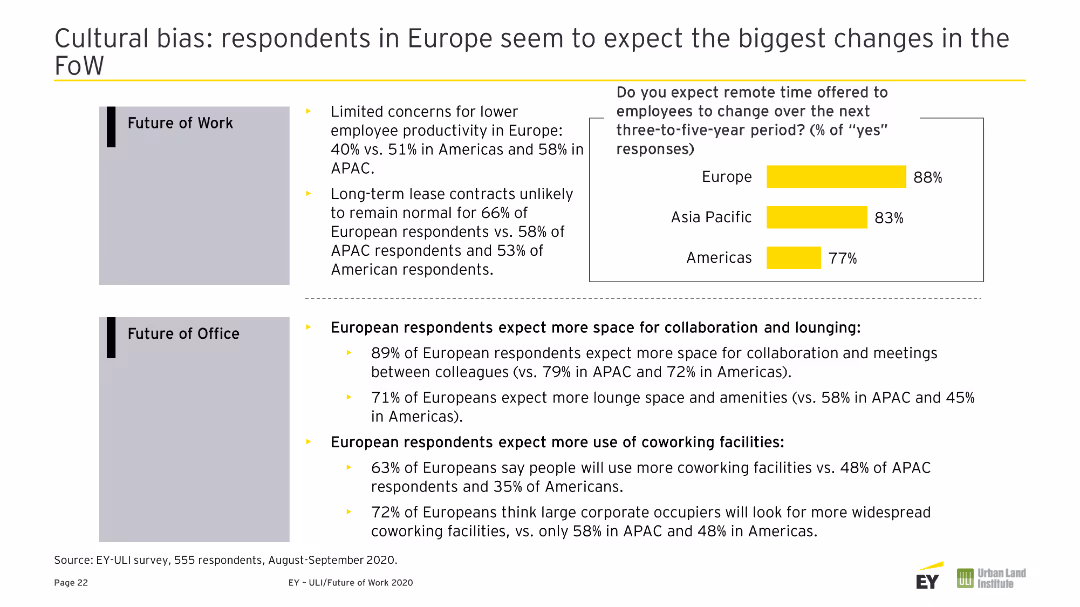
EY
View slide
A column chart depicting EV-buying intent across different countries with percentage change from 2022. The US and Nordics sections are highlighted with text boxes.
Market Analysis and Trends
Transportation & Logistics
The slide analyzes the increase in EV-buying intent across various countries, driven by government incentives, price cuts, and lower cost of ownership.
EV-buying intent, geographies, government incentives, price cuts, ownership cost
false
Market Analysis and Trends
Transportation & Logistics transportation-and-logistics
Mixed Chart
EY
View slide
This slide contains two column charts comparing EV/EBITDA and EV/FCF multiples for Waste Management and Environmental Services sectors from 2019 to 2020. Text boxes with methodological notes and private sector observations are included on the right side.
Market Analysis and Trends
Financial Services
The slide analyzes the recovery of EV/EBITDA and EV/FCF multiples in the Waste Management and Environmental Services sectors post Q1 2020 market volatility. It provides methodological insights and observations about private sector valuation.
EV/EBITDA, EV/FCF, Waste Management, Environmental Services, Market Volatility
false
Market Analysis and Trends
Financial Services financial-services
Multiple Chart
LEK
View slide
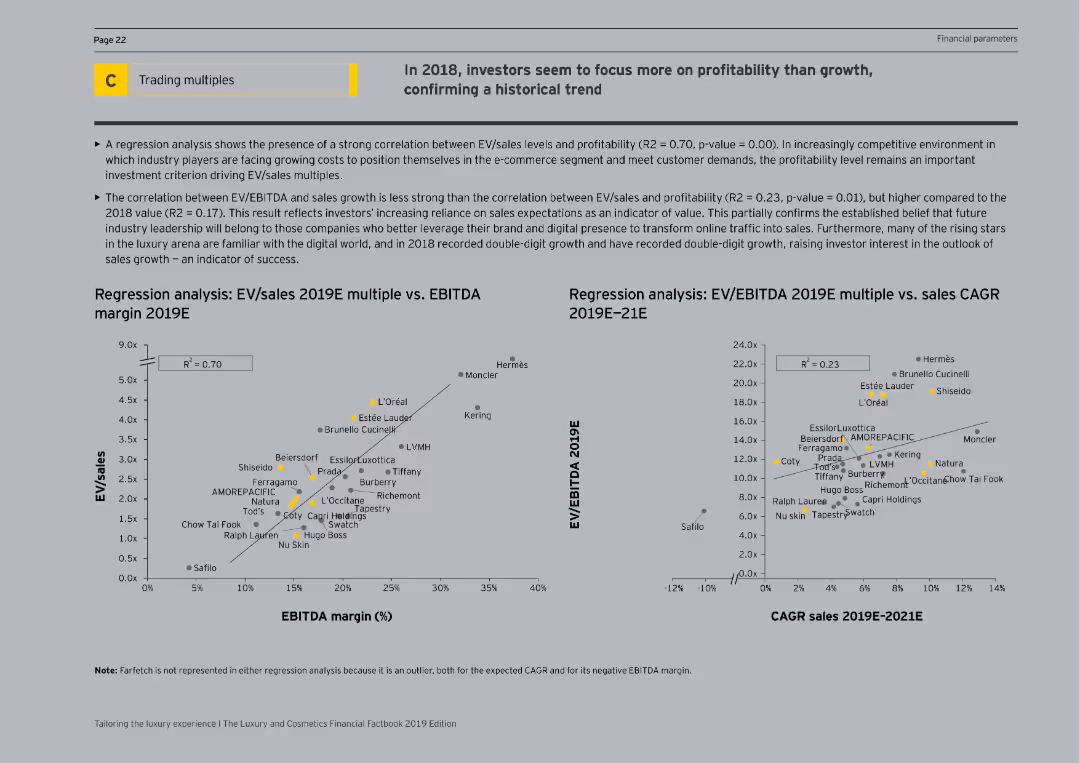
The slide features regression analysis charts with scatter plots correlating EV/sales multiples with EBITDA margins and sales CAGR for 2019E. It is visually complex, with detailed data points and regression lines, and explanatory text.
Investment Analysis
Consumer Goods
The slide highlights a regression analysis showing the correlation between EV/sales multiples and profitability versus sales growth for 2019E. It reveals that investors are focusing more on profitability, providing detailed statistical insights and supporting visualizations.
EV/Sales, Profitability, EBITDA, Sales CAGR
false
Investment Analysis
Consumer Goods consumer-goods
Multiple Chart
EY
View slide
This slide has a large, bold title on the left, and two main content areas with bullet points and icons on the right, colored in blue and green. The layout is balanced and clear.
Human Resources and Talent Management
Technology & Software
It discusses identifying unique strengths and conveying an attractive employee value proposition (EVP) to new hires, pivotal for startups and HR branding efforts.
EVP, talent acquisition, startup, branding, culture, benefits, development opportunities
false
Human Resources and Talent Management
Technology & Software technology-and-software
Header Horizontal
Kearney
View slide
Image of an electric vehicle charging and a column chart showing market share of EV sales in China and India from 2019 to 2023.
Product and Service Analysis
Transportation & Logistics
The slide highlights the growth in market share of simple and affordable electric vehicles in China and India, showing market trends.
EVs, market share, China, India, electric vehicles, affordability, market trends
false
Product and Service Analysis
Transportation & Logistics transportation-and-logistics
Mixed Chart
Accenture
View slide
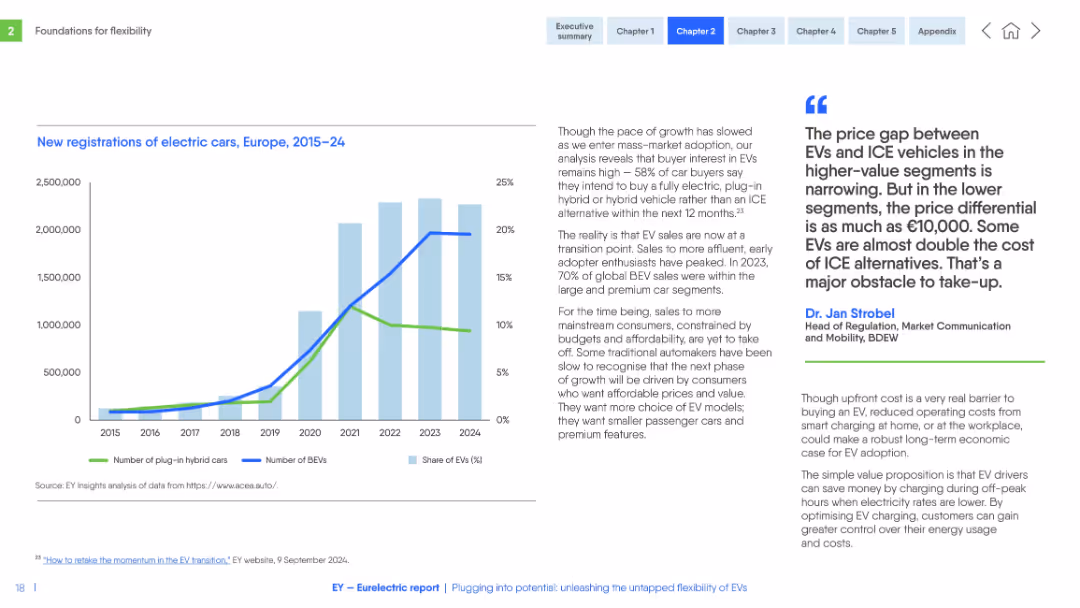
Left-aligned chart with line and bar graphs; right-aligned text and quote. Blue and green tones with clear labeling and annotations.
Market Analysis and Trends
Transportation & Logistics
The slide presents electric vehicle (EV) registration trends, showing the growth of BEVs and plug-in hybrids. It highlights market maturity, price sensitivity, and consumer behavior shifts.
EVs, registrations, BEV, PHEV, pricing, consumer adoption, trends, Europe, market shift
false
Market Analysis and Trends
Transportation & Logistics transportation-and-logistics
Mixed Chart
EY
View slide
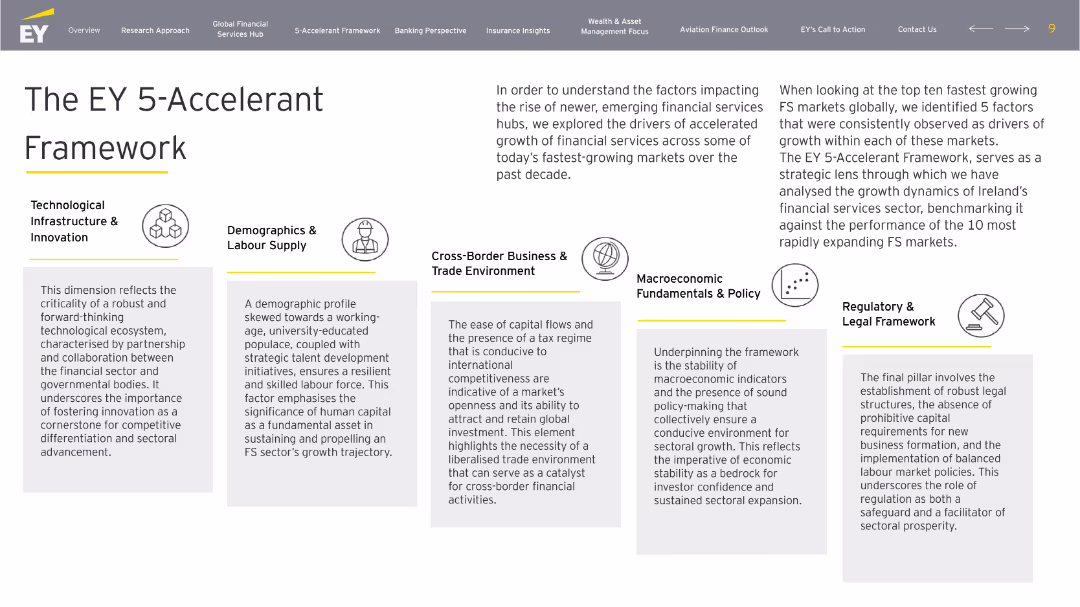
White-background slide with a central title and five horizontally aligned boxes explaining key FS growth drivers with icons and descriptions.
Strategic Planning
Financial Services
The EY 5-Accelerant Framework outlines five drivers for FS sector growth: technology, labor, trade, macroeconomics, and regulation. It benchmarks Ireland’s performance against fast-growing global FS hubs.
EY, 5-Accelerant, framework, financial growth, Ireland, FS sector, innovation, policy
false
Strategic Planning
Financial Services financial-services
Pillar
EY
View slide
Includes text describing EY's operations in real estate, with a diagram in the center highlighting key areas of transformation. Right side contains EY viewpoints in a list format.
Industry Overview
Real Estate & Construction
Overview of EY’s involvement in real estate, hospitality, and construction sectors, with a focus on future transformation areas.
EY, Real Estate, Hospitality, Construction, Overview, Transformation, Industry, Operations, Viewpoints
false
Industry Overview
Real Estate & Construction real-estate-and-construction
Mixed Chart
EY
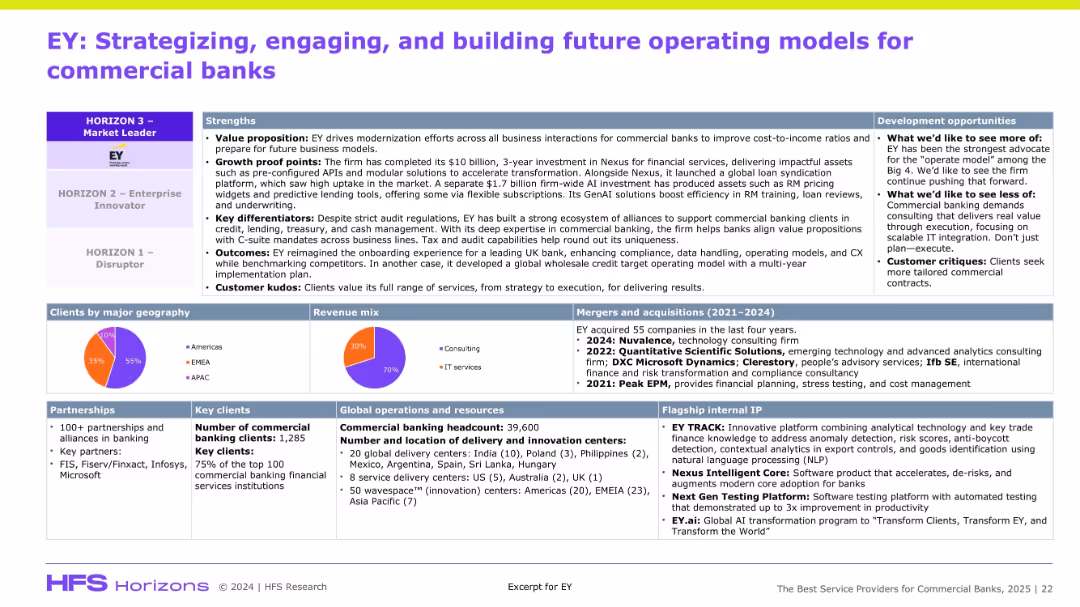
View slide
Dense information slide with multiple boxes: strengths, development, clients, revenue mix, operations, and M&A. Top section emphasizes positioning on HFS Horizon model.
Organizational Structure and Change
Financial Services
The slide positions EY as a top-tier digital transformation partner for commercial banks, citing strengths like value proposition, client kudos, and delivery footprint. It outlines EY’s investments, partnerships, and IP. Development suggestions include improving scalable IT and commercial customization. The slide supports EY’s leadership in financial services consulting.
EY, banking, modernization, Nexus, partnerships, M&A, GenAI, revenue mix
false
Organizational Structure and Change
Financial Services financial-services
Mixed Chart
Accenture
View slide
A triangular diagram showing various services EY offers to private equity clients. Categories include Funds, Strategy and Transaction Services, and Portfolio Services.
Organizational Structure and Change
Professional Services
This slide outlines the range of services provided by EY to private equity clients, covering areas like fund assurance, buy and sell side advisory, tax, and legal services.
EY, services, private equity, advisory, portfolio
false
Organizational Structure and Change
Professional Services professional-services
Framework
EY
View slide
The slide features the EY-Parthenon logo, a title, subtitle, and the name and title of the presenter.
Organizational Structure and Change
Professional Services
The slide serves as the introductory slide to a presentation on investment in distribution by EY-Parthenon.
EY-Parthenon, Distribution, Investing, Overview, Presentation, Introduction
false
Organizational Structure and Change
Professional Services professional-services
Title
EY
View slide
The slide is professionally designed with a clean white background. It has three columns with headers: 'Key questions', 'EY-Parthenon capabilities', 'Representative engagements', and bullet points under each. Text is black with the exception of the slide title in red, and there are no images or graphs.
Industry Overview
Financial Services
This slide showcases EY-Parthenon’s capabilities in assisting investors to evaluate potential distribution investments, highlighting key questions for market analysis, and listing previous engagements that showcase their expertise and experience.
EY-Parthenon, distribution investments, market analysis, due diligence, proprietary research, revenue forecasting, investment trends, sector analysis, HVAC, MRO market
false
Industry Overview
Financial Services financial-services
Header Horizontal
EY
View slide
Slide presents column charts and statistics on early childhood education outcomes and hub participant engagement in playgroups.
Market Analysis and Trends
Education & Training
Analyzes the influence of community hubs on early childhood development, focusing on educational outcomes and parental support systems.
Early childhood, educational outcomes, community hubs, parental support, playgroups
false
Market Analysis and Trends
Education & Training education-and-training
Multiple Chart
Deloitte
View slide
This slide contains a bar chart showing various reasons for investing in early childhood, such as fairness and societal benefits, with different bars representing different reasons.
Market Analysis and Trends
Education & Training
The slide indicates that many people believe in the importance of investing in early childhood to ensure fairness and support societal well-being.
Early childhood, fairness, investment, bar chart, public opinion, Ipsos, education, development, survey
false
Market Analysis and Trends
Education & Training education-and-training
Single Chart
IPSOS
View slide
This slide contains a pie chart showing the perceived importance of early childhood on later life outcomes, with different segments representing levels of importance.
Market Analysis and Trends
Education & Training
The slide emphasizes that a significant majority (91%) believe early childhood is crucial for shaping future life, with various levels of importance highlighted.
Early childhood, importance, shaping life, pie chart, survey, Ipsos, education, development, UK
false
Market Analysis and Trends
Education & Training education-and-training
Mixed Chart
IPSOS
View slide
The slide features a bar chart illustrating public recognition of different life stages' importance in shaping future lives, with different bars representing various age ranges.
Market Analysis and Trends
Education & Training
It shows that there is varied recognition of the importance of different life stages in shaping future lives, with early childhood recognized less compared to other stages like primary school.
Early childhood, life stages, importance, bar chart, public opinion, Ipsos, education, development, survey
false
Market Analysis and Trends
Education & Training education-and-training
Single Chart
IPSOS
View slide
This slide shows a bar chart with percentages indicating public opinion on how early childhood affects various aspects of later life, such as mental health and relationships.
Market Analysis and Trends
Education & Training
It underscores that many believe early childhood significantly impacts mental health and well-being, as well as relationships and happiness.
Early childhood, mental health, impact, bar chart, public opinion, Ipsos, education, development, survey
false
Market Analysis and Trends
Education & Training education-and-training
Single Chart
IPSOS
View slide
The slide presents a bar chart with different statements on the benefits of investing in early childhood, highlighting mental health and other societal benefits.
Market Analysis and Trends
Education & Training
It emphasizes that investing in early childhood is seen as crucial for reducing future mental health issues and creating a happier society.
Early childhood, mental health, investment, bar chart, public opinion, Ipsos, education, development, survey
false
Market Analysis and Trends
Education & Training education-and-training
Single Chart
IPSOS
View slide
This slide presents a horizontal bar chart showing percentages of agreement with statements about the priority of early childhood in societal focus. Different bars represent different statements.
Market Analysis and Trends
Education & Training
The slide indicates that a significant portion of the public agrees that early childhood should be a top priority for society, with various levels of agreement on different statements.
Early childhood, societal focus, priority, horizontal bar chart, public opinion, Ipsos, education, development, survey
false
Market Analysis and Trends
Education & Training education-and-training
Single Chart
IPSOS
View slide
The slide features two horizontal bar charts comparing public opinion on the need for more support in early childhood development.
Market Analysis and Trends
Education & Training
It highlights that nearly half of the public believes there is insufficient support for early childhood development, with higher agreement among parents of young children.
Early childhood, support, development, horizontal bar chart, public opinion, Ipsos, education, parents, survey
false
Market Analysis and Trends
Education & Training education-and-training
Single Chart
IPSOS
View slide
This slide features moderate visual complexity, incorporating pie charts to reflect opinions on the timing of international assignments in one's career. It has a clear textual layout and uses a consistent color theme to present the statistics, making the data easily understandable.
Human Resources and Talent Management
Professional Services
The content discusses the demand for early mobility experiences and the lack thereof in many organizations. It suggests that timely international experiences can influence employees’ outlook on mobility and are crucial for developing a diverse leadership pipeline. The slide encourages organizations to offer such opportunities earlier.
Early mobility, Workforce development, Leadership pipeline, Timing
false
Human Resources and Talent Management
Professional Services professional-services
Multiple Chart
PwC/Strategy&
Previous
Loading...
Hold On!
We are searching in our database
If nothing, comes up, please try different filters!
Column Chart
Heatmap
Chevron
Org Chart
Infographic
Callouts
Timeline
List
Graphic
Picture
Process Flow
Diagram
Paragraph
Map
Table
Framework
Subtitle
Takeaway Box
Icon
Other Chart
Radar Chart
Waterfall Chart
Mekko Chart
Pie Chart
Scatter Plot
Line Chart
Bar chart
Bullet points
Create a FREE account to continue browsing
Receive Instant Access to 1,000+ slides from companies like McKinsey, Google, and Goldman Sachs
First Name
Last Name
Email
Password
I agree to all
Terms & Privacy Policy
Thank you! Your submission has been received!
Oops! Something went wrong while submitting the form.
Have an account?
Sign in
Upgrade to PRO to Save slides
Advanced Search and Filters
Access to 15,000+ slides
Access to Category Pages
Save/Bookmark Slides
PowerPoint Template Library
Pick a Plan
MONTHLY
$12/month
Billed every month, Cancel anytime.
YEARLY
$9/year
Billed $108 annually, Cancel anytime.
Checkout for $12/month
Checkout for $108/yr
Secured by Stripe | AES-256 bit encryption