My Account
My Slides
Search by Category
Templates
View All Templates
Download Template Slides
Leave Feedback
Login
Logout
Get Started
Browse all Slides
Browse all Slides
Create a FREE Account
Instant access to 1,000+ real slides from top companies like McKinsey, BCG, Goldman Sachs, Google and many more!
First Name
Last Name
Email
Password
I agree to all
Terms & Privacy Policy
Thank you! Your submission has been received!
Oops! Something went wrong while submitting the form.
Have an account?
Sign in
Spark Your Next Big Idea with New Presentation Templates
VIEW ALL Templates
Welcome,
Welcome
PRO
Show Featured Only
Checkbox 8
Companies
Mckinsey
Bain
BCG
EY
Deloitte
Accenture
PwC/Strategy&
JP Morgan
Goldman Sachs
Morgan Stanley
Citigroup
Deutsche Bank
Barclays
LEK
KPMG
Kearney
Oliver Wyman
Booz Allen Hamilton
Gartner
IPSOS
Nielsen
Slide type
Text Only
Linear Flow
Vertical Flow
Single Chart
Header Horizontal
Mixed Chart
Header Vertical
Pillar
Multiple Chart
Graphic
Agenda
Title
Table
Framework
Industry
Technology & Software
Artificial Intelligence
Financial Services
Retail & E-commerce
Consumer Goods
Industrial & Manufacturing
Transportation & Logistics
Telecommunications
Real Estate & Construction
Hospitality & Tourism
Professional Services
Education & Training
Media & Entertainment
Agriculture & Food Production
Healthcare & Pharmaceuticals
Environmental Services & Sustainability
Government & Public Sector
Use Case
Mergers and Acquisitions
Performance Metrics and KPIs
Client Case Studies
Competitive Landscape
Corporate Finance and Valuation
Product and Service Analysis
Customer and Market Segmentation
Organizational Structure and Change
Industry Overview
Regulatory and Compliance
Risk Assessment and Management
Investment Analysis
Organizational Structure and Change
Human Resources and Talent Management
Financial Performance
Market Analysis and Trends
Sales and Business Development
Human Resources and Talent Management
Clear all
Thank you! Your submission has been received!
Oops! Something went wrong while submitting the form.
Tag
View slide
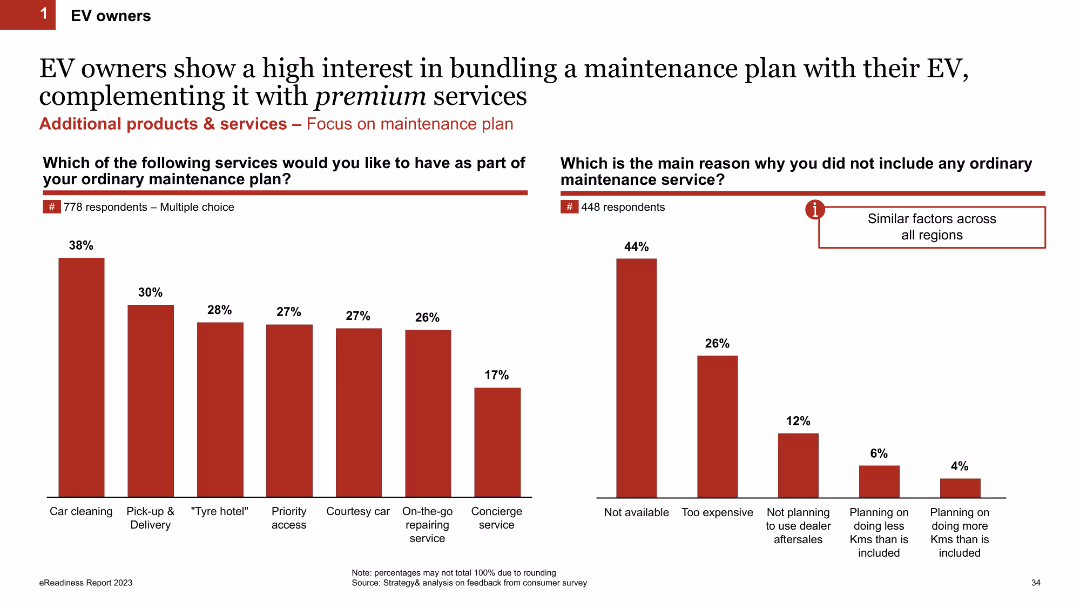
The slide contains two column charts. The first chart shows the percentage of EV owners interested in additional services for their maintenance plan, while the second chart shows the reasons for not including maintenance services.
Product and Service Analysis
Transportation & Logistics
The slide presents data on EV owners' interest in bundling additional services with their maintenance plan and the reasons some do not include maintenance services. It is useful for understanding customer preferences and barriers in the EV maintenance market.
EV owners, maintenance plan, services, reasons, chart, data
false
Product and Service Analysis
Transportation & Logistics transportation-and-logistics
Multiple Chart
PwC/Strategy&
View slide
A comparative column chart showing regional differences in EV ownership metrics such as income, age, gender, and living conditions across APAC, EMEA, and North America.
Market Analysis and Trends
Transportation & Logistics
Highlights the varying demographics and characteristics of EV owners in different regions, indicating different stages of EV adoption maturity.
EV owners, regional differences, income, demographics, survey
false
Market Analysis and Trends
Transportation & Logistics transportation-and-logistics
Multiple Chart
PwC/Strategy&
View slide
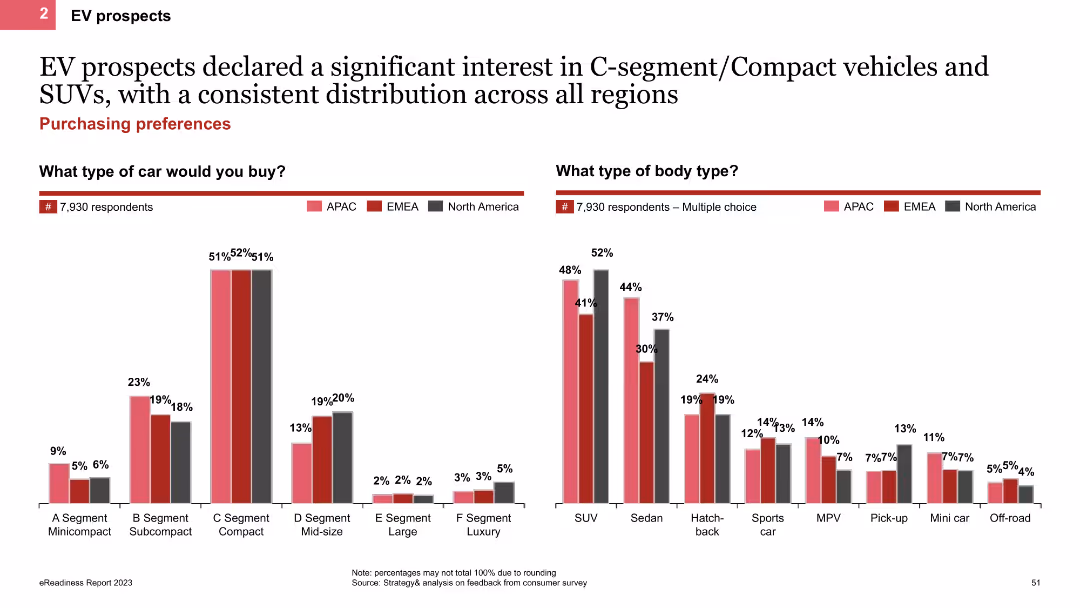
The slide uses column charts to show the types of cars and body types preferred by EV prospects. It presents data on preferences for various segments like C-segment and SUVs, with regional comparisons indicated by different colors.
Customer and Market Segmentation
Transportation & Logistics
This slide details the car and body type preferences of EV prospects, showing a significant interest in C-segment vehicles and SUVs. It includes regional data to illustrate the distribution of these preferences across different areas.
EV preferences, column chart, C-segment, SUV, regional comparison
false
Customer and Market Segmentation
Transportation & Logistics transportation-and-logistics
Multiple Chart
PwC/Strategy&
View slide
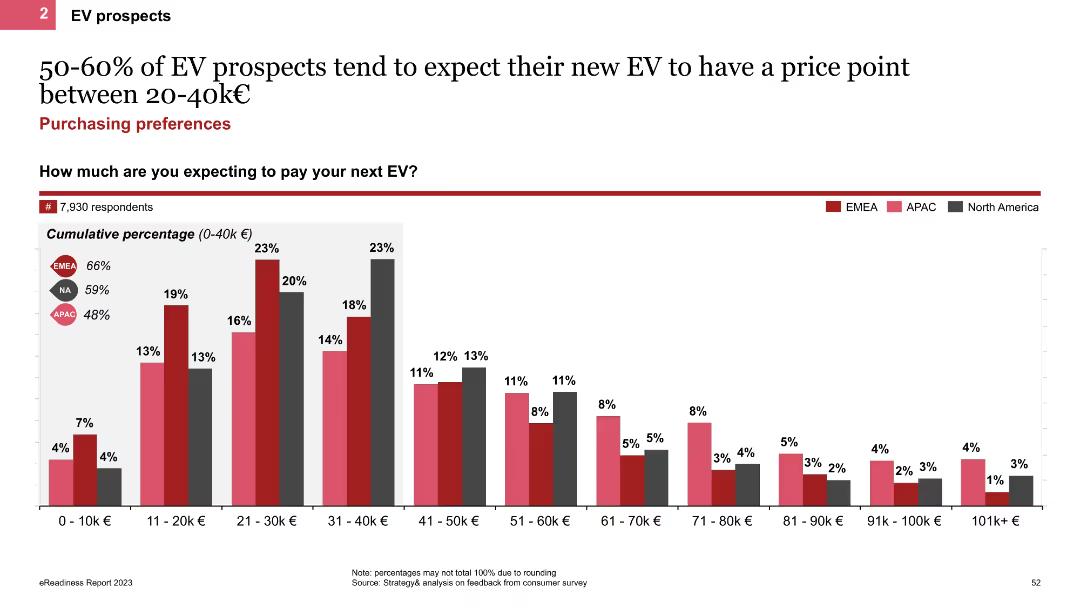
The slide features a column chart displaying the expected price range for new EVs among prospects. It shows cumulative percentages for different price points, with regional comparisons indicated by colored bars for EMEA, APAC, and North America.
Market Analysis and Trends
Transportation & Logistics
This slide presents the expected price range for new EVs among prospects, highlighting that 50-60% expect to pay between 20-40k€. It includes regional comparisons to show variations in price expectations across different markets.
EV price range, column chart, price expectations, regional comparison
false
Market Analysis and Trends
Transportation & Logistics transportation-and-logistics
Single Chart
PwC/Strategy&
View slide
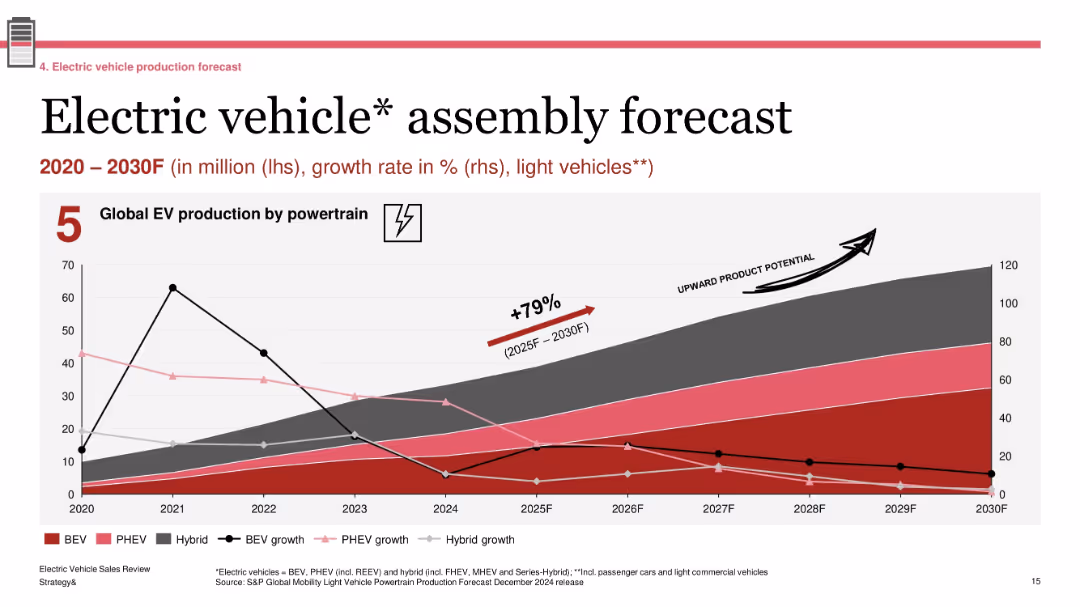
Line and area chart tracking EV production and growth rate by powertrain; annotation for “upward product potential”; uses five powertrain types and shows historical data (2020–2024) with projections to 2030
Technology and Digital Transformation
Industrial & Manufacturing
The slide presents global EV production trends by powertrain from 2020 to 2030. It includes BEV, PHEV, and hybrid vehicles, with associated growth rates. A 79% increase is forecasted between 2025 and 2030. The graphic highlights the industry’s long-term growth potential, especially for BEVs, and contextualizes recent slowdowns with projected acceleration.
EV production, global forecast, BEV, hybrid, powertrain growth, 2025–2030, automotive outlook
false
Technology and Digital Transformation
Industrial & Manufacturing industrial-and-manufacturing
Single Chart
PwC/Strategy&
View slide
Similar to the previous slide, this one uses line charts and icons to profile Dreamers. It includes demographic information and EV purchase intentions, showing differences from Tech Enthusiasts in terms of age, income, family size, and car usage.
Customer and Market Segmentation
Transportation & Logistics
This slide focuses on Dreamers, detailing their lower car usage, environmental consciousness, and moderate tech confidence compared to Tech Enthusiasts. It provides demographic data and insights into their EV purchase motivations.
EV prospects, Dreamers, line charts, demographics, motivation
false
Customer and Market Segmentation
Transportation & Logistics transportation-and-logistics
Multiple Chart
PwC/Strategy&
View slide
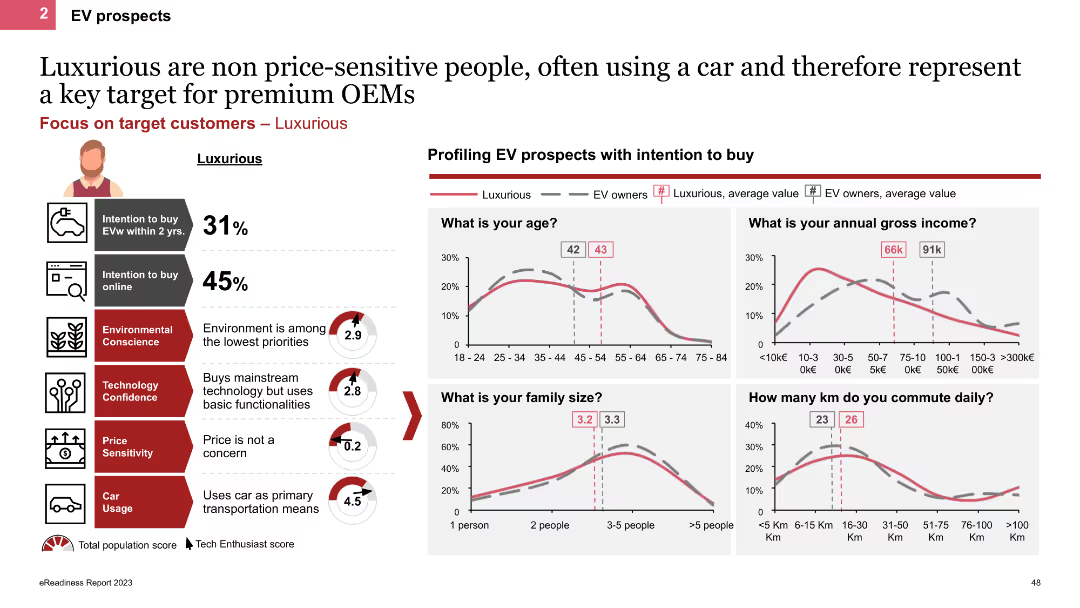
The slide profiles Luxurious personas using line charts and icons, showing demographic details like age, income, and family size. It highlights their high car usage and low price sensitivity, with charts comparing their characteristics to other EV owners.
Customer and Market Segmentation
Transportation & Logistics
This slide describes Luxurious personas, emphasizing their high income, frequent car usage, and lack of price sensitivity. It provides demographic comparisons and insights into their EV purchase behaviors and preferences.
EV prospects, Luxurious, line charts, demographics, high income
false
Customer and Market Segmentation
Transportation & Logistics transportation-and-logistics
Multiple Chart
PwC/Strategy&
View slide
The slide includes line charts and icons to profile Pragmatic personas. It shows demographic details and EV purchase intentions, highlighting their rational approach to buying, with less emphasis on environmental concerns and more on cost and practicality.
Customer and Market Segmentation
Transportation & Logistics
This slide profiles Pragmatic personas, noting their rational decision-making, emphasis on cost and practicality, and moderate environmental consciousness. It includes demographic data and insights into their EV purchase intentions.
EV prospects, Pragmatic, line charts, demographics, rational
false
Customer and Market Segmentation
Transportation & Logistics transportation-and-logistics
Multiple Chart
PwC/Strategy&
View slide
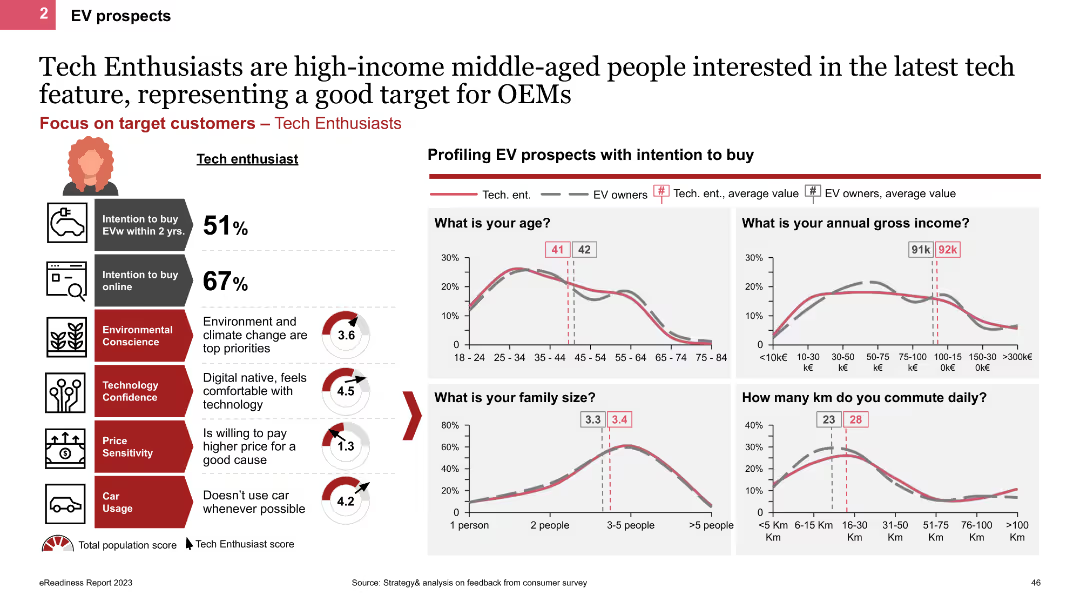
The slide includes various small line charts and icons to profile EV prospects among Tech Enthusiasts. It features demographic charts such as age, income, family size, and commute distance, with text blocks summarizing key characteristics and motivations.
Customer and Market Segmentation
Transportation & Logistics
This slide profiles Tech Enthusiasts, detailing their demographics, motivations, and EV purchase intentions. It highlights their higher income, tech-savvy nature, and preference for environmentally friendly options.
EV prospects, Tech Enthusiasts, line charts, demographics, motivation
false
Customer and Market Segmentation
Transportation & Logistics transportation-and-logistics
Multiple Chart
PwC/Strategy&
View slide
The slide features bar charts showing commuting habits of EV prospects across APAC, EMEA, and North America. Metrics include commuting by car, combining car with other means, days per week of commuting, daily kilometers, and typical car tenure.
Market Analysis and Trends
Transportation & Logistics
This slide compares commuting habits of EV prospects in different regions, including the percentage of car commuters, combination with other means, frequency, distance, and car tenure. It provides insights into regional commuting patterns.
EV prospects, commuting habits, regional differences, car tenure, daily kilometers
false
Market Analysis and Trends
Transportation & Logistics transportation-and-logistics
Multiple Chart
PwC/Strategy&
View slide
The slide presents bar charts comparing demographics and mobility preferences of EV prospects across APAC, EMEA, and North America. Key metrics include annual gross income, age, gender, urban living, and private parking availability.
Market Analysis and Trends
Transportation & Logistics
The slide provides a comparison of demographic and mobility factors for EV prospects in different regions, highlighting differences in income, age, gender, urban living, and private parking. It helps understand regional consumer profiles.
EV prospects, demographics, mobility, regional differences, income, urban living
false
Market Analysis and Trends
Transportation & Logistics transportation-and-logistics
Multiple Chart
PwC/Strategy&
View slide
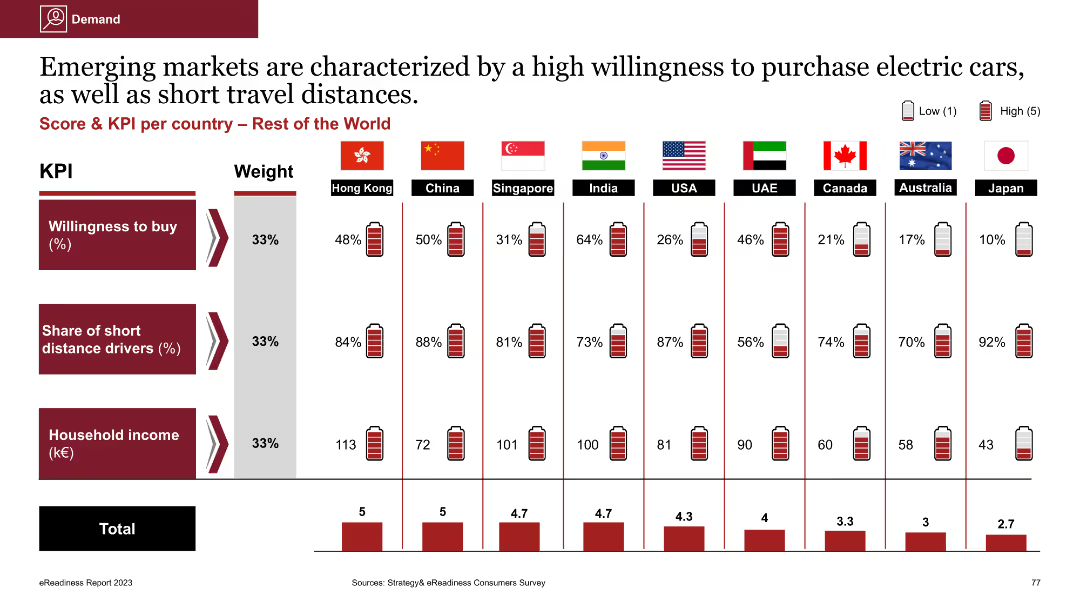
Column chart comparing willingness to buy EVs, share of short distance drivers, and household income across countries
Market Analysis and Trends
Energy & Utilities
The slide emphasizes the high willingness to purchase EVs in emerging markets, showing comparisons of willingness to buy, short travel distances, and household income across various countries
EV purchase, willingness to buy, short distance drivers, household income, emerging markets
false
Market Analysis and Trends
Energy & Utilities energy-and-utilities
Multiple Chart
PwC/Strategy&
View slide
Column chart and bar charts displaying perceptions of EV range reduction due to car age and cold weather. The slide includes data on battery health and range reduction percentages.
Customer and Market Segmentation
Transportation & Logistics
This slide examines the perceived reduction in EV range among owners, attributing it to car age and cold weather conditions. It also includes data on the current state of battery health and the extent of range reduction experienced.
EV range reduction, battery health, cold weather impact, car age, perception
false
Customer and Market Segmentation
Transportation & Logistics transportation-and-logistics
Multiple Chart
PwC/Strategy&
View slide
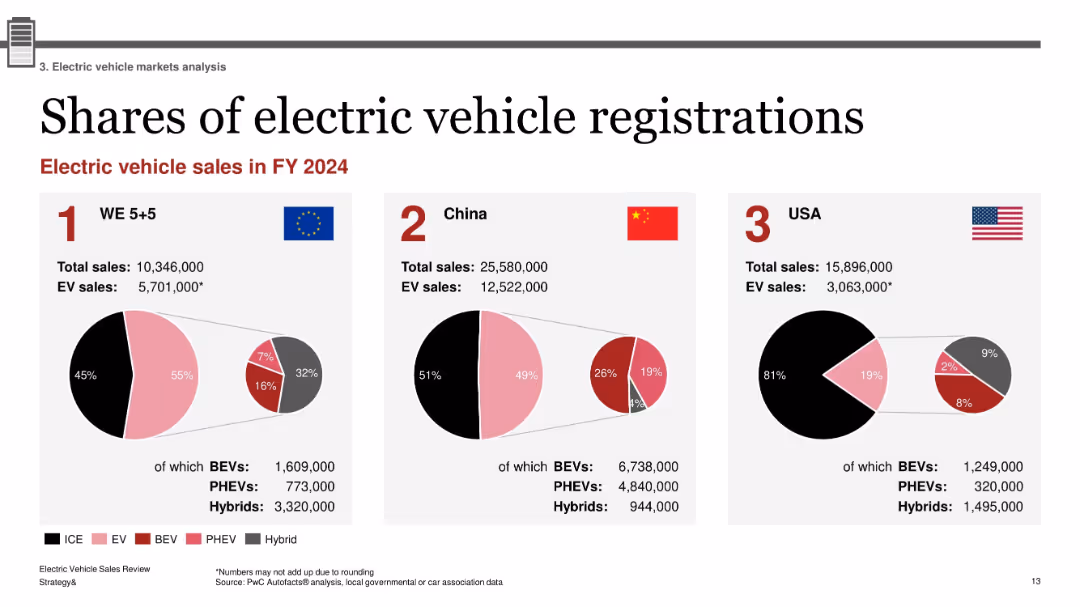
Three-part layout with pie charts for WE 5+5, China, and USA; flags and national data; red-pink-black hybrid color scheme with category breakout
Market Analysis and Trends
Industrial & Manufacturing
This slide compares electric vehicle registrations in FY2024 across Western Europe, China, and the USA. Each region’s total and EV sales are provided, with breakdowns into BEVs, PHEVs, and Hybrids. China leads in absolute numbers, while Western Europe shows the highest EV share percentage. The visualization highlights regional market penetration and composition.
EV registrations, BEV, PHEV, hybrid market, regional comparison, 2024 sales, WE5+5, China, USA
false
Market Analysis and Trends
Industrial & Manufacturing industrial-and-manufacturing
Single Chart
PwC/Strategy&
View slide
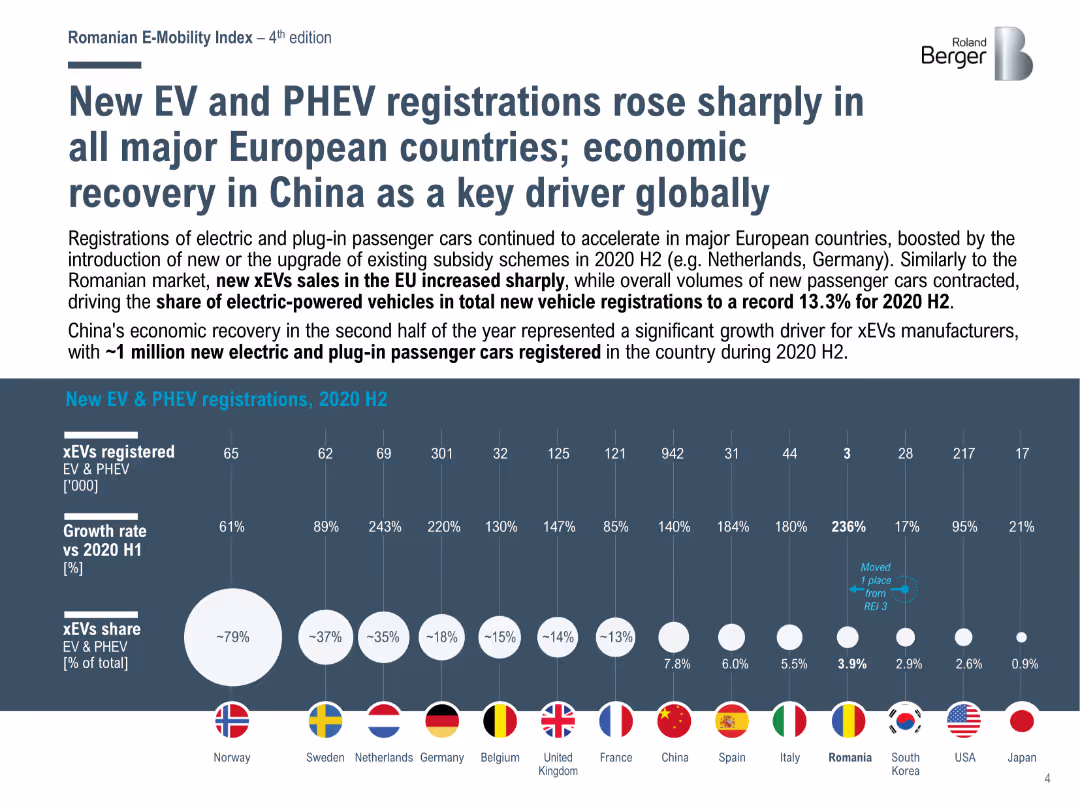
Bar chart showing the growth rates and share of new EV and PHEV registrations in major European countries in 2020 H2, highlighting China's role as a key driver.
Market Analysis and Trends
Transportation & Logistics
Analyzes the sharp increase in EV and PHEV registrations across Europe and the significant role of China's economic recovery in driving global xEV sales in 2020 H2.
EV registrations, PHEV registrations, Europe, China, market growth
false
Market Analysis and Trends
Transportation & Logistics transportation-and-logistics
Mixed Chart
Roland Berger
View slide
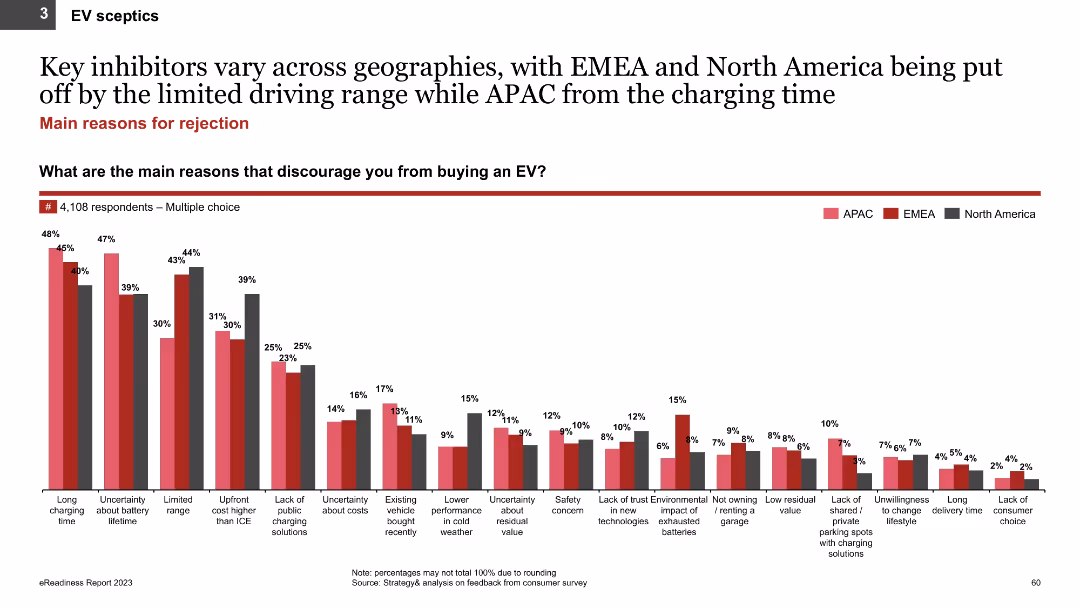
The slide shows a bar chart illustrating the main reasons for rejecting EVs among sceptics in APAC, EMEA, and North America. Each region is color-coded, and multiple reasons are displayed along the x-axis.
Market Analysis and Trends
Transportation & Logistics
The slide details the primary factors discouraging EV adoption, such as long charging times and limited driving range, based on a survey of 4,108 respondents. It aims to understand and address barriers to EV uptake.
EV rejection, barriers, charging time, driving range, regional differences
false
Market Analysis and Trends
Transportation & Logistics transportation-and-logistics
Single Chart
PwC/Strategy&
View slide
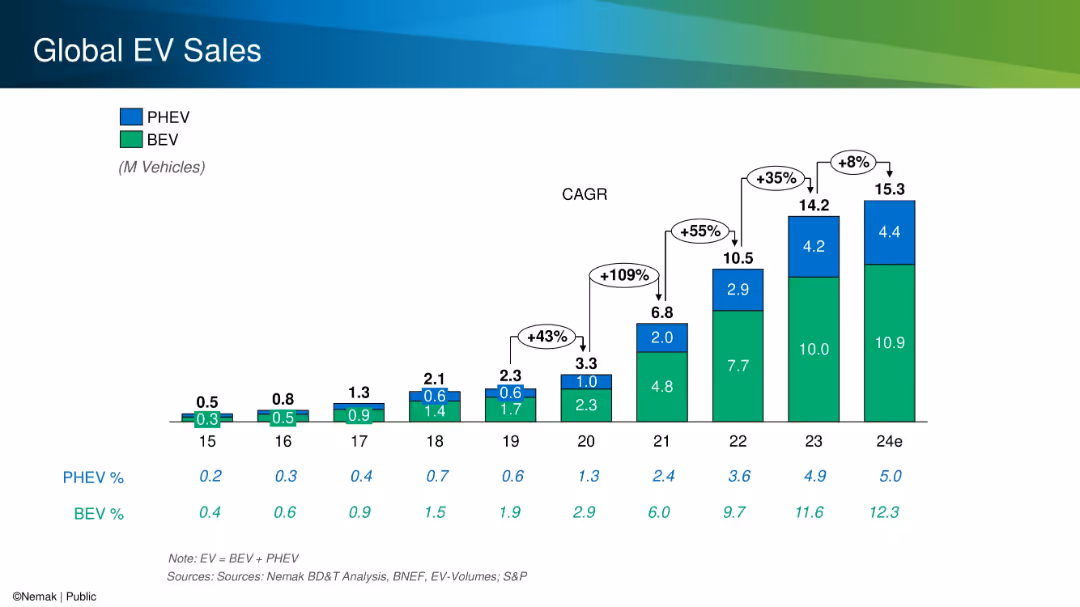
Stacked bar chart with color-coded segments for PHEV and BEV, annotated with CAGR growth percentages.
Performance Metrics and KPIs
Industrial & Manufacturing
The slide provides a historical and projected overview of global electric vehicle (EV) sales split between BEVs and PHEVs. It highlights significant year-over-year growth, especially from 2020 to 2023, and shows total volumes and market share increases.
EV sales, BEV, PHEV, CAGR, growth, market share
false
Performance Metrics and KPIs
Industrial & Manufacturing industrial-and-manufacturing
Single Chart
Barclays
View slide
Slide features column charts comparing electric vehicle (EV) sales over years in various vehicle categories, highlighting trends in a visually straightforward manner.
Market Analysis and Trends
Transportation & Logistics
Discusses the sales trends of electric vehicles in India, with an emphasis on market dynamics, consumer preferences, and infrastructure developments affecting EV adoption.
EV sales, India, market trends, consumer preferences, infrastructure development, electric vehicles
false
Market Analysis and Trends
Transportation & Logistics transportation-and-logistics
Multiple Chart
PwC/Strategy&
View slide
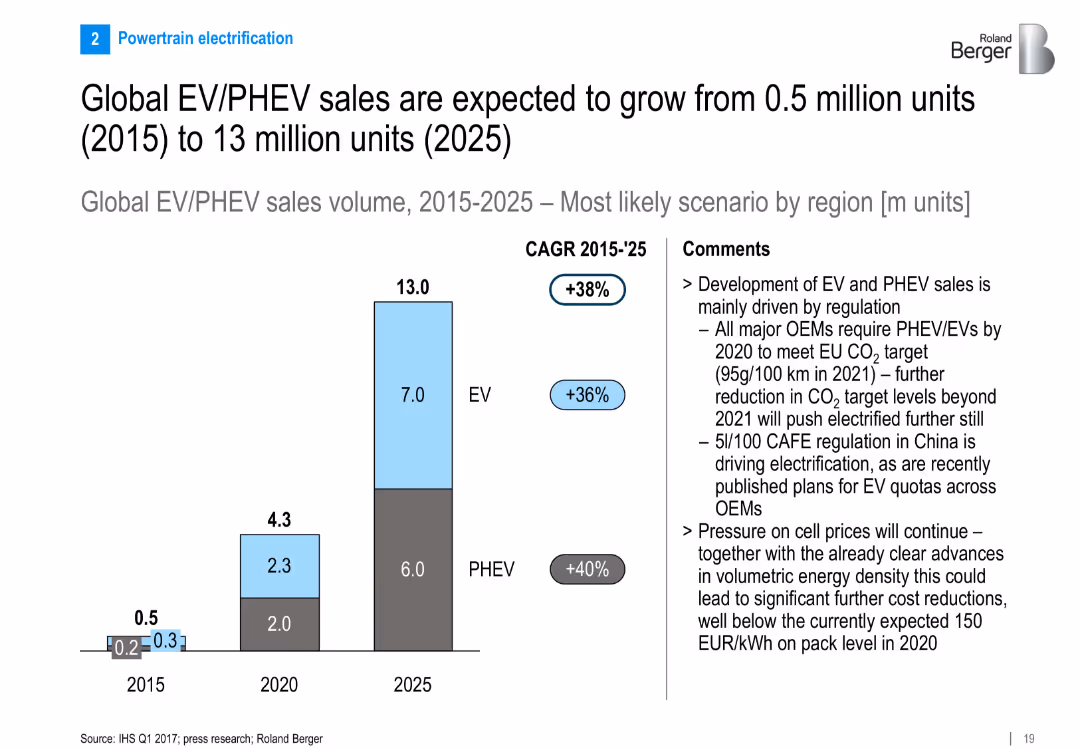
Bar chart visualizing EV/PHEV sales growth from 2015 to 2025; CAGR annotated; right side contains drivers such as regulation and cost reduction
Market Analysis and Trends
Industrial & Manufacturing
Forecasts rapid global growth of EV and PHEV sales, driven largely by regulations in EU and China. Details CAGR and suggests that battery price and density improvements will drive further adoption.
EV sales, PHEV growth, 2025 forecast, electrification, regulation, CO2 targets, battery cost, CAGR
false
Market Analysis and Trends
Industrial & Manufacturing industrial-and-manufacturing
Mixed Chart
Roland Berger
View slide
The slide includes two column charts: one comparing EV sales in key markets (China and USA) from December 21 to December 22, and the other showing YTD EV sales growth from December 21 to December 22.
Market Analysis and Trends
Transportation & Logistics
This slide illustrates the growth in EV sales in key markets, showing a 40% increase in December 2022 compared to December 2021, and a 47% increase in year-to-date EV sales, emphasizing the upward trend in EV adoption.
EV sales, growth, China, USA, market trends, YTD
false
Market Analysis and Trends
Transportation & Logistics transportation-and-logistics
Multiple Chart
PwC/Strategy&
View slide
The slide features a table with bar charts showing demographic and mobility differences among EV sceptics in APAC, EMEA, and North America. The layout is clean with distinct color coding for each region.
Market Analysis and Trends
Transportation & Logistics
The slide provides a comparative analysis of demographics and mobility needs among EV sceptics across different regions, based on a survey of 4,108 respondents. It aims to highlight regional variations in EV adoption barriers.
EV sceptics, regional differences, demographics, mobility needs, survey data
false
Market Analysis and Trends
Transportation & Logistics transportation-and-logistics
Multiple Chart
PwC/Strategy&
View slide
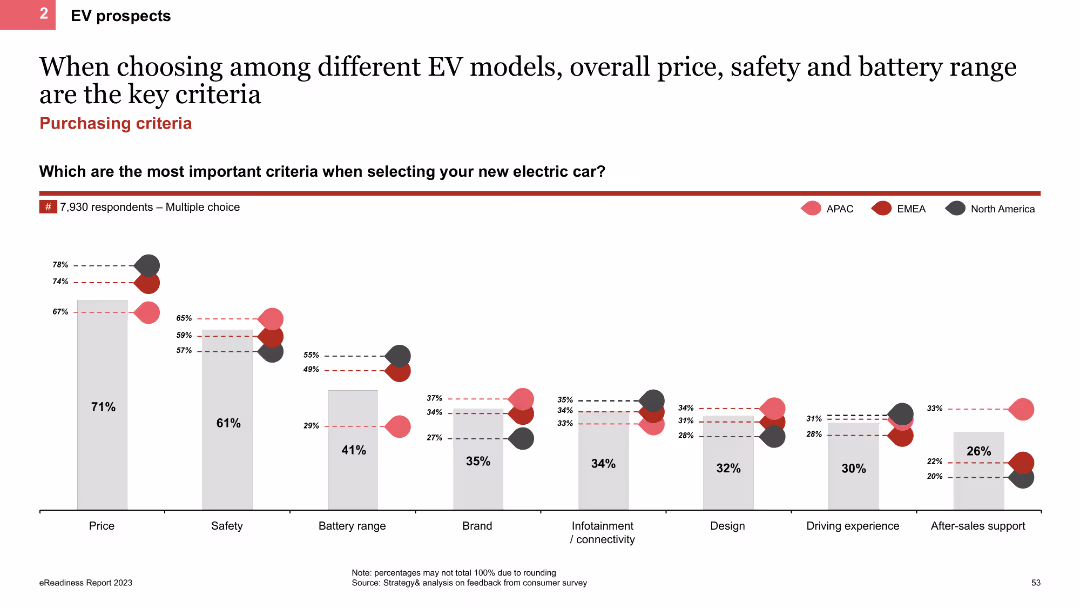
The slide features a column chart showing the most important criteria for selecting EV models, such as price, safety, and battery range. It includes regional comparisons with colored bars representing APAC, EMEA, and North America.
Customer and Market Segmentation
Transportation & Logistics
This slide identifies the key criteria for selecting EV models, emphasizing overall price, safety, and battery range as top factors. It provides regional data to highlight differences in preferences across various markets.
EV selection criteria, column chart, price, safety, battery range
false
Customer and Market Segmentation
Transportation & Logistics transportation-and-logistics
Single Chart
PwC/Strategy&
View slide
Slide includes images of car parts, bar graphs showing range impacts of different HVAC technologies, and diagrams.
Technology and Digital Transformation
Transportation & Logistics
Discusses new heat pump technology in electric vehicles (EVs), efficiency, and awards in different regions.
EV technology, heat pump, efficiency, HVAC, awards
false
Technology and Digital Transformation
Transportation & Logistics transportation-and-logistics
Mixed Chart
Deutsche Bank
View slide
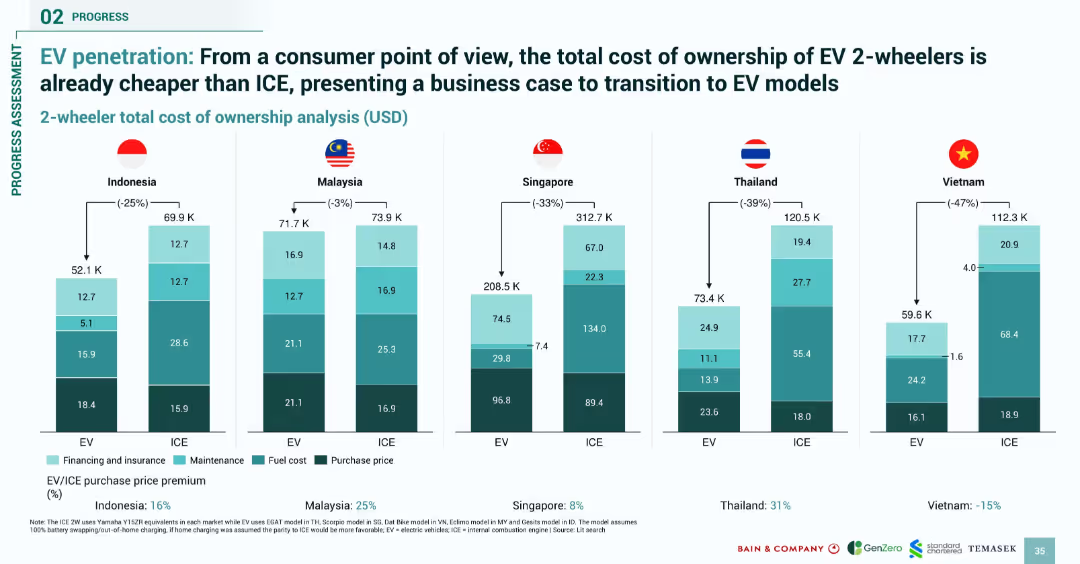
Clustered bar charts comparing total cost of ownership for ICE vs. EV 2-wheelers; simple vertical breakdown
Product and Service Analysis
Transportation & Logistics
Compares the total cost of ownership for electric versus internal combustion engine (ICE) 2-wheelers across five SEA countries. EVs are shown to be cheaper in all cases, making a strong economic case for transition despite higher upfront costs in some markets.
EV vs ICE, cost comparison, SEA, 2-wheelers, affordability, maintenance, fuel cost
false
Product and Service Analysis
Transportation & Logistics transportation-and-logistics
Single Chart
Bain
View slide
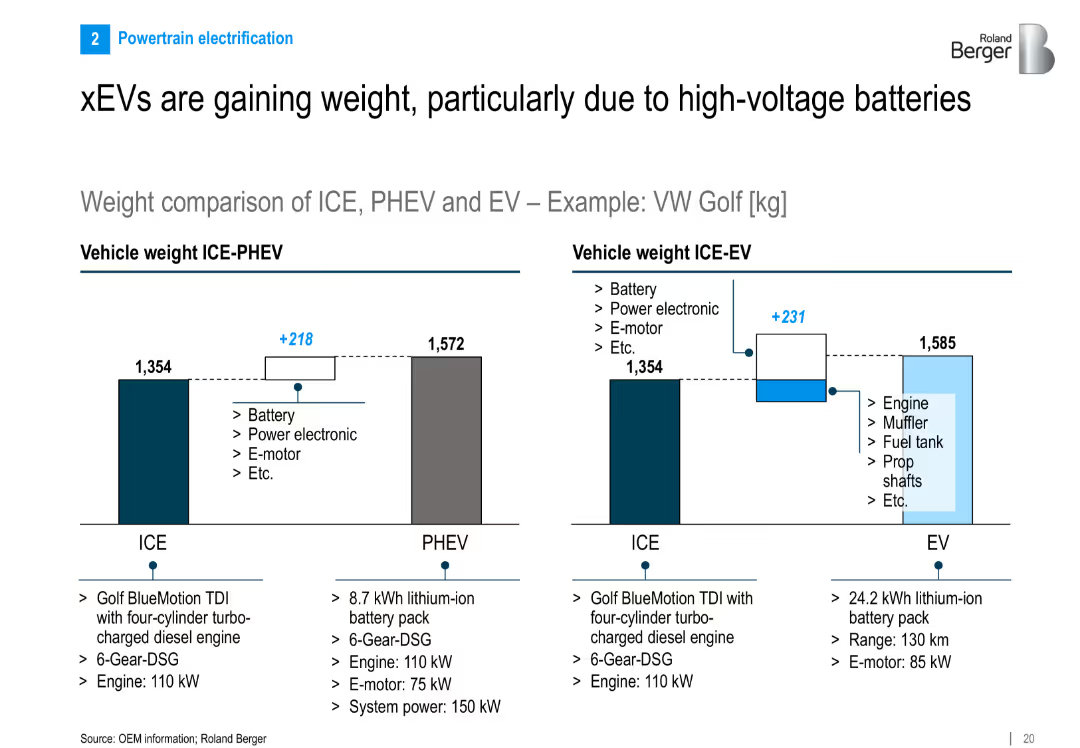
Side-by-side bar charts comparing weight of ICE, PHEV, and EV variants of VW Golf; includes breakdown of added components
Product and Service Analysis
Industrial & Manufacturing
Shows that electrified vehicles (PHEV, EV) are heavier than ICE vehicles due to components like batteries and motors. Uses VW Golf as an example to quantify weight differences and contributing components.
EV weight, PHEV, ICE, battery pack, vehicle mass, VW Golf, e-motor, power electronics
false
Product and Service Analysis
Industrial & Manufacturing industrial-and-manufacturing
Multiple Chart
Roland Berger
View slide
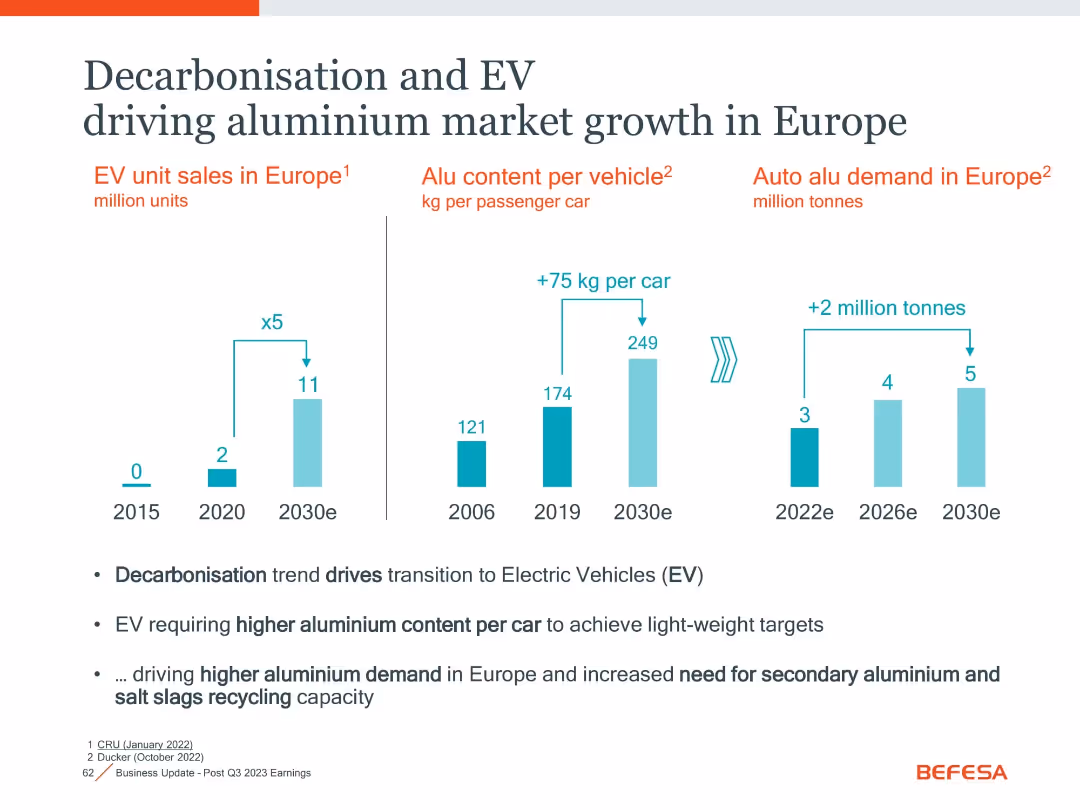
Three-column bar chart layout with annotations and summary bullet points below
Market Analysis and Trends
Industrial & Manufacturing
The slide illustrates how electric vehicle (EV) trends in Europe are increasing aluminium demand due to higher aluminium content per car and rising EV adoption.
EV, Aluminium, Market Growth, Europe, Decarbonisation, Lightweighting
false
Market Analysis and Trends
Industrial & Manufacturing industrial-and-manufacturing
Mixed Chart
Goldman Sachs
View slide
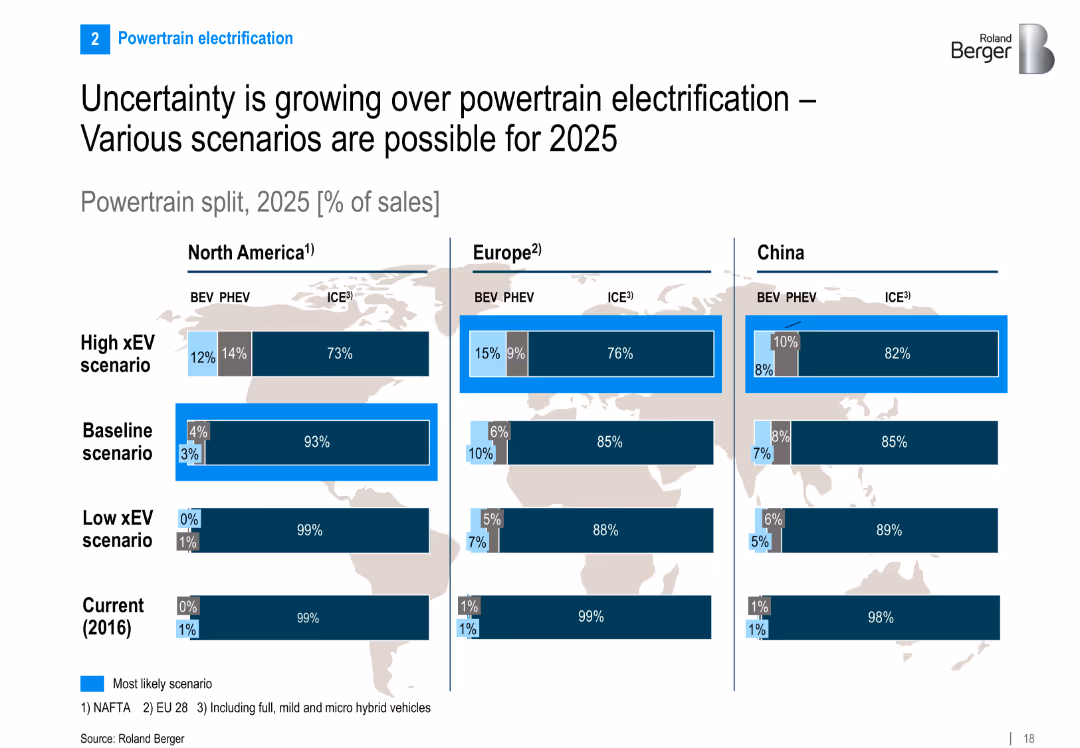
Split layout: three region-specific bar charts (NA, EU, China) showing 2025 powertrain split scenarios (BEV, PHEV, ICE); scenarios from low to high xEV adoption
Strategic Planning
Industrial & Manufacturing
Presents three scenarios for EV adoption across regions by 2025, showing potential market splits between ICEs, PHEVs, and BEVs. Highlights uncertainty in electrification growth and regional variation in expectations.
EV, PHEV, ICE, powertrain, xEV scenario, electrification, 2025 forecast, North America, Europe, China
false
Strategic Planning
Industrial & Manufacturing industrial-and-manufacturing
Multiple Chart
Roland Berger
View slide
Contains a line graph comparing TCO for electric and diesel buses over mileage.
Investment Analysis
Financial Services
Analyzes how long-term savings from EVs can offset higher initial costs.
EV, TCO, cost savings, electric buses, diesel comparison
false
Investment Analysis
Financial Services financial-services
Mixed Chart
PwC/Strategy&
View slide
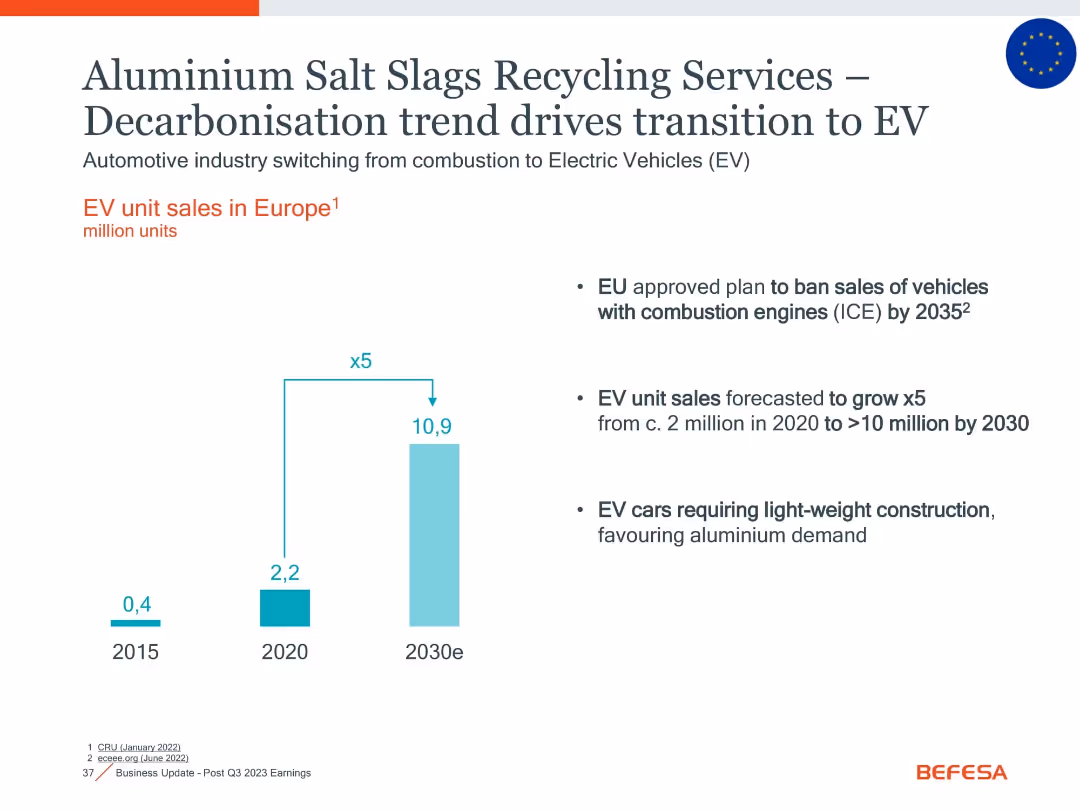
Clean, minimal layout with vertical EV unit sales bar chart; includes text highlights and EU policy info
Market Analysis and Trends
Government & Public Sector
Illustrates Europe’s rapid EV growth and policy bans on ICEs by 2035. Emphasizes increased demand for aluminium recycling driven by lightweight EV construction, positioning Befesa within this market transition.
EV, aluminium, recycling, EU, combustion ban, electrification, lightweight, vehicle sales
false
Market Analysis and Trends
Government & Public Sector government-and-public-sector
Mixed Chart
Goldman Sachs
View slide
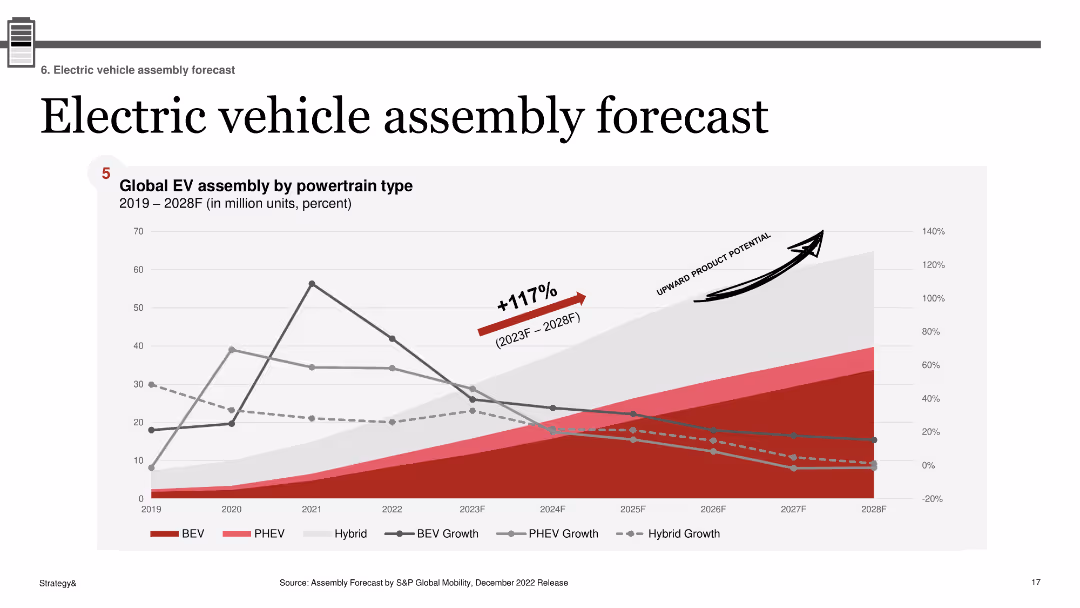
A line chart showing the global EV assembly by powertrain type from 2019 to 2028, with projected growth percentages for various EV types.
Market Analysis and Trends
Transportation & Logistics
Projects global electric vehicle assembly growth across different powertrain types, indicating a significant upward trend through 2028.
EV, assembly, global, forecast, powertrain, growth, market, BEV, PHEV
false
Market Analysis and Trends
Transportation & Logistics transportation-and-logistics
Single Chart
PwC/Strategy&
Previous
Loading...
Hold On!
We are searching in our database
If nothing, comes up, please try different filters!
Column Chart
Heatmap
Chevron
Org Chart
Infographic
Callouts
Timeline
List
Graphic
Picture
Process Flow
Diagram
Paragraph
Map
Table
Framework
Subtitle
Takeaway Box
Icon
Other Chart
Radar Chart
Waterfall Chart
Mekko Chart
Pie Chart
Scatter Plot
Line Chart
Bar chart
Bullet points
Create a FREE account to continue browsing
Receive Instant Access to 1,000+ slides from companies like McKinsey, Google, and Goldman Sachs
First Name
Last Name
Email
Password
I agree to all
Terms & Privacy Policy
Thank you! Your submission has been received!
Oops! Something went wrong while submitting the form.
Have an account?
Sign in
Upgrade to PRO to Save slides
Advanced Search and Filters
Access to 15,000+ slides
Access to Category Pages
Save/Bookmark Slides
PowerPoint Template Library
Pick a Plan
MONTHLY
$12/month
Billed every month, Cancel anytime.
YEARLY
$9/year
Billed $108 annually, Cancel anytime.
Checkout for $12/month
Checkout for $108/yr
Secured by Stripe | AES-256 bit encryption