My Account
My Slides
Search by Category
Templates
View All Templates
Download Template Slides
Leave Feedback
Login
Logout
Get Started
Browse all Slides
Browse all Slides
Create a FREE Account
Instant access to 1,000+ real slides from top companies like McKinsey, BCG, Goldman Sachs, Google and many more!
First Name
Last Name
Email
Password
I agree to all
Terms & Privacy Policy
Thank you! Your submission has been received!
Oops! Something went wrong while submitting the form.
Have an account?
Sign in
Spark Your Next Big Idea with New Presentation Templates
VIEW ALL Templates
Welcome,
Welcome
PRO
Show Featured Only
Checkbox 8
Companies
Mckinsey
Bain
BCG
EY
Deloitte
Accenture
PwC/Strategy&
JP Morgan
Goldman Sachs
Morgan Stanley
Citigroup
Deutsche Bank
Barclays
LEK
KPMG
Kearney
Oliver Wyman
Booz Allen Hamilton
Gartner
IPSOS
Nielsen
Slide type
Text Only
Linear Flow
Vertical Flow
Single Chart
Header Horizontal
Mixed Chart
Header Vertical
Pillar
Multiple Chart
Graphic
Agenda
Title
Table
Framework
Industry
Technology & Software
Artificial Intelligence
Financial Services
Retail & E-commerce
Consumer Goods
Industrial & Manufacturing
Transportation & Logistics
Telecommunications
Real Estate & Construction
Hospitality & Tourism
Professional Services
Education & Training
Media & Entertainment
Agriculture & Food Production
Healthcare & Pharmaceuticals
Environmental Services & Sustainability
Government & Public Sector
Use Case
Mergers and Acquisitions
Performance Metrics and KPIs
Client Case Studies
Competitive Landscape
Corporate Finance and Valuation
Product and Service Analysis
Customer and Market Segmentation
Organizational Structure and Change
Industry Overview
Regulatory and Compliance
Risk Assessment and Management
Investment Analysis
Organizational Structure and Change
Human Resources and Talent Management
Financial Performance
Market Analysis and Trends
Sales and Business Development
Human Resources and Talent Management
Clear all
Thank you! Your submission has been received!
Oops! Something went wrong while submitting the form.
Tag
View slide
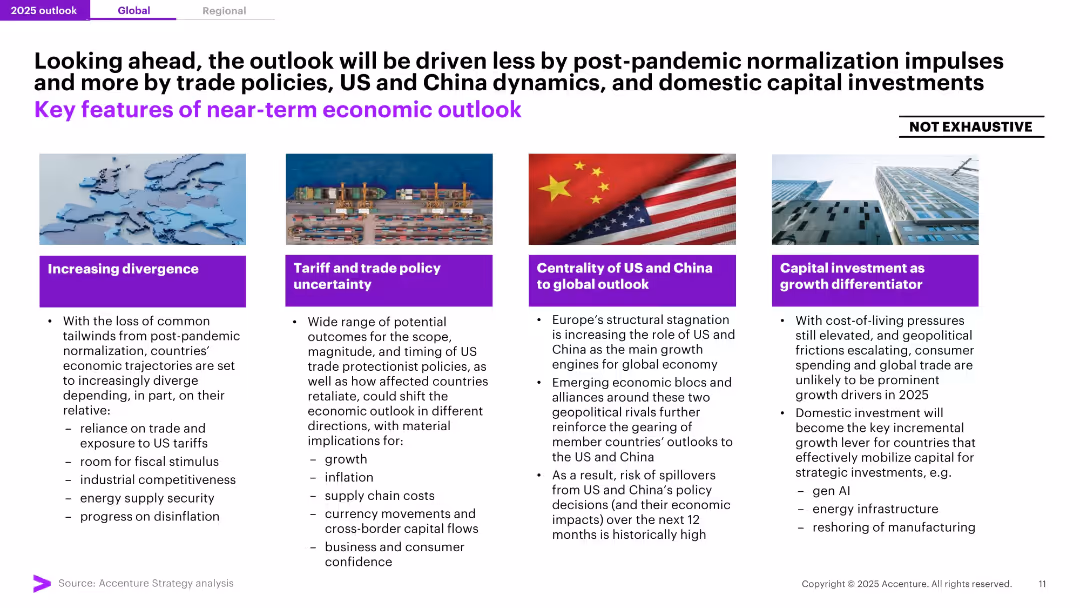
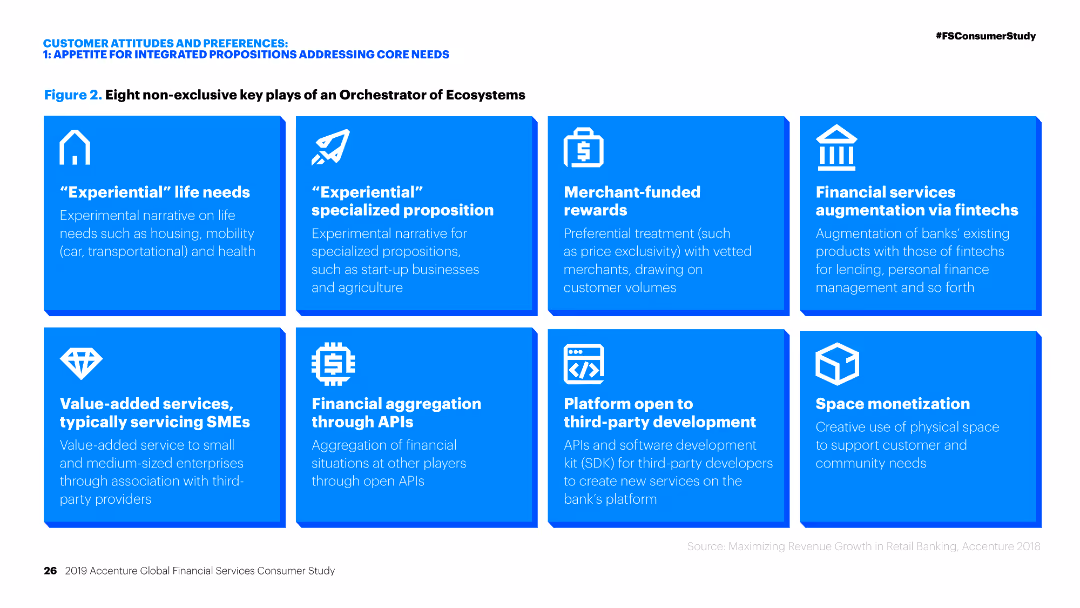
Four-panel layout with bold iconography and brief bulleted points below themed headers in purple. High-contrast layout with minimal clutter.
Strategic Planning
Professional Services
The slide summarizes the key drivers of the 2025 economic outlook: divergence in national growth paths, tariff uncertainty, US-China dynamics, and the growing importance of domestic capital investments. Highlights risk and opportunity areas shaping near-term global economic conditions.
Economic Outlook, Trade, US-China, Investment, Divergence, Tariffs, 2025, Drivers, Strategy, Growth Differentiators
false
Strategic Planning
Professional Services professional-services
Pillar
Accenture
View slide
Scatter plots and data points analyzing the correlation between local infection levels, consumer spending, mobility, and government restrictiveness in the U.S.
Risk Assessment and Management
Government & Public Sector
Investigates the link between virus containment levels and economic recovery metrics like consumer spending and mobility in the U.S.
Economic Recovery, Consumer Spending, Government Restrictions, COVID-19
true
Risk Assessment and Management
Government & Public Sector government-and-public-sector
Multiple Chart
BCG
View slide
The slide is text-heavy with a series of bullet points on the left, complemented by labeled graphs on the right. The design is minimalist with a white background and uses contrasting black and blue text for emphasis.
Risk Assessment and Management
Financial Services
Outlines potential economic scenarios resulting from COVID-19's spread, public health responses, and policy decisions. It's a tool for assessing risks and planning for various outcomes in the financial sector.
Economic Scenarios, COVID-19, Health Response
false
Risk Assessment and Management
Financial Services financial-services
Table
McKinsey
View slide
Features a column chart tracking economic outlook over several years with quotes from industry leaders reflecting on the future.
Market Analysis and Trends
Professional Services
Analyzes historical and projected economic sentiment in various sectors, providing insights into industry expectations and strategic planning.
Economic Trends, Predictions, Industry Leaders, Market Stability, Conservative Predictions
false
Market Analysis and Trends
Professional Services professional-services
Mixed Chart
Bain
View slide
Shows line charts illustrating economic impact under low and high growth scenarios. Includes text bullet points explaining the benefits and investment impact on the economy.
Market Analysis and Trends
Energy & Utilities
Discusses how new oil and gas investments will stimulate economic activity, with detailed projections of the economic uplift and GDP impact under different growth scenarios.
Economic Uplift, GDP Impact, Oil and Gas Investment, Western Australia, Low Growth, High Growth, Economic Activity, Construction Phase
false
Market Analysis and Trends
Energy & Utilities energy-and-utilities
Mixed Chart
EY
View slide
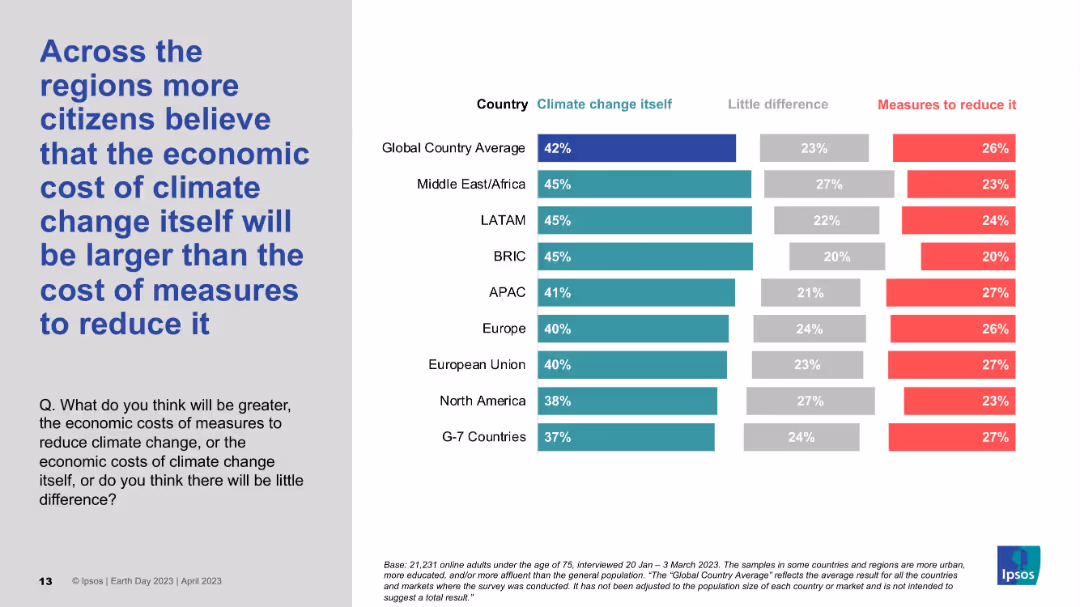
Regional-level horizontal bar chart with three categories: climate change, little difference, and reduction cost; grey and blue.
Market Analysis and Trends
Environmental Services & Sustainability
The slide analyzes regional sentiment on whether the economic impact of climate change is greater than the cost of addressing it. In all major regions except Japan, more respondents see climate change itself as costlier. Global average aligns with this perception at 42%.
Economic cost, Climate change, Regional comparison, Public perception, Ipsos
false
Market Analysis and Trends
Environmental Services & Sustainability environmental-services-and-sustainability
Mixed Chart
IPSOS
View slide
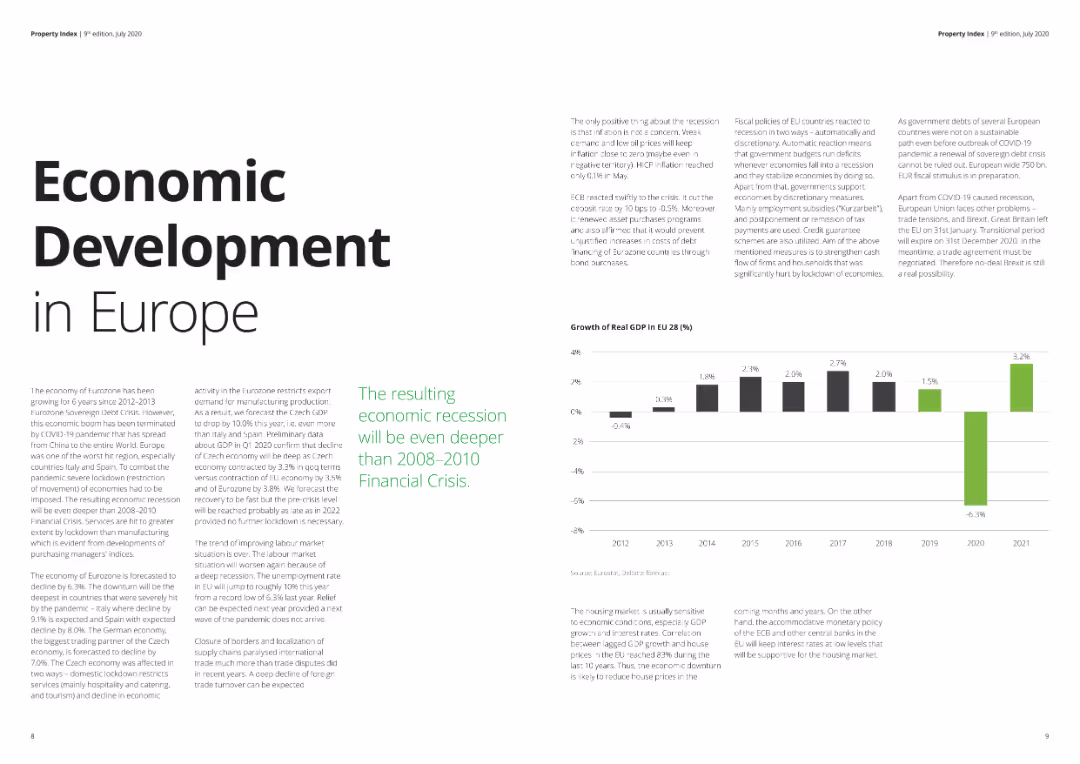
The slide features text detailing economic conditions in Europe, supported by a column chart showing GDP growth rates from 2012 to 2021. The layout is clean with ample white space, suitable for general audiences. Visual complexity is basic.
Market Analysis and Trends
Real Estate & Construction
Provides an overview of economic development in Europe, discussing the impact of the COVID-19 pandemic on GDP growth and the expected economic recession. Useful for understanding broader economic trends and their implications on various sectors.
Economic development, Europe, GDP, recession, COVID-19
false
Market Analysis and Trends
Real Estate & Construction real-estate-and-construction
Mixed Chart
Deloitte
View slide
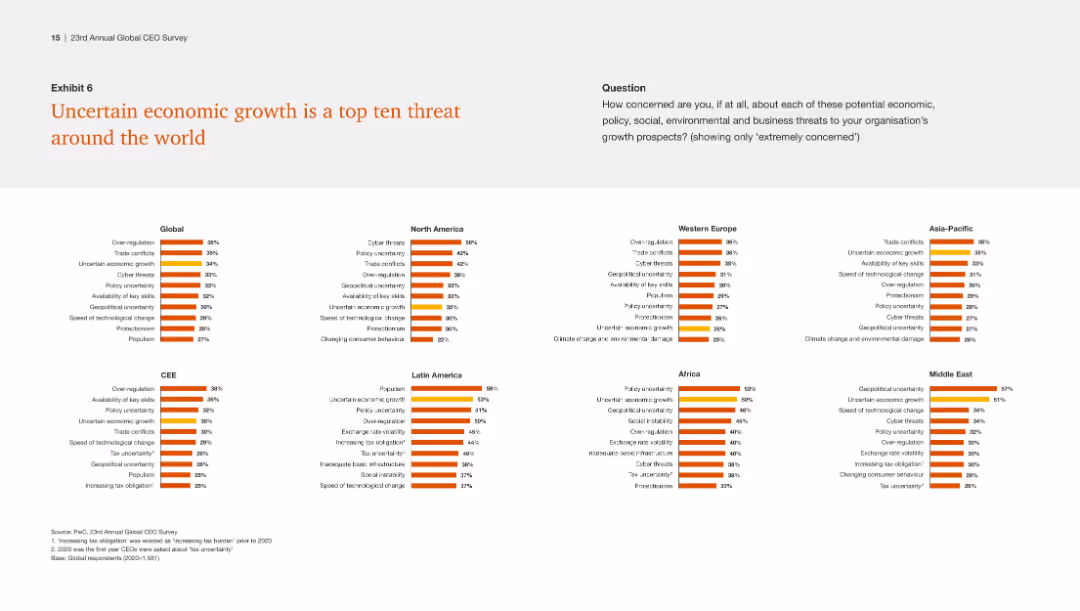
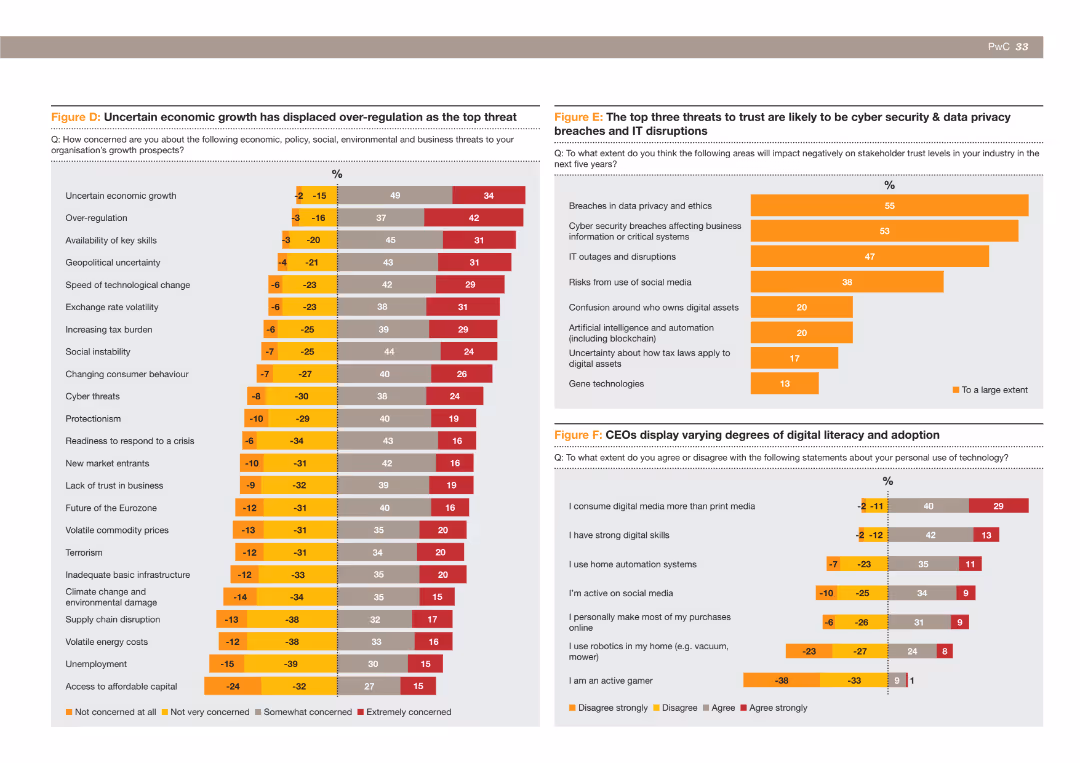
This slide features multiple bar charts, comparing the prevalence of economic threats across global regions. Each region's chart has a distinct set of data points, with color coding to distinguish between different concerns. The layout is clean, with a clear distinction between charts and descriptive text.
Market Analysis and Trends
Financial Services
This slide presents a visual comparison of various economic threats perceived globally and in specific regions. It can be used to understand regional concerns in economic growth and policy, informing strategic decisions in global business operations.
Economic growth, Risk assessment, Policy uncertainty, Cyber threats, Geopolitical instability, Trade conflicts
false
Market Analysis and Trends
Financial Services financial-services
Multiple Chart
PwC/Strategy&
View slide
The slide includes multiple small column charts showing the top threats by region, emphasizing uncertain economic growth as a consistent top threat globally.
Risk Assessment and Management
Financial Services
This slide identifies uncertain economic growth as a prevalent threat across various regions, highlighting the need for global strategies to mitigate this risk.
Economic growth, global threats, regional analysis, uncertainty, strategy
false
Risk Assessment and Management
Financial Services financial-services
Multiple Chart
PwC/Strategy&
View slide
The slide includes a bar chart illustrating the top threats to organizational growth prospects, with uncertain economic growth now seen as a bigger threat than over-regulation.
Risk Assessment and Management
Financial Services
This slide shows the changing perceptions of CEOs regarding the top threats to growth, highlighting that uncertain economic growth is now considered a more significant threat than over-regulation and other issues like tax burden and geopolitical uncertainty.
Economic growth, over-regulation, threats, organizational growth, CEOs, financial services
false
Risk Assessment and Management
Financial Services financial-services
Multiple Chart
PwC/Strategy&
View slide
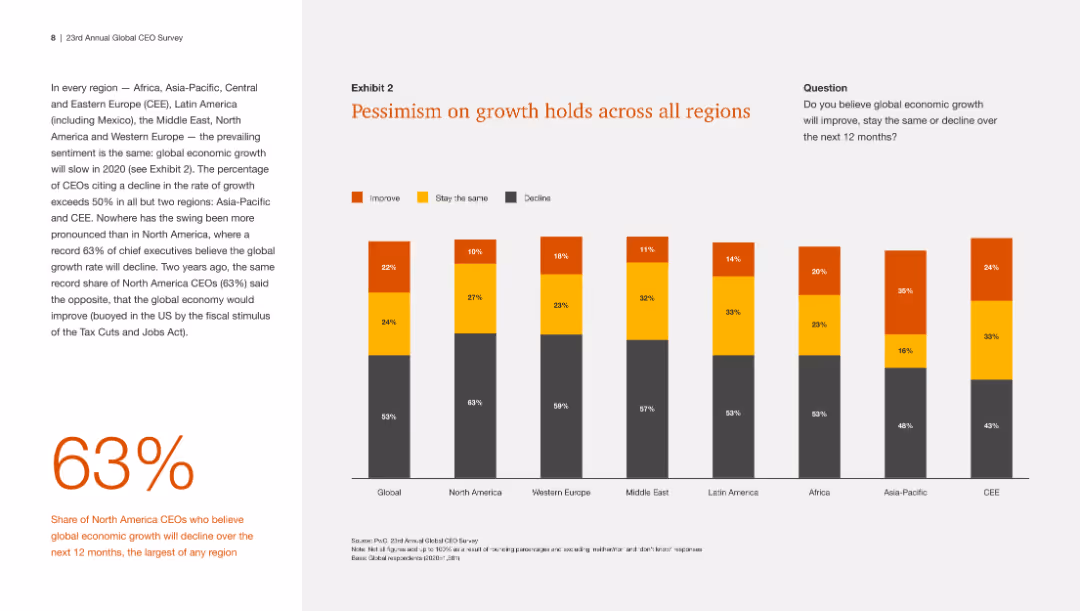
The slide features a column chart showing pessimism about economic growth across different regions, with global percentages of improve, stay the same, and decline highlighted.
Market Analysis and Trends
Financial Services
This slide illustrates the widespread pessimism about economic growth across various regions, with over half of CEOs in most areas expecting a decline.
Economic growth, pessimism, global, regional, outlook
false
Market Analysis and Trends
Financial Services financial-services
Mixed Chart
PwC/Strategy&
View slide
Bar graph displaying Indonesia's economic growth by sector, paired with bullet points highlighting the ICT sector's resilience during COVID-19.
Risk Assessment and Management
Technology & Software
Evaluates the performance of various economic sectors, emphasizing the impact of COVID-19 on the ICT sector which has seen growth.
Economic growth, sectors, COVID-19, ICT, Indonesia, resilience, performance
false
Risk Assessment and Management
Technology & Software technology-and-software
Mixed Chart
Kearney
View slide
The slide presents a table with various economic indicators for different countries, including PMI, industrial production, business confidence, and more, with color-coded performance indicators.
Market Analysis and Trends
Financial Services
A comprehensive overview of economic health indicators for multiple countries, highlighting strengths and weaknesses in areas like manufacturing, business confidence, and inflation rates.
Economic health, PMI, business confidence, industrial production, country comparison
false
Market Analysis and Trends
Financial Services financial-services
Table
Accenture
View slide
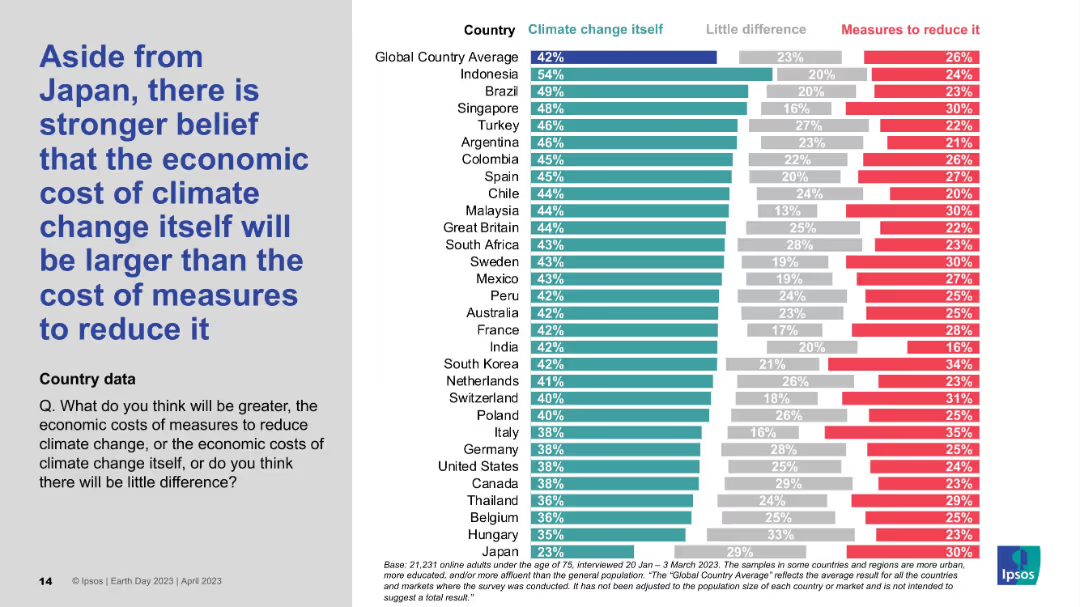
Detailed country-by-country horizontal bar chart; shows comparative belief in economic cost of climate change vs. action.
Market Analysis and Trends
Environmental Services & Sustainability
This chart shows that, aside from Japan, most countries believe the economic cost of inaction on climate change exceeds the cost of mitigation. Indonesia, Brazil, and Singapore lead this sentiment, while Japan stands out for its skepticism.
Economic impact, Climate cost, Mitigation, Global survey, Ipsos data
false
Market Analysis and Trends
Environmental Services & Sustainability environmental-services-and-sustainability
Mixed Chart
IPSOS
View slide
Features line graphs and column charts detailing economic indicators, interest rates, and credit cycle concerns.
Risk Assessment and Management
Financial Services
Examines the potential cyclical headwinds faced by the industry and the economic growth forecasts.
Economic indicators, interest rates, credit cycle, economic growth, cyclical headwinds
false
Risk Assessment and Management
Financial Services financial-services
Multiple Chart
JP Morgan
View slide
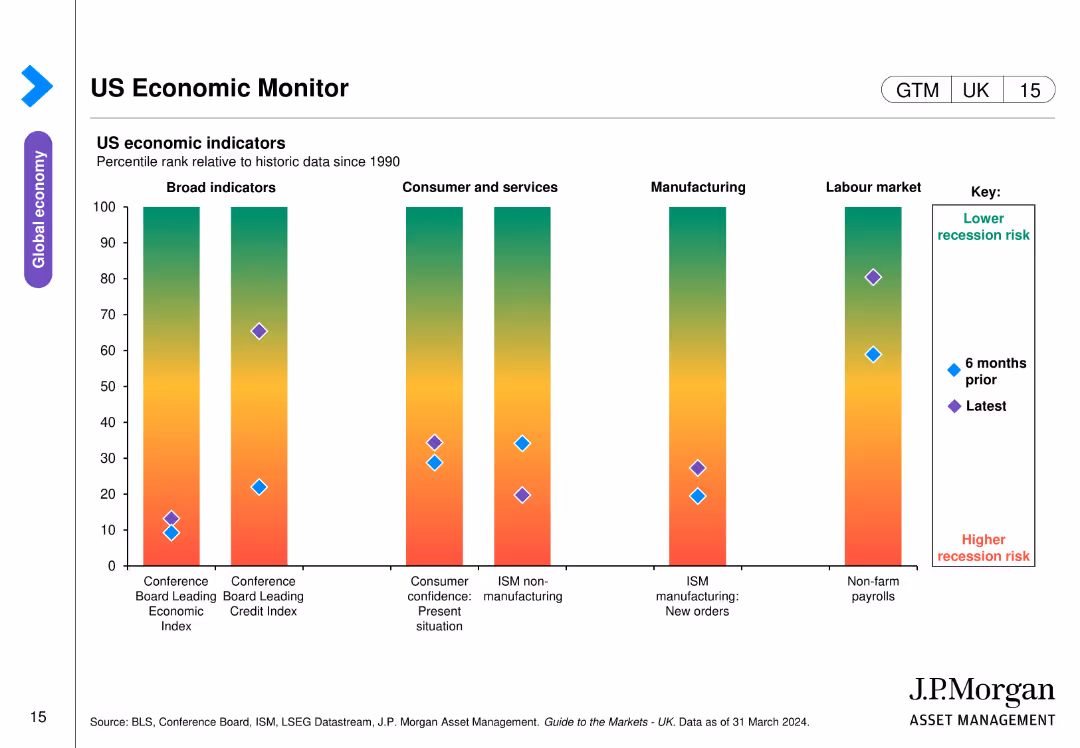
The slide shows a bar chart with percentile ranks of various US economic indicators (Broad indicators, Consumer and services, Manufacturing, Labour market) relative to historic data since 1990, with color-coded risk levels.
Market Analysis and Trends
Financial Services
This slide monitors key US economic indicators, helping assess recession risks and economic health, essential for making informed financial and investment decisions.
Economic indicators, recession risk, US economy, market analysis, risk assessment
false
Market Analysis and Trends
Financial Services financial-services
Single Chart
JP Morgan
View slide
Various charts including bar and pie charts depicting firms' confidence levels, challenges, and growth expectations.
Market Analysis and Trends
Financial Services
This slide assesses firms' confidence in the economic outlook for 2023, highlighting major concerns such as supply chain issues, tight margins, and growth prospects.
Economic outlook, firms' confidence, supply chain, margins, growth, challenges, expectations, trends, 2023
false
Market Analysis and Trends
Financial Services financial-services
Multiple Chart
EY
View slide
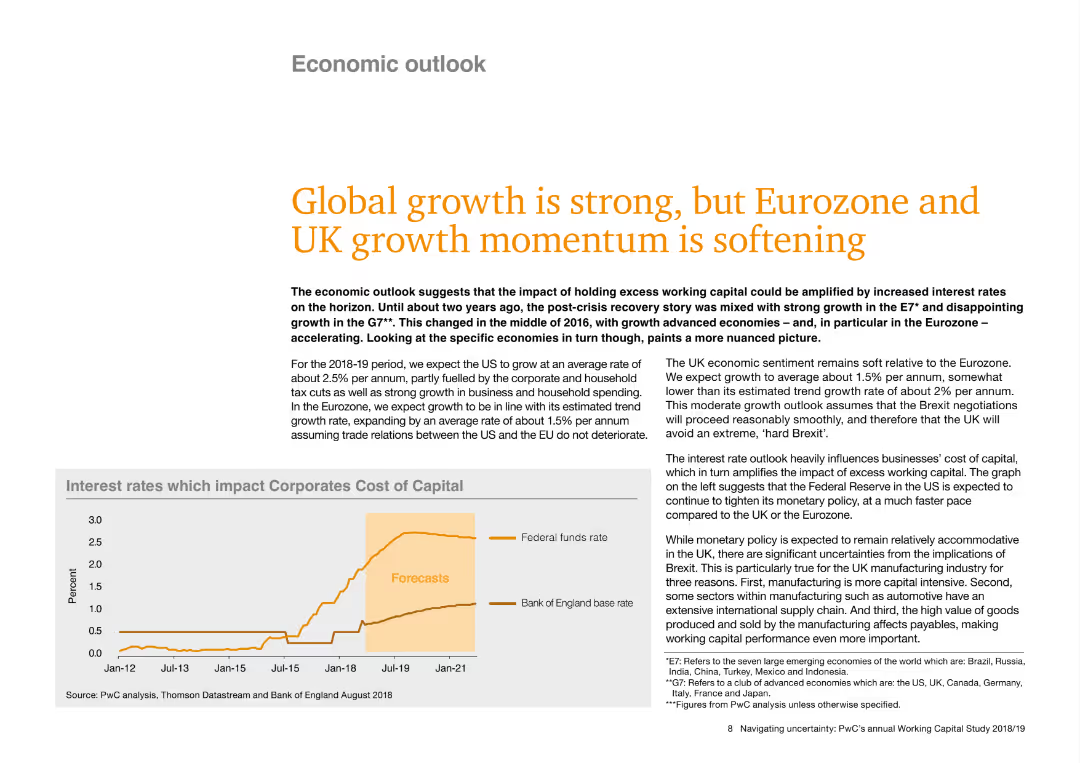
The slide features a main title in large text, followed by several paragraphs of detailed content. A line chart at the bottom shows interest rates impacting corporate cost of capital from 2012 to 2021. Two lines represent the Federal funds rate and Bank of England base rate.
Market Analysis and Trends
Financial Services
The slide discusses the economic outlook, highlighting strong global growth with softening momentum in the Eurozone and UK. It predicts growth rates for the US, Eurozone, and UK, and discusses the impact of interest rates on corporate costs.
Economic outlook, interest rates, US growth, UK growth, Eurozone, corporate cost, Federal funds rate, Bank of England rate
false
Market Analysis and Trends
Financial Services financial-services
Mixed Chart
PwC/Strategy&
View slide
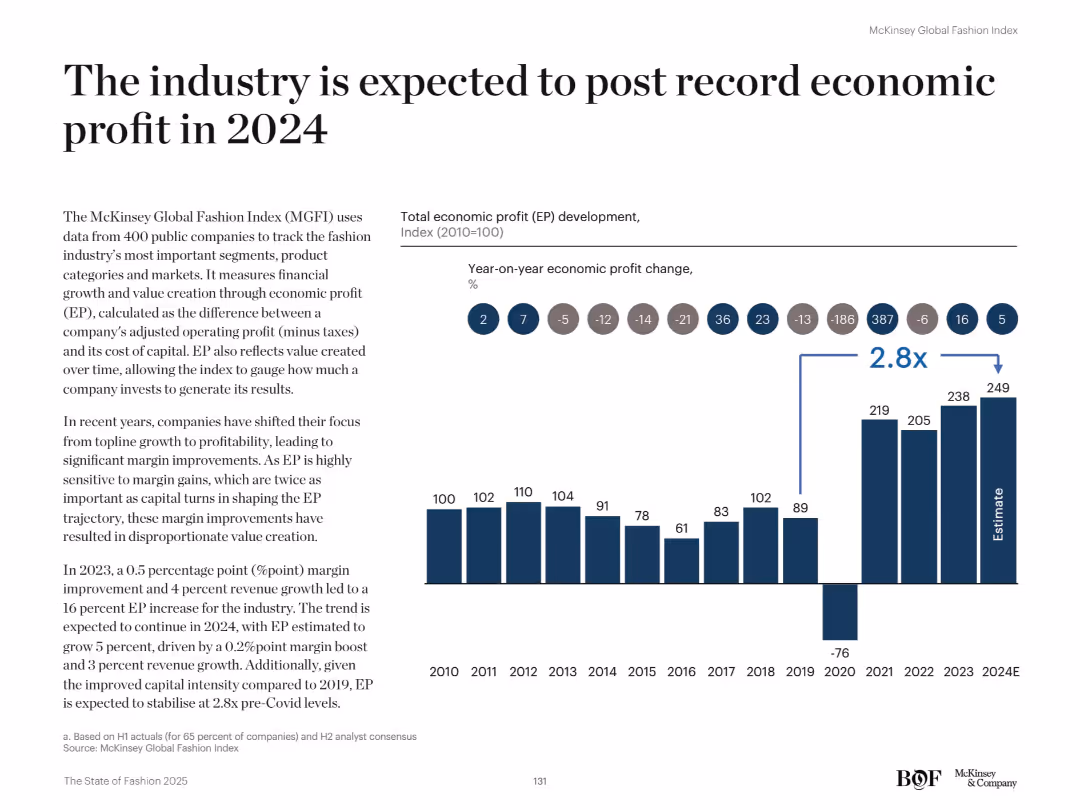
Left-aligned explanatory text with a right-side bar chart showing economic profit (EP) from 2010 to 2024E.
Financial Performance
Retail & E-commerce
The slide forecasts record-high economic profit (EP) in 2024 for the fashion industry, highlighting a 2.8x increase over pre-pandemic levels. It attributes this to margin improvements and improved capital intensity despite slower topline growth.
Economic profit, EP, financial growth, fashion index, profitability, capital intensity, 2024 forecast, margin gains, industry outlook, revenue
false
Financial Performance
Retail & E-commerce retail-and-e-commerce
Mixed Chart
McKinsey
View slide
Three panels with economic indicators, energy sector data, and doing business metrics. Each panel uses simple arrows and text to convey changes.
Market Analysis and Trends
Financial Services
This slide highlights the post-pandemic economic recovery trends, focusing on inflation, energy sector performance, and doing business metrics.
Economic recovery, inflation, energy sector, doing business, indicators, post-pandemic, trends, metrics, analysis, performance
false
Market Analysis and Trends
Financial Services financial-services
Pillar
EY
View slide
Three column charts depicting different economic scenarios with green, yellow, and blue colors, labeled as Steep but Short-lived Downturn, Prolonged Pandemic, and Economic Depression.
Strategic Planning
Financial Services
The slide presents three potential economic scenarios for modeling, with varying assumptions about the duration and severity of the economic downturn globally and locally.
Economic scenarios, modeling, Canadian economy, global economy, duration, severity, downturn, Metro Vancouver
false
Strategic Planning
Financial Services financial-services
Multiple Chart
Deloitte
View slide
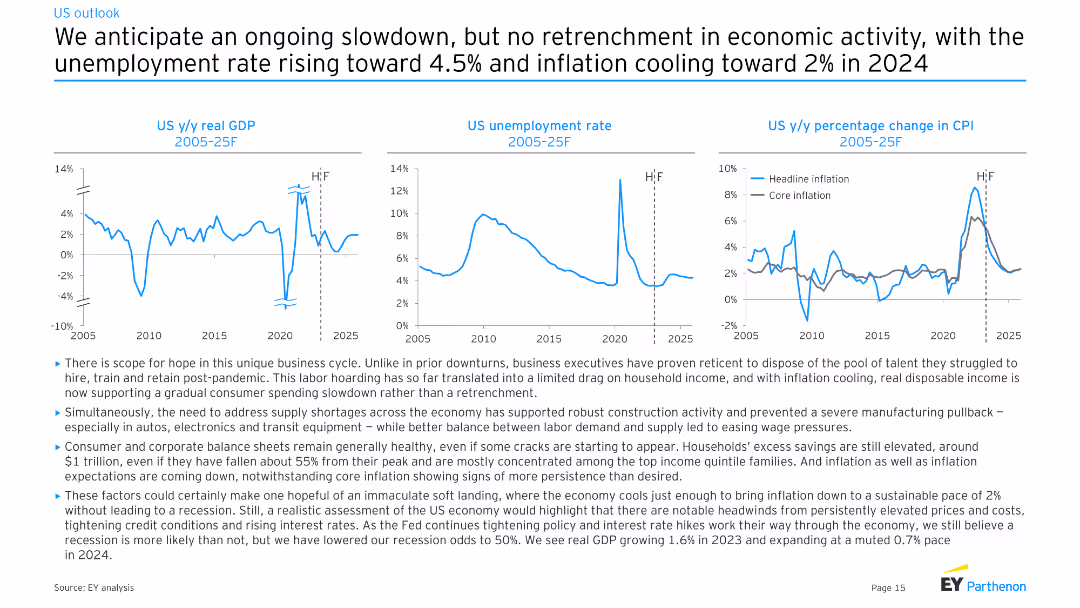
This slide includes three line charts showing US real GDP growth, unemployment rate, and percentage change in CPI from 2005 to 2025. The text box below discusses factors influencing the economic slowdown and labor market.
Market Analysis and Trends
Financial Services
The slide forecasts an economic slowdown with rising unemployment and cooling inflation in the US. It provides insights into factors like labor hoarding, consumer spending, and inflation trends, suggesting a soft landing for the economy.
Economic slowdown, GDP growth, unemployment rate, inflation trends, labor market, US economy, financial forecast, EY analysis, consumer spending
false
Market Analysis and Trends
Financial Services financial-services
Multiple Chart
EY
View slide
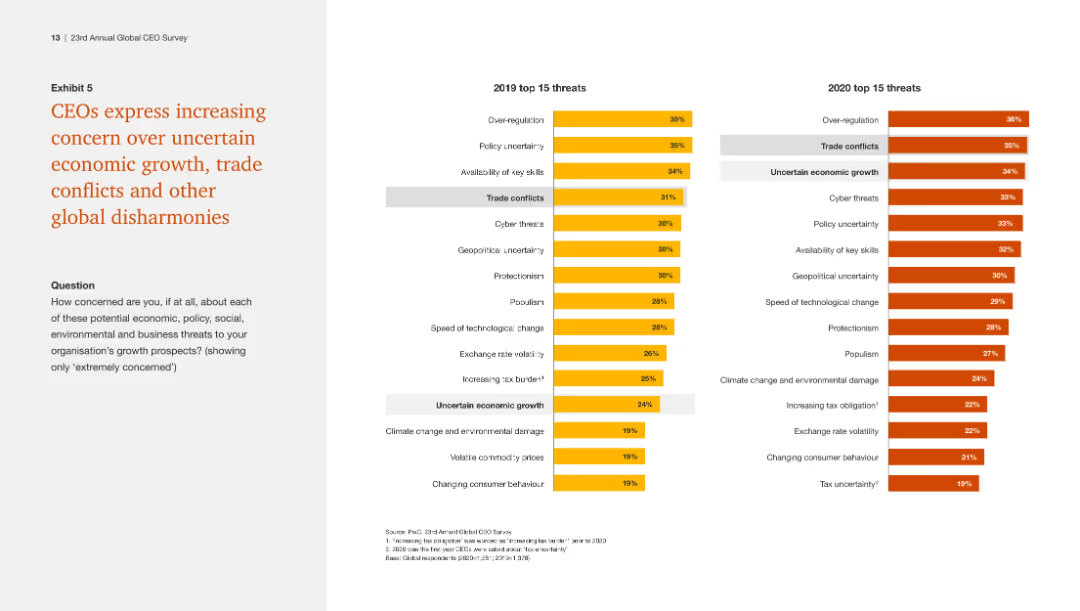
The slide features two column charts comparing the top 15 threats for CEOs in 2019 and 2020, with over-regulation and trade conflicts topping the lists in both years.
Risk Assessment and Management
Financial Services
This slide highlights increasing concerns among CEOs about various economic and policy threats, with over-regulation and trade conflicts remaining top issues over two years.
Economic threats, trade conflicts, over-regulation, CEO concerns, policy issues
false
Risk Assessment and Management
Financial Services financial-services
Multiple Chart
PwC/Strategy&
View slide
Contains multiple gears representing different economic indicators like unemployment rate, inflation, and GDP growth, alongside a map highlighting Namibia's geographical context.
Market Analysis and Trends
Government & Public Sector
Offers a comprehensive overview of Namibia's key economic indicators as of January 2018, useful for understanding the broader economic climate and its potential impacts on policy and investment decisions.
Economic, Statistics, GDP, Inflation, Map
false
Market Analysis and Trends
Government & Public Sector government-and-public-sector
Graphic
PwC/Strategy&
View slide
Grid layout listing eight key plays of an orchestrator of ecosystems.
Operational Efficiency
Financial Services
Overview of eight key strategies for financial services to enhance their ecosystem orchestration, focusing on experiential needs and financial services.
Ecosystem orchestration, financial services, key strategies, experiential needs, value-added services, fintech, APIs, platform development, space monetization
false
Operational Efficiency
Financial Services financial-services
Table
Accenture
View slide
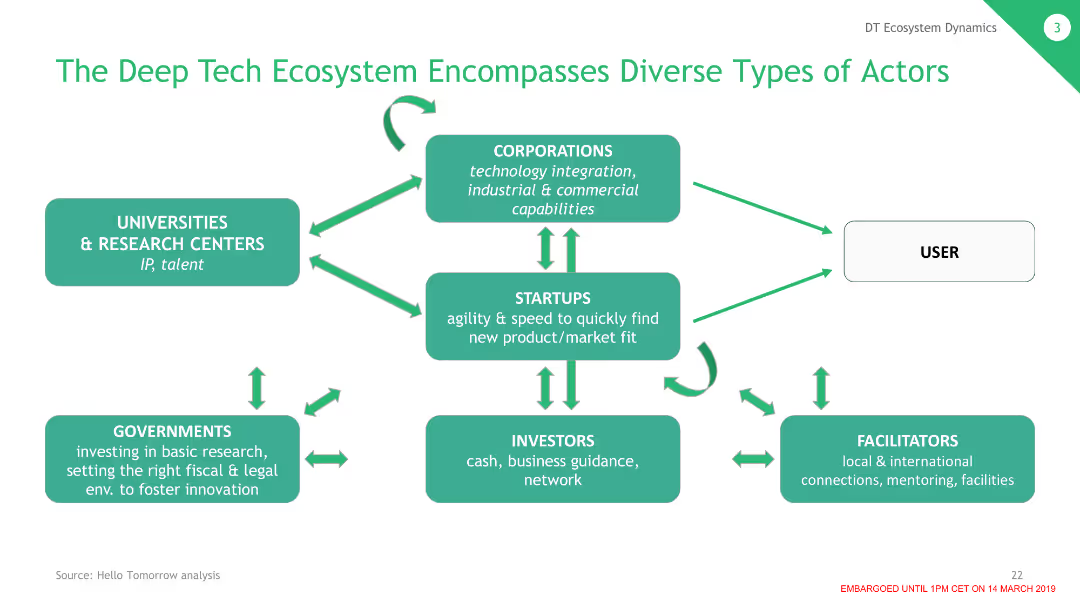
The slide features a flowchart with different types of actors in the deep tech ecosystem, including corporations, startups, investors, and governments, connected by arrows indicating interactions.
Strategic Planning
Technology & Software
This slide illustrates the deep tech ecosystem, showing the various actors and their roles in fostering innovation and technological advancements through collaboration and support.
Ecosystem, Actors, Deep Tech, Collaboration, Roles
false
Strategic Planning
Technology & Software technology-and-software
Single Chart
BCG
View slide
Circular flow diagram labeled "Chase MyHome" in the center, depicting the stages Explore, Buy, Manage. Annotations indicate various features and innovations introduced at each stage.
Technology and Digital Transformation
Financial Services
Describes the development of a unified ecosystem called Chase MyHome aimed at enhancing customer engagement and streamlining the mortgage process from property search to loan management.
Ecosystem, Engagement, Mortgage Process, Innovation, Home Buying, Loan Management
false
Technology and Digital Transformation
Financial Services financial-services
Framework
JP Morgan
View slide
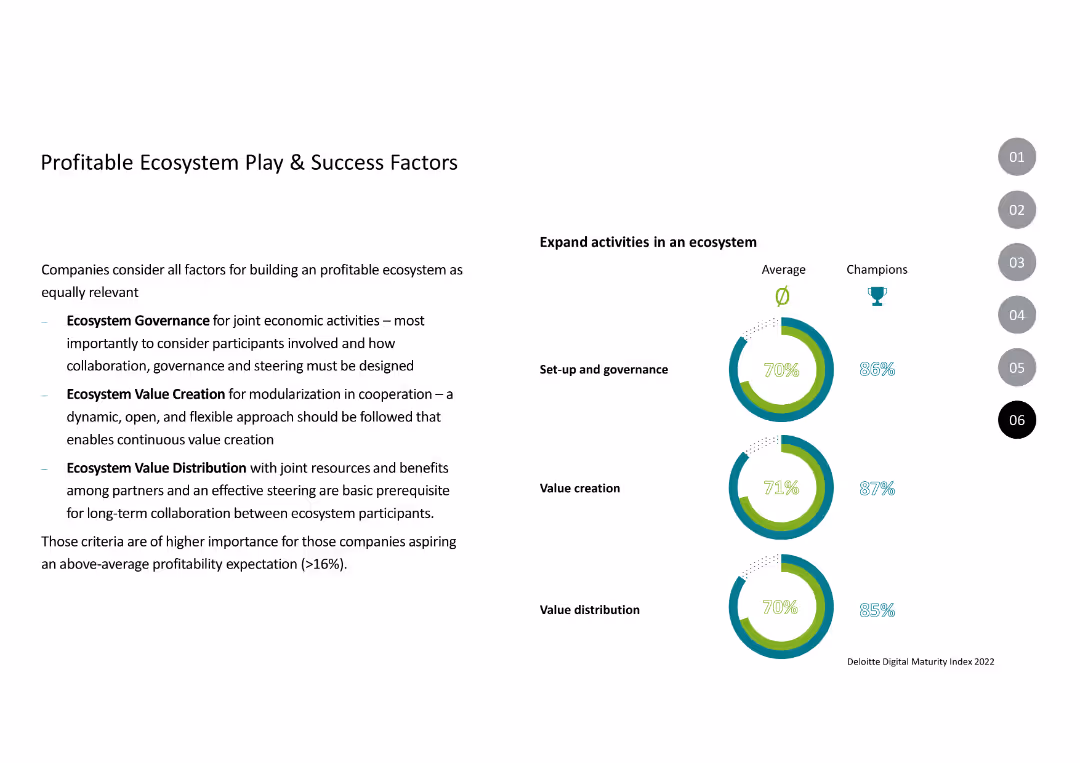
The slide has three donut charts comparing average and champion companies on set-up and governance, value creation, and value distribution. On the left, bullet points explain the importance of these factors for building a profitable ecosystem, supported by visual comparison.
Strategic Planning
Technology & Software
Explains the critical factors for building a profitable ecosystem, including governance, value creation, and value distribution. It highlights how champion companies excel in these areas compared to the average, aiming for above-average profitability.
Ecosystem, Governance, Value, Distribution, Planning
false
Strategic Planning
Technology & Software technology-and-software
Multiple Chart
Deloitte
View slide
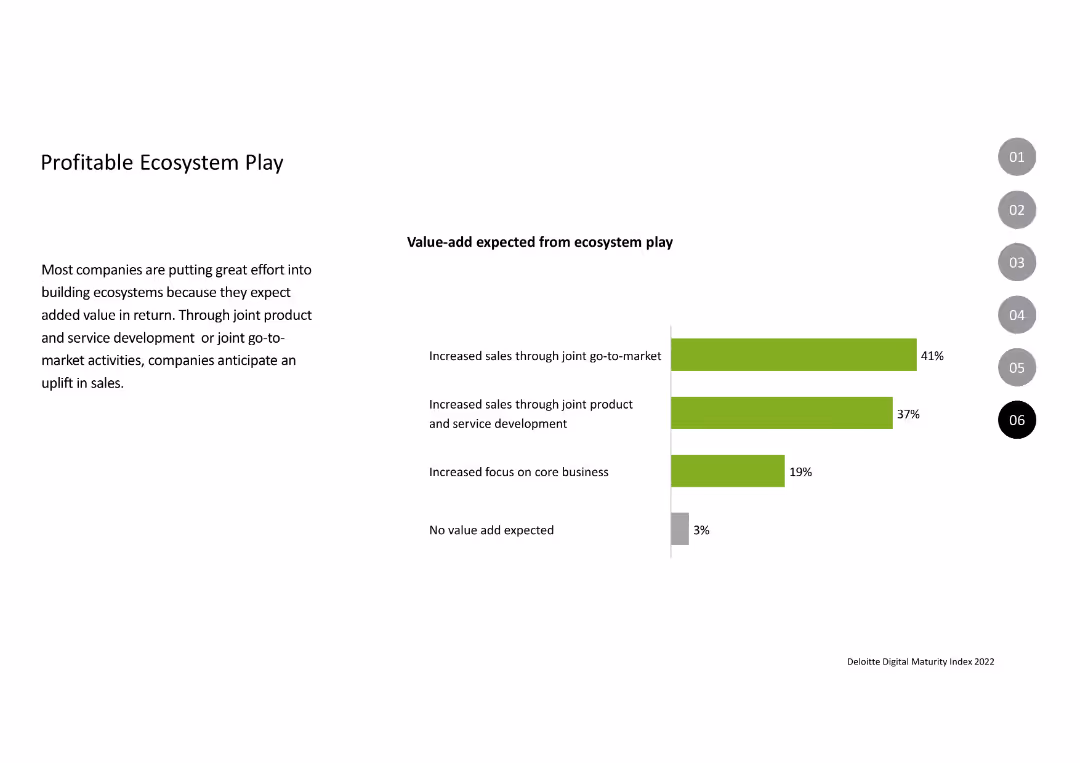
Contains a column chart displaying the expected value-add from ecosystem play, with bars in green and gray indicating percentages. The text on the left explains the rationale behind building ecosystems, highlighting benefits like increased sales and focus on core business.
Strategic Planning
Technology & Software
Describes the efforts companies are making to build ecosystems to enhance sales and focus on core business. The slide presents data on the anticipated value additions from joint go-to-market strategies and product development, with a small percentage expecting no value-add.
Ecosystem, Value-add, Sales, Development, Strategy
false
Strategic Planning
Technology & Software technology-and-software
Mixed Chart
Deloitte
View slide
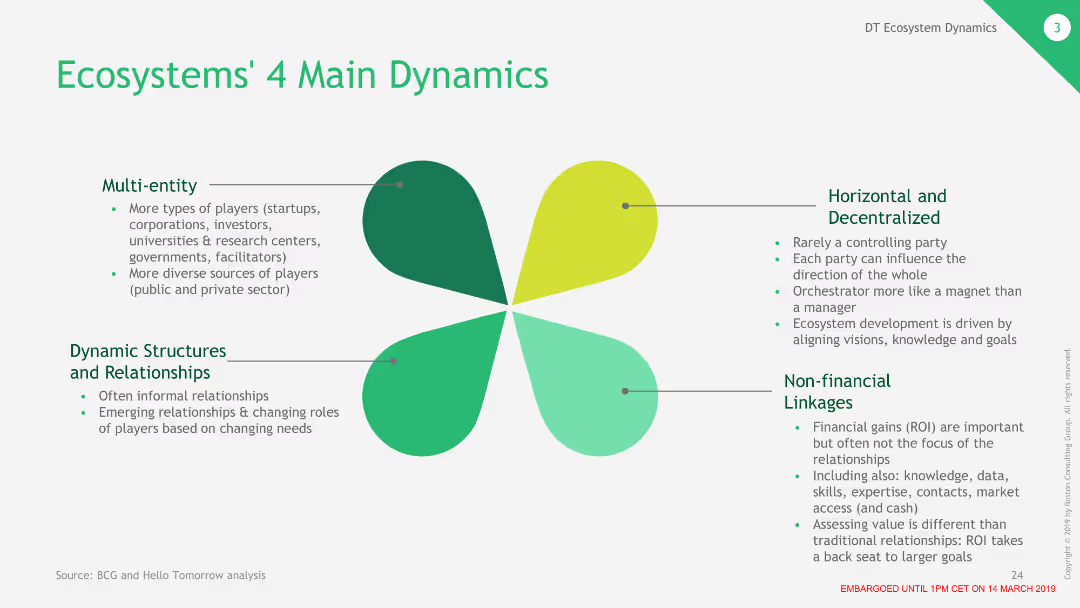
The slide features a four-leaf clover diagram, with each leaf representing one of the main dynamics of ecosystems: multi-entity, horizontal and decentralized, dynamic structures, and non-financial linkages.
Strategic Planning
Technology & Software
This slide outlines the four primary dynamics of ecosystems in deep tech, focusing on the variety of participants, decentralized nature, dynamic relationships, and importance of non-financial connections.
Ecosystems, Dynamics, Participants, Decentralized
false
Strategic Planning
Technology & Software technology-and-software
Framework
BCG
Previous
Loading...
Hold On!
We are searching in our database
If nothing, comes up, please try different filters!
Column Chart
Heatmap
Chevron
Org Chart
Infographic
Callouts
Timeline
List
Graphic
Picture
Process Flow
Diagram
Paragraph
Map
Table
Framework
Subtitle
Takeaway Box
Icon
Other Chart
Radar Chart
Waterfall Chart
Mekko Chart
Pie Chart
Scatter Plot
Line Chart
Bar chart
Bullet points
Create a FREE account to continue browsing
Receive Instant Access to 1,000+ slides from companies like McKinsey, Google, and Goldman Sachs
First Name
Last Name
Email
Password
I agree to all
Terms & Privacy Policy
Thank you! Your submission has been received!
Oops! Something went wrong while submitting the form.
Have an account?
Sign in
Upgrade to PRO to Save slides
Advanced Search and Filters
Access to 15,000+ slides
Access to Category Pages
Save/Bookmark Slides
PowerPoint Template Library
Pick a Plan
MONTHLY
$12/month
Billed every month, Cancel anytime.
YEARLY
$9/year
Billed $108 annually, Cancel anytime.
Checkout for $12/month
Checkout for $108/yr
Secured by Stripe | AES-256 bit encryption