My Account
My Slides
Search by Category
Templates
View All Templates
Download Template Slides
Leave Feedback
Login
Logout
Get Started
Browse all Slides
Browse all Slides
Create a FREE Account
Instant access to 1,000+ real slides from top companies like McKinsey, BCG, Goldman Sachs, Google and many more!
First Name
Last Name
Email
Password
I agree to all
Terms & Privacy Policy
Thank you! Your submission has been received!
Oops! Something went wrong while submitting the form.
Have an account?
Sign in
Spark Your Next Big Idea with New Presentation Templates
VIEW ALL Templates
Welcome,
Welcome
PRO
Show Featured Only
Checkbox 8
Companies
Mckinsey
Bain
BCG
EY
Deloitte
Accenture
PwC/Strategy&
JP Morgan
Goldman Sachs
Morgan Stanley
Citigroup
Deutsche Bank
Barclays
LEK
KPMG
Kearney
Oliver Wyman
Booz Allen Hamilton
Gartner
IPSOS
Nielsen
Slide type
Text Only
Linear Flow
Vertical Flow
Single Chart
Header Horizontal
Mixed Chart
Header Vertical
Pillar
Multiple Chart
Graphic
Agenda
Title
Table
Framework
Industry
Technology & Software
Artificial Intelligence
Financial Services
Retail & E-commerce
Consumer Goods
Industrial & Manufacturing
Transportation & Logistics
Telecommunications
Real Estate & Construction
Hospitality & Tourism
Professional Services
Education & Training
Media & Entertainment
Agriculture & Food Production
Healthcare & Pharmaceuticals
Environmental Services & Sustainability
Government & Public Sector
Use Case
Mergers and Acquisitions
Performance Metrics and KPIs
Client Case Studies
Competitive Landscape
Corporate Finance and Valuation
Product and Service Analysis
Customer and Market Segmentation
Organizational Structure and Change
Industry Overview
Regulatory and Compliance
Risk Assessment and Management
Investment Analysis
Organizational Structure and Change
Human Resources and Talent Management
Financial Performance
Market Analysis and Trends
Sales and Business Development
Human Resources and Talent Management
Clear all
Thank you! Your submission has been received!
Oops! Something went wrong while submitting the form.
Tag
View slide
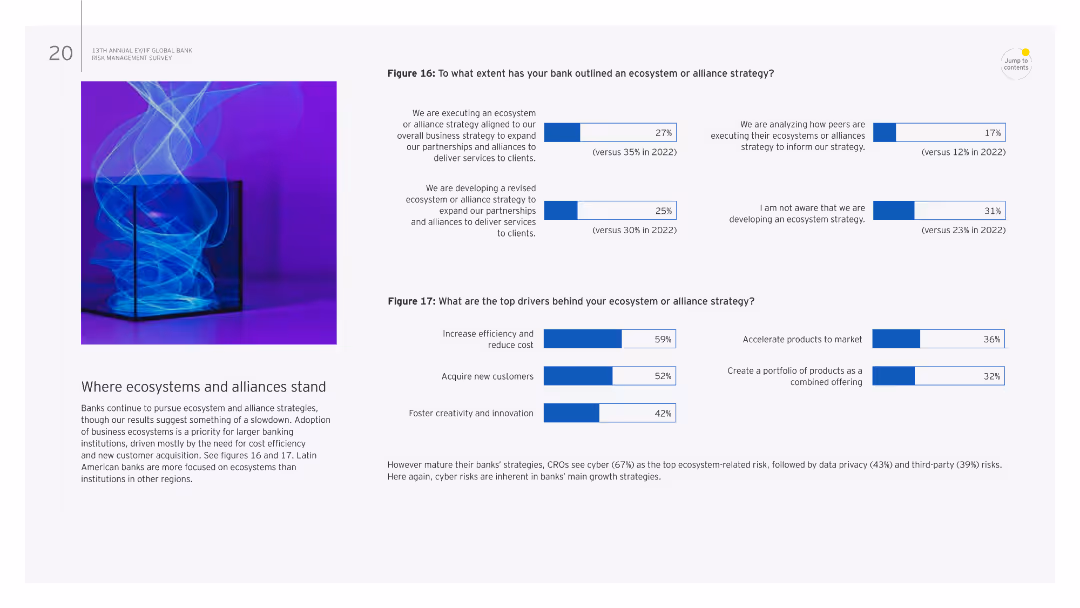
The slide features text and two column charts. The charts detail the extent of ecosystem or alliance strategies and top drivers behind these strategies.
Strategic Planning
Financial Services
It discusses the current state of ecosystem and alliance strategies in banks, including the extent of implementation and key drivers such as efficiency and innovation.
Ecosystems, alliances, strategies, efficiency, innovation
false
Strategic Planning
Financial Services financial-services
Multiple Chart
EY
View slide
Includes a column chart for market size by year, bullet points explaining factors contributing to growth, and a pie chart for market division.
Market Analysis and Trends
Education & Training
This slide reflects the accelerated adoption of ed-tech in tier 2 and tier 3 cities, with a focus on the impact of COVID-19 on educational technology uptake. It discusses the systematic changes needed to fully harness the potential of ed-tech, highlighting growth drivers and future market expectations.
Ed-Tech, COVID-19, Market Growth, Systematic Push, Education System, Online Learning
false
Market Analysis and Trends
Education & Training education-and-training
Mixed Chart
Kearney
View slide
The slide contrasts the adoption rates of EdTech tools pre and during COVID-19 with two circle diagrams and a side text block. The color palette includes grey for pre-COVID and blue for the current state.
Market Analysis and Trends
Education & Training
The slide illustrates the explosive growth in EdTech tool adoption during the pandemic, with a significant increase in app installations, signaling a pivot in educational practices in Southeast Asia.
EdTech, Adoption, Growth, COVID-19, App Installations, Pivot, Educational Practices, SEA, Tools, Increase
false
Market Analysis and Trends
Education & Training education-and-training
Single Chart
Bain
View slide
Slide features a clear diagram categorizing various EdTech solutions along the teaching and learning journey, with a side panel listing target audiences. It utilizes blue and grey for text and background contrast.
Industry Overview
Education & Training
This slide maps the ecosystem of EdTech startups in Southeast Asia, displaying a range of solutions and the respective educational segments they serve, from K-12 to corporate training.
EdTech, Ecosystem, Startups, SEA, Solutions, Education, Learning Journey, K-12, Corporate Training, Segmentation
false
Industry Overview
Education & Training education-and-training
Table
Bain
View slide
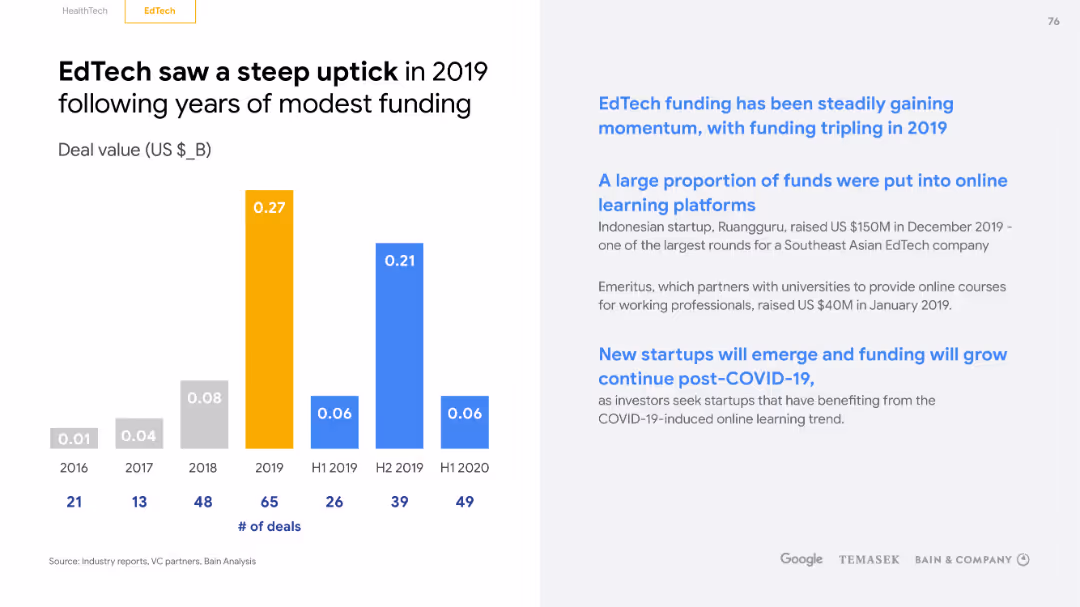
A dual-colored column chart displays EdTech funding over years with annotations. The layout includes a title at the top and a footnote, with a yellow and blue theme.
Investment Analysis
Education & Training
The slide highlights a significant increase in EdTech funding, particularly in 2019, and discusses the types of platforms that received investment, suggesting ongoing momentum and the potential for new startups in the post-COVID era.
EdTech, Funding, Increase, Investment, Startups, COVID-19, Platforms, Momentum, Growth, Potential
false
Investment Analysis
Education & Training education-and-training
Single Chart
Bain
View slide
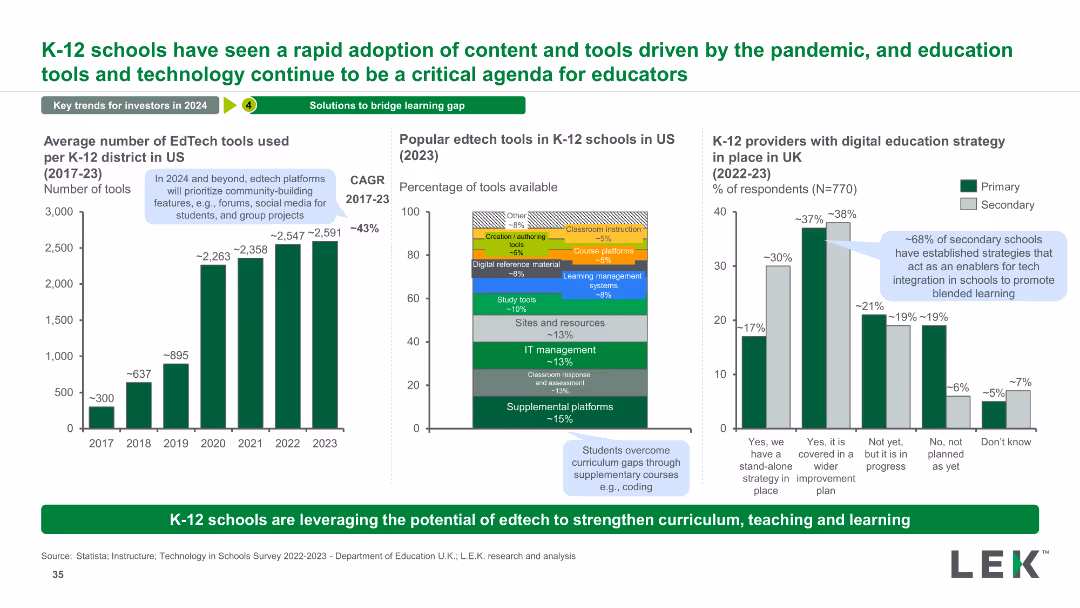
The slide has three charts: a column chart showing the average number of EdTech tools used from 2017 to 2023, a stacked bar chart of popular EdTech tools in 2023, and a column chart of UK schools with digital education strategies.
Technology and Digital Transformation
Education & Training
This slide highlights the rapid adoption of EdTech tools in K-12 schools, showing growth trends, popular tools, and digital strategies in UK schools.
EdTech, Tools, Adoption, K-12, Technology, Trends, Growth, Education, Digital, Strategy
false
Technology and Digital Transformation
Education & Training education-and-training
Multiple Chart
LEK
View slide
This slide is moderate in complexity with a dual-tab layout, one focusing on HealthTech and one on EdTech, with text boxes and color-coded areas indicating various levels of technology adoption during the lockdown.
Market Analysis and Trends
Education & Training
The slide discusses the significant yet incomplete adoption of EdTech tools in education during lockdowns, with a focus on areas with heavy, moderate, and potential for increased adoption.
EdTech, lockdown, adoption, video lectures, methodologies
false
Market Analysis and Trends
Education & Training education-and-training
Table
Bain
View slide
Continuation from the previous slide, this one similarly employs a mix of informative icons and text to express key points about the operational necessity of edge computing, showcased against a dark backdrop.
Technology and Digital Transformation
Technology & Software
This slide emphasizes the operational necessity of edge computing in modern business, highlighting the growing importance of data regulation, enterprise spend, and distributed computing's popularity. It lays out the escalating pace of data volume growth and the potential for edge computing to offer real-time insights and more significant operational flexibility.
Edge Computing, Data Regulation, Operational Necessity
false
Technology and Digital Transformation
Technology & Software technology-and-software
Pillar
McKinsey
View slide
A visually engaging slide presenting a variety of computing methods like device edge, remote edge, and hybrid cloud, illustrated with relevant icons and diagrams, all on a sleek dark background.
Technology and Digital Transformation
Technology & Software
The slide provides a comprehensive overview of the cloud and edge computing trend, explaining the shift from centralized to hybrid computational models. It details various computing locations and their use cases, highlighting how they contribute to tomorrow's networks with closer user computation.
Edge Computing, Hybrid Cloud, Computational Models
false
Technology and Digital Transformation
Technology & Software technology-and-software
Header Horizontal
McKinsey
View slide
This slide is text-dominant with a straightforward layout on a dark background, directing leaders' focus to the benefits and uncertainties associated with engaging with edge computing trends.
Technology and Digital Transformation
Technology & Software
The slide aims at guiding leaders on engaging with edge computing trends, outlining the potential benefits such as improved data latency and compliance, and risks like business model challenges and technical hurdles. It serves as a decision-making framework for leaders to assess opportunities and manage risks in adopting edge computing technologies.
Edge Computing, Leadership Considerations, Business Risks
false
Technology and Digital Transformation
Technology & Software technology-and-software
Boxed
McKinsey
View slide
Detailed map of Edinburgh highlighting key areas with clusters of high-growth tech companies. Uses color coding to differentiate various types of organizations like universities and tech hubs.
Market Analysis and Trends
Technology & Software
Maps the concentration of tech companies and supporting infrastructure in Edinburgh, detailing the strategic importance of its central districts and peripheral areas for tech growth.
Edinburgh, tech companies, map
false
Market Analysis and Trends
Technology & Software technology-and-software
Graphic
Barclays
View slide
Displays a column chart with total deal values in the Edtech sector, accompanied by key insights in a sidebar. The design utilizes color coding to make distinctions between different years and highlights a trend in deal sizes.
Investment Analysis
Education & Training
Explores the increasing investor interest in Edtech despite scaling challenges. It notes the predominance of early-stage deals and suggests the need for region-specific approaches to ensure effective educational technology dissemination.
Edtech, Investment, Scaling, SEA
false
Investment Analysis
Education & Training education-and-training
Mixed Chart
Bain
View slide
A matrix-like table compares characteristics across six different education segments against five attributes. Characteristics are marked with checkmarks, tilde signs, or left blank to indicate presence, partial presence, or absence.
Market Analysis and Trends
Education & Training
This slide categorizes various education segments by their attributes such as revenue visibility and demand-supply dynamics. It aids in assessing the diverse nature of the education market, reflecting on how different segments such as K-12 and vocational education vary in terms of investment characteristics.
Education Segments, Attributes, Comparison, Higher Education, K-12, Vocational, English Language Learning, Transnational
false
Market Analysis and Trends
Education & Training education-and-training
Table
EY
View slide
Column chart comparing art and design student participation across cities; text boxes with school rankings
Market Analysis and Trends
Education & Training
Highlights Melbourne's education strengths, comparing art and design student participation in global context
Education institutions, student participation, global ranking, Melbourne, art and design schools
false
Market Analysis and Trends
Education & Training education-and-training
Mixed Chart
BCG
View slide
Scatter plot comparing Global Innovation Index 2021 against average PISA outcome 2018, with emerging markets and advanced countries highlighted. Text discusses the role of education in innovation.
Technology and Digital Transformation
Education & Training
The slide correlates Global Innovation Index scores with PISA outcomes, showing the relationship between educational performance and innovation capability. It emphasizes that countries with better education systems tend to be more innovative, highlighting the importance of investing in education for future economic growth.
Education, Innovation, PISA, GII
false
Technology and Digital Transformation
Education & Training education-and-training
Mixed Chart
Roland Berger
View slide
The slide features a flowchart with statistical data, grouped under two categories: formal and informal education users. It includes percentage statistics, positive and negative impact highlights, and color coding for clarity (purple and blue). The right side presents a summary block with overall impact statistics.
Market Analysis and Trends
Telecommunications
This slide explores the impact of nbn broadband on educational outcomes, highlighting both positive and negative aspects as reported by users.
Education, Internet, Broadband, Impact, Statistics, Positive, Negative, Formal, Informal, Telecommunications
false
Market Analysis and Trends
Telecommunications telecommunications
Multiple Chart
Accenture
View slide
An illustration of a stick figure writing on a blackboard, with a prominent title and a subtitle in bold purple text on a white background.
Industry Overview
Education & Training
The title slide introduces the theme of the presentation, hinting at a focus on transformative changes in education due to intelligent technologies.
Education, Learning, Intelligent Technologies, Skills Acquisition, Future of Work, Title Slide, Presentation, Technology Impact, Training
false
Industry Overview
Education & Training education-and-training
Title
Accenture
View slide
Slide features a column chart comparing loan originations across years, with an accompanying bar for forecast data, and textual information below the chart.
Financial Performance
Education & Training
This slide tracks the origination volumes of private education loans, highlighting historical data and forecasts. It is suitable for assessing the trend in loan disbursement and predicting future performance in the private education lending market.
Education, Loans, Originations, Forecast, Trend, Financial Analysis, Private, Market Share
false
Financial Performance
Education & Training education-and-training
Single Chart
Morgan Stanley
View slide
The slide features a large pie chart detailing higher education spending and a text box with bullet points detailing the value proposition and strategic execution.
Market Analysis and Trends
Education & Training
This slide discusses the value proposition of higher education, emphasizing the significance of private education loans. It can be used to demonstrate market potential and strategic growth within the private education loan sector.
Education, Value Proposition, Loans, Market Growth, Strategic Execution, Higher Education, Investment
false
Market Analysis and Trends
Education & Training education-and-training
Mixed Chart
Morgan Stanley
View slide
The slide features a column chart showing global gross value added by sector in trillions of USD, with education highlighted among the top 10 sectors, along with a map indicating sector distribution worldwide.
Industry Overview
Education & Training
The slide provides an overview of the education sector's global economic impact, positioning it among the top 10 sectors in terms of gross value added, with a compound annual growth rate (CAGR) of approximately 3% between 2009 and 2019.
Education, global value, sector, economic impact, growth
false
Industry Overview
Education & Training education-and-training
Single Chart
LEK
View slide
Series of column charts comparing efficiency metrics across years for different product categories within Essity. Each chart is labeled with the specific area and metric change.
Operational Efficiency
Financial Services
Focuses on Essity's efforts to optimize cost, capital, and resource efficiency in production, essential for operational reviews and strategic adjustments.
Efficiency Metrics, Cost Optimization, Capital Efficiency, Resource Management
false
Operational Efficiency
Financial Services financial-services
Multiple Chart
Barclays
View slide
This slide presents a column chart visualizing the 'Efficiency Ratio' trend, along with a comprehensive table detailing various expense categories and their respective changes compared to prior periods.
Financial Performance
Financial Services
Offers a detailed view of the company's expenses, showcasing factors contributing to the efficiency ratio and providing context for the financial data, such as increased non-compensation expenses and changes in the effective tax rate.
Efficiency Ratio, Operational Expenses, Compensation, Depreciation, Technology, Professional Fees, Tax Rate, Financial Health
false
Financial Performance
Financial Services financial-services
Mixed Chart
Goldman Sachs
View slide
The slide showcases a column chart displaying a decrease in branch transactions against an increase in other channel transactions, along with a list of technological levers and movement to more efficient channels.
Operational Efficiency
Financial Services
It contrasts the decline in branch transactions with growth in digital channel usage, underscoring the efficiency driven by technology in banking operations. Ideal for analyzing technology's role in operational efficiency.
Efficiency, Digital Channels, Branch Transactions, Technological Levers, Automation, Process Improvement
false
Operational Efficiency
Financial Services financial-services
Multiple Chart
Morgan Stanley
View slide
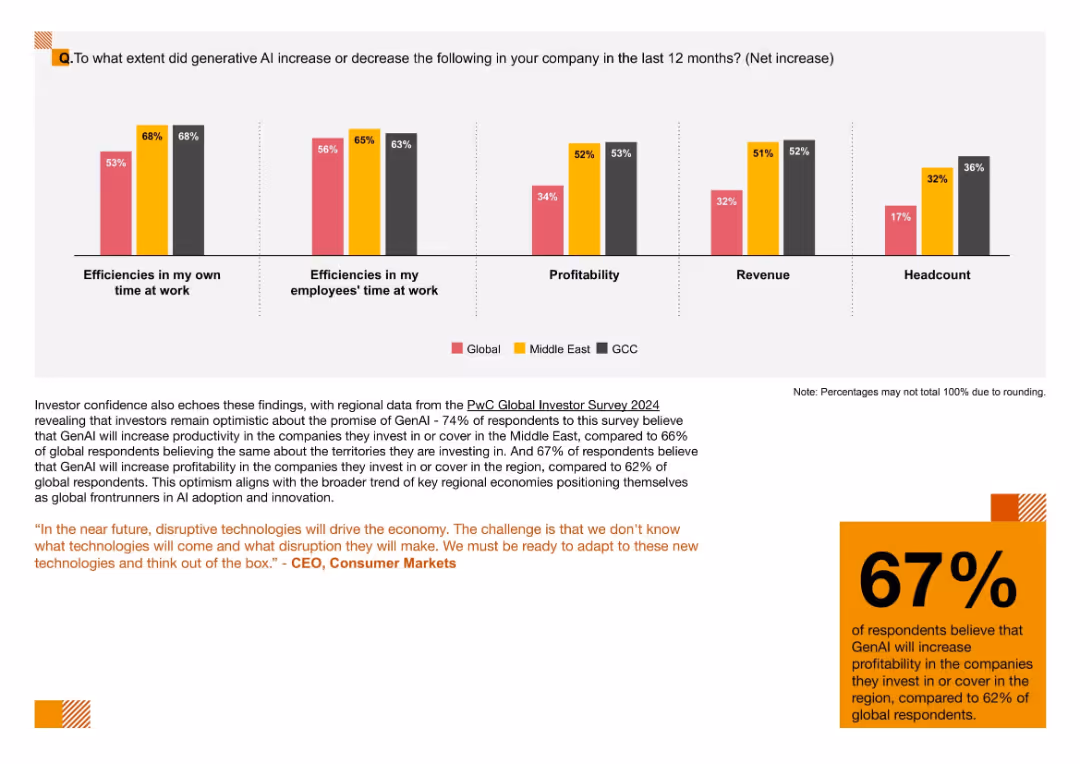
Five-category bar chart comparing impacts of GenAI on efficiency, profitability, revenue, and headcount by region
Performance Metrics and KPIs
Artificial Intelligence
This slide tracks measurable outcomes of GenAI adoption, including improved work efficiencies, profitability, and revenue. GCC firms report the highest gains in headcount, reflecting strong AI integration.
Efficiency, GenAI Impact, Headcount, Productivity, KPIs, AI Metrics, Regional Comparison
false
Performance Metrics and KPIs
Artificial Intelligence artificial-intelligence
Mixed Chart
PwC/Strategy&
View slide
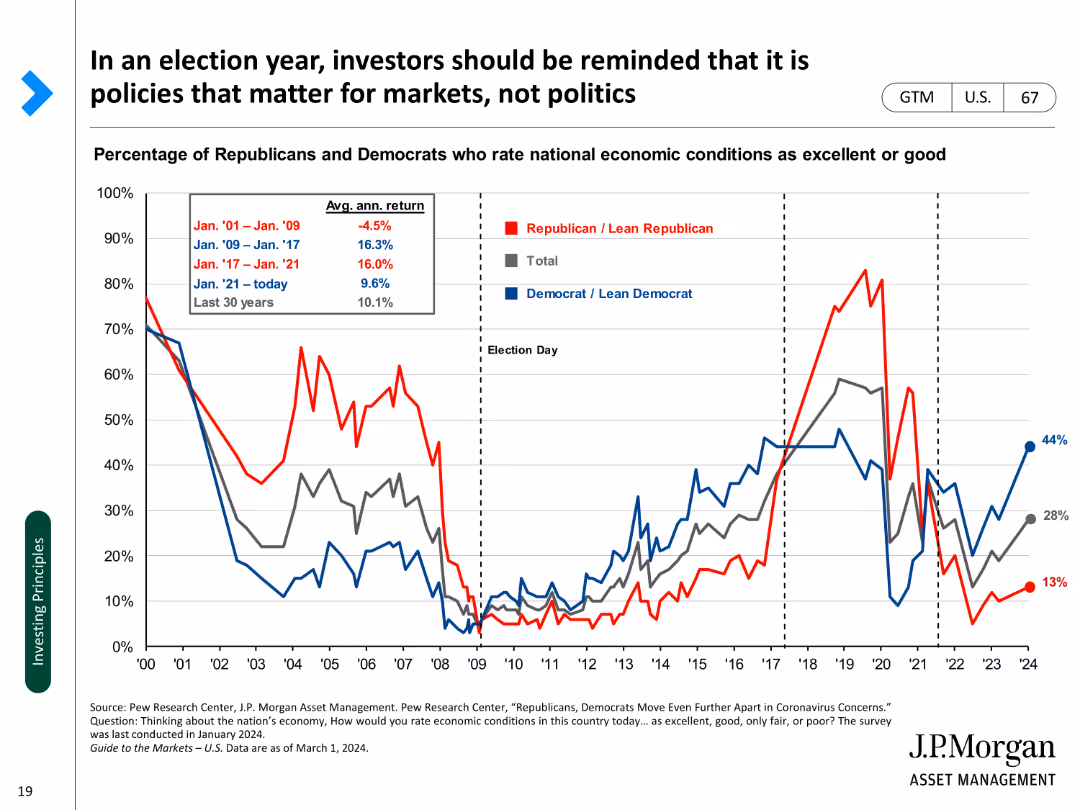
A line chart showing the percentage of Republicans and Democrats rating economic conditions as excellent or good over time.
Market Analysis and Trends
Financial Services
Examines the relationship between political sentiment and economic perceptions during election years.
Election year, investors, policies, economic conditions, sentiment, political, analysis, trends, perceptions
false
Market Analysis and Trends
Financial Services financial-services
Single Chart
JP Morgan
View slide
This slide features two line charts and one column chart displaying polling data for the 2024 election, with red and blue lines representing different political candidates.
Market Analysis and Trends
Government & Public Sector
Analyzes polling data for the 2024 election, comparing it to the 2020 election trends for both Republican and Democratic candidates, highlighting potential similarities.
Election, Polling, Data, Analysis, Trends
false
Market Analysis and Trends
Government & Public Sector government-and-public-sector
Multiple Chart
JP Morgan
View slide
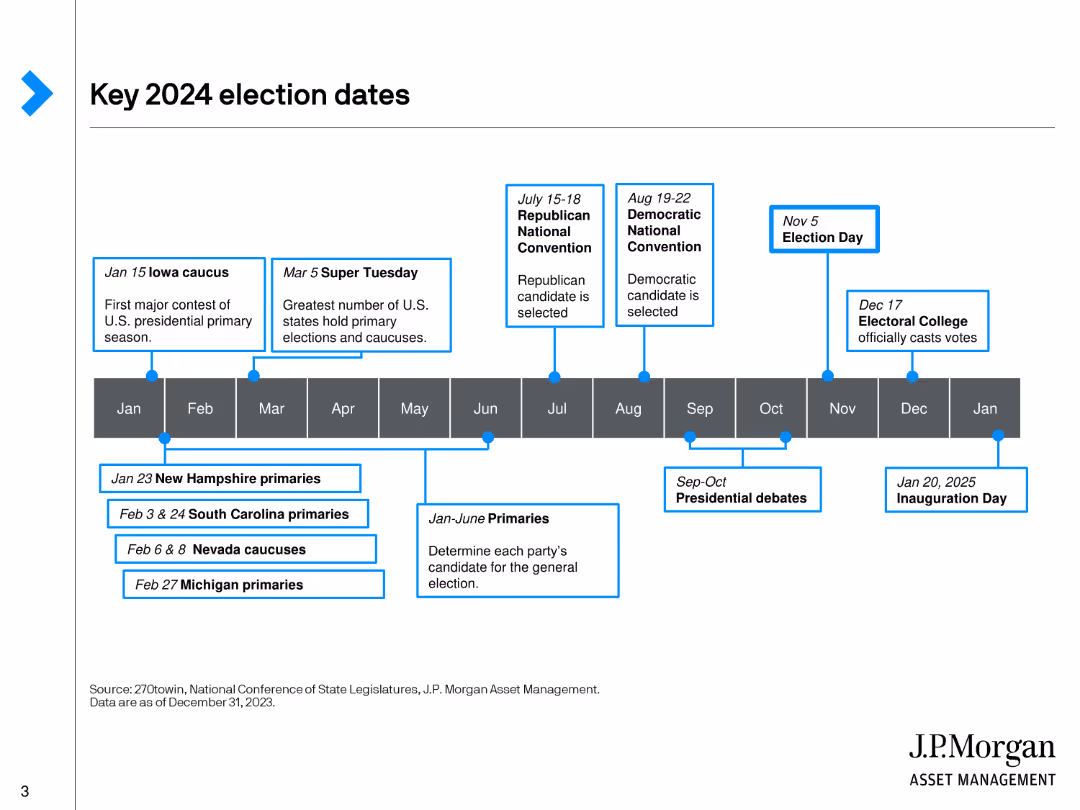
A timeline layout presenting key election dates for 2024, using a horizontal timeline with blue highlights to mark significant events and dates.
Regulatory and Compliance
Government & Public Sector
Provides a detailed timeline of key dates in the 2024 U.S. election cycle, including primary dates, conventions, election day, and inauguration day.
Election, Timeline, Dates, Government, Compliance
false
Regulatory and Compliance
Government & Public Sector government-and-public-sector
Linear Flow
JP Morgan
View slide
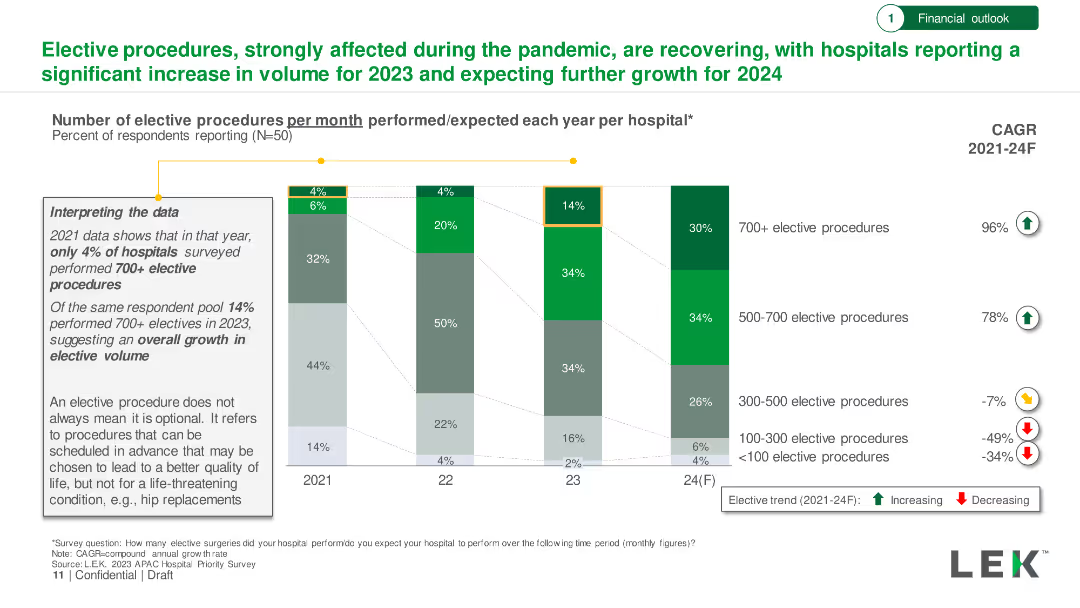
Bar chart showing the number of elective procedures per month from 2021 to 2024, with percentages of hospitals performing varying volumes.
Market Analysis and Trends
Healthcare & Pharmaceuticals
Examination of the recovery in elective procedures post-pandemic, indicating significant growth in volume through 2024.
Elective Procedures, Pandemic, Recovery, Growth, Hospital Volume
false
Market Analysis and Trends
Healthcare & Pharmaceuticals healthcare-and-pharmaceuticals
Mixed Chart
LEK
View slide
Timeline showing the projected development of electric and hybrid-electric aviation technologies from 2020 to 2050.
Technology and Digital Transformation
Transportation & Logistics
This slide discusses the challenges and advancements in electrifying the aviation sector. It provides a timeline for the development of electric air taxis, hybrid-electric aircraft, and battery-powered planes, emphasizing their potential to reduce CO2 emissions and transform aviation.
Electric Aviation, Decarbonization, Timeline
false
Technology and Digital Transformation
Transportation & Logistics transportation-and-logistics
Linear Flow
Roland Berger
View slide
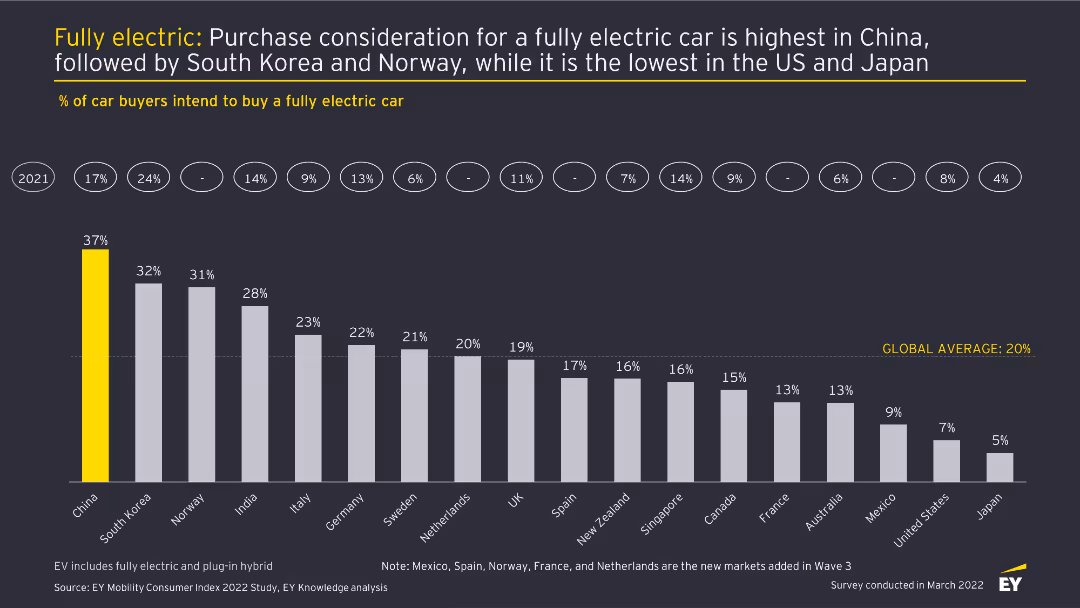
This slide features a column chart displaying the percentage of car buyers intending to buy a fully electric car across different countries. Each country is represented by a vertical bar with percentages labeled on top. The slide has a dark background with yellow highlights.
Market Analysis and Trends
Transportation & Logistics
The slide analyzes the intent to purchase fully electric cars in various countries, highlighting China as the highest and Japan as the lowest. It provides a comparison of consumer interest across 18 countries, showing the global average.
Electric cars, purchase intent, market analysis, consumer trends, automotive industry
false
Market Analysis and Trends
Transportation & Logistics transportation-and-logistics
Single Chart
EY
Previous
Loading...
Hold On!
We are searching in our database
If nothing, comes up, please try different filters!
Column Chart
Heatmap
Chevron
Org Chart
Infographic
Callouts
Timeline
List
Graphic
Picture
Process Flow
Diagram
Paragraph
Map
Table
Framework
Subtitle
Takeaway Box
Icon
Other Chart
Radar Chart
Waterfall Chart
Mekko Chart
Pie Chart
Scatter Plot
Line Chart
Bar chart
Bullet points
Create a FREE account to continue browsing
Receive Instant Access to 1,000+ slides from companies like McKinsey, Google, and Goldman Sachs
First Name
Last Name
Email
Password
I agree to all
Terms & Privacy Policy
Thank you! Your submission has been received!
Oops! Something went wrong while submitting the form.
Have an account?
Sign in
Upgrade to PRO to Save slides
Advanced Search and Filters
Access to 15,000+ slides
Access to Category Pages
Save/Bookmark Slides
PowerPoint Template Library
Pick a Plan
MONTHLY
$12/month
Billed every month, Cancel anytime.
YEARLY
$9/year
Billed $108 annually, Cancel anytime.
Checkout for $12/month
Checkout for $108/yr
Secured by Stripe | AES-256 bit encryption