My Account
My Slides
Search by Category
Templates
View All Templates
Download Template Slides
Leave Feedback
Login
Logout
Get Started
Browse all Slides
Browse all Slides
Create a FREE Account
Instant access to 1,000+ real slides from top companies like McKinsey, BCG, Goldman Sachs, Google and many more!
First Name
Last Name
Email
Password
I agree to all
Terms & Privacy Policy
Thank you! Your submission has been received!
Oops! Something went wrong while submitting the form.
Have an account?
Sign in
Spark Your Next Big Idea with New Presentation Templates
VIEW ALL Templates
Welcome,
Welcome
PRO
Show Featured Only
Checkbox 8
Companies
Mckinsey
Bain
BCG
EY
Deloitte
Accenture
PwC/Strategy&
JP Morgan
Goldman Sachs
Morgan Stanley
Citigroup
Deutsche Bank
Barclays
LEK
KPMG
Kearney
Oliver Wyman
Booz Allen Hamilton
Gartner
IPSOS
Nielsen
Slide type
Text Only
Linear Flow
Vertical Flow
Single Chart
Header Horizontal
Mixed Chart
Header Vertical
Pillar
Multiple Chart
Graphic
Agenda
Title
Table
Framework
Industry
Technology & Software
Artificial Intelligence
Financial Services
Retail & E-commerce
Consumer Goods
Industrial & Manufacturing
Transportation & Logistics
Telecommunications
Real Estate & Construction
Hospitality & Tourism
Professional Services
Education & Training
Media & Entertainment
Agriculture & Food Production
Healthcare & Pharmaceuticals
Environmental Services & Sustainability
Government & Public Sector
Use Case
Mergers and Acquisitions
Performance Metrics and KPIs
Client Case Studies
Competitive Landscape
Corporate Finance and Valuation
Product and Service Analysis
Customer and Market Segmentation
Organizational Structure and Change
Industry Overview
Regulatory and Compliance
Risk Assessment and Management
Investment Analysis
Organizational Structure and Change
Human Resources and Talent Management
Financial Performance
Market Analysis and Trends
Sales and Business Development
Human Resources and Talent Management
Clear all
Thank you! Your submission has been received!
Oops! Something went wrong while submitting the form.
Tag
View slide
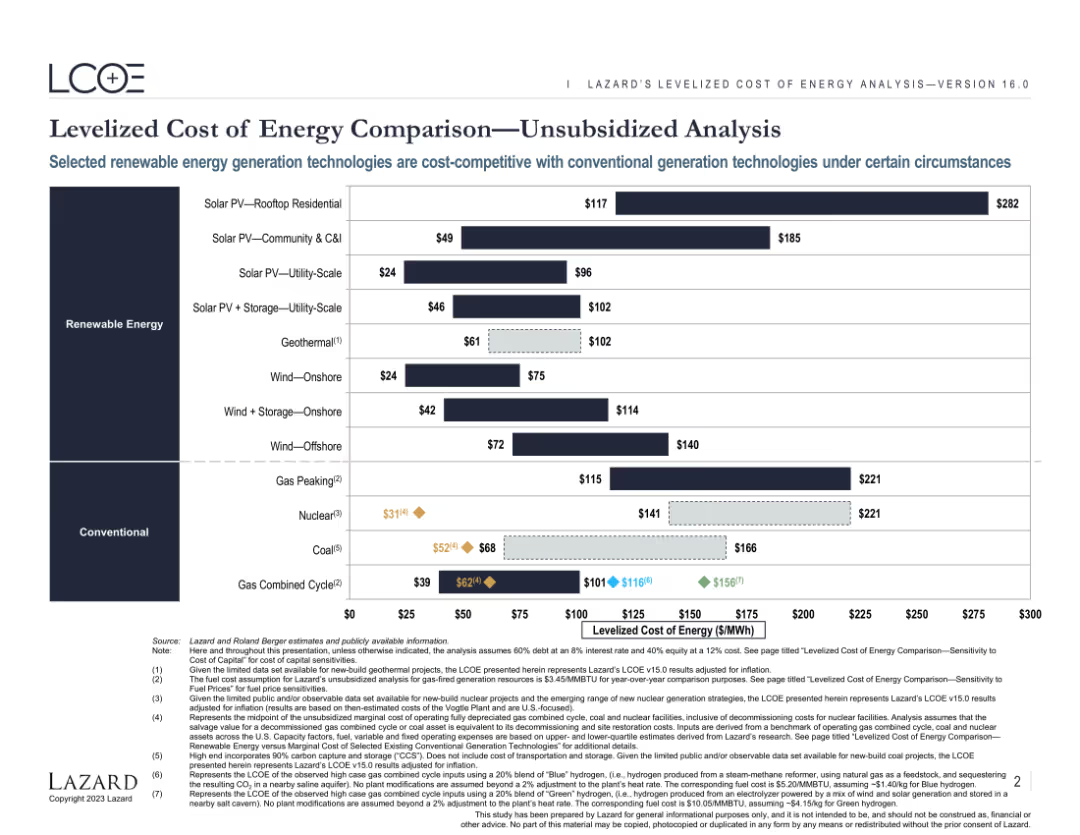
Features a comparative bar chart displaying the levelized cost of energy (LCOE) for various renewable and conventional energy sources. The chart includes both current and projected costs, highlighting the competitiveness of different technologies.
Market Analysis and Trends
Energy & Utilities
Provides an analysis of the levelized cost of energy for various renewable and conventional energy sources. Highlights the cost competitiveness and market potential of different energy generation technologies under specific conditions.
Energy, LCOE, Renewable, Conventional, Comparison
false
Market Analysis and Trends
Energy & Utilities energy-and-utilities
Single Chart
Roland Berger
View slide
The slide presents a balanced combination of text, icons, and a Venn diagram. The icons represent different business areas, while the diagram depicts the intersection of energy policies and current events.
Industry Overview
Energy & Utilities
This slide offers an overview of Seatruim's strategic focus on offshore renewables, new energy, and cleaner solutions, utilizing a Venn diagram to illustrate market positions and energy policy impacts. It could be used to outline the company's market strategy in the energy sector.
Energy, Renewables, Transition, Strategy, Market, Offshore
false
Industry Overview
Energy & Utilities energy-and-utilities
Pillar
Morgan Stanley
View slide
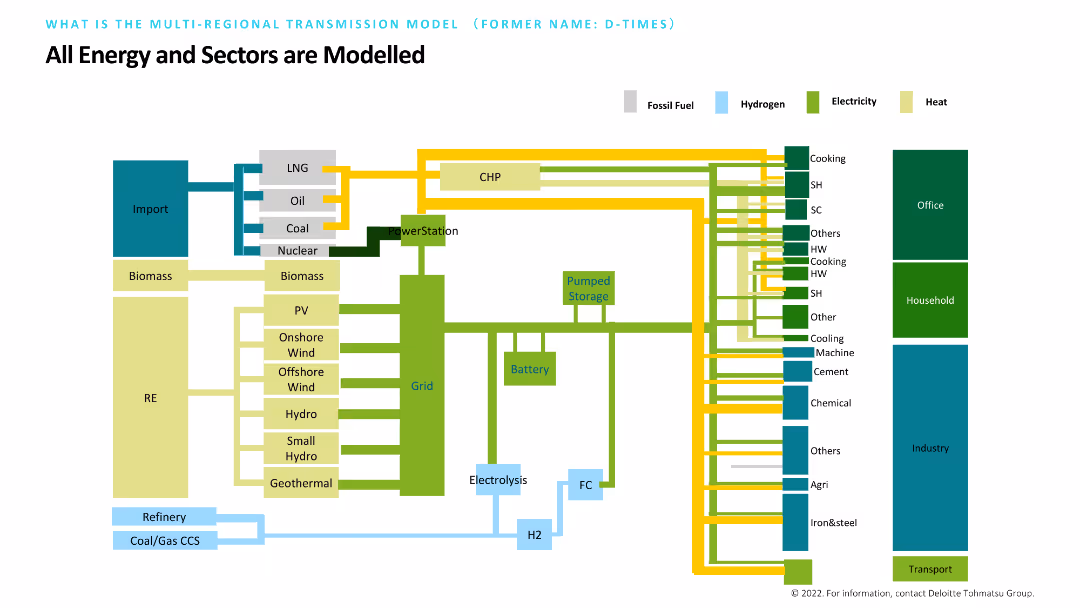
Features a detailed diagram with various energy sources and their connections to different sectors like household, industry, and transport. Each type of energy (fossil fuel, hydrogen, electricity, heat) is color-coded. The slide aims to model all energy and sector interactions comprehensively.
Market Analysis and Trends
Energy & Utilities
Provides a comprehensive model of how different energy sources interact with various sectors. The diagram helps in understanding the flow and impact of energy within households, industries, and transportation, aiming for a holistic view of energy modeling.
Energy, Sectors, Model, Fossil Fuel, Hydrogen
false
Market Analysis and Trends
Energy & Utilities energy-and-utilities
Diagram
Deloitte
View slide
The slide features a set of scatter plots comparing technology adoption rates across different regions (US, Europe, China, South Asia, Rest of the World, Global). Each scatter plot displays data for Solar, Wind, Nuclear, Coal, and Gas technologies for the years 2025 and 2050.
Market Analysis and Trends
Energy & Utilities
This slide discusses how the adoption of various energy technologies varies across different regions. It highlights the projected technology adoption rates for Solar, Wind, Nuclear, Coal, and Gas in the years 2025 and 2050, showing trends and comparisons globally.
Energy, Technology, Adoption, Rates, Global, Solar, Wind, Nuclear, Coal, Gas
false
Market Analysis and Trends
Energy & Utilities energy-and-utilities
Multiple Chart
EY
View slide
The slide is divided into eight sections, each representing a different implication of the energy transition. Key statistics and icons are used to illustrate each implication, including renewable energy dominance, electrification, localized energy systems, and increased investment.
Strategic Planning
Energy & Utilities
This slide outlines eight major implications of the global energy transition, such as the rise of renewable energy, the doubling of electricity demand, the localization of energy systems, and the substantial increase in investments in low-carbon technologies.
Energy, Transition, Implications, Renewable, Electrification, Investment
false
Strategic Planning
Energy & Utilities energy-and-utilities
Multiple Chart
EY
View slide
This slide features multiple graphs and data visualizations: a column chart showing mainline volumes, another column chart illustrating cost synergies, a line graph for FX hedging program, and a text list of projects. Colors like yellow, blue, and gray dominate. Overall, the design is clean with data neatly organized.
Financial Performance
Energy & Utilities
The slide presents Enbridge’s financial performance and projections, emphasizing the growth through the second half of 2017. It includes information on mainline volumes, cost synergies, FX hedging, and upcoming projects, clearly targeting stakeholders interested in the company's financial outlook and strategic direction.
Energy, Utilities, Finance, Growth, Cost, FX Hedging
false
Financial Performance
Energy & Utilities energy-and-utilities
Multiple Chart
Barclays
View slide
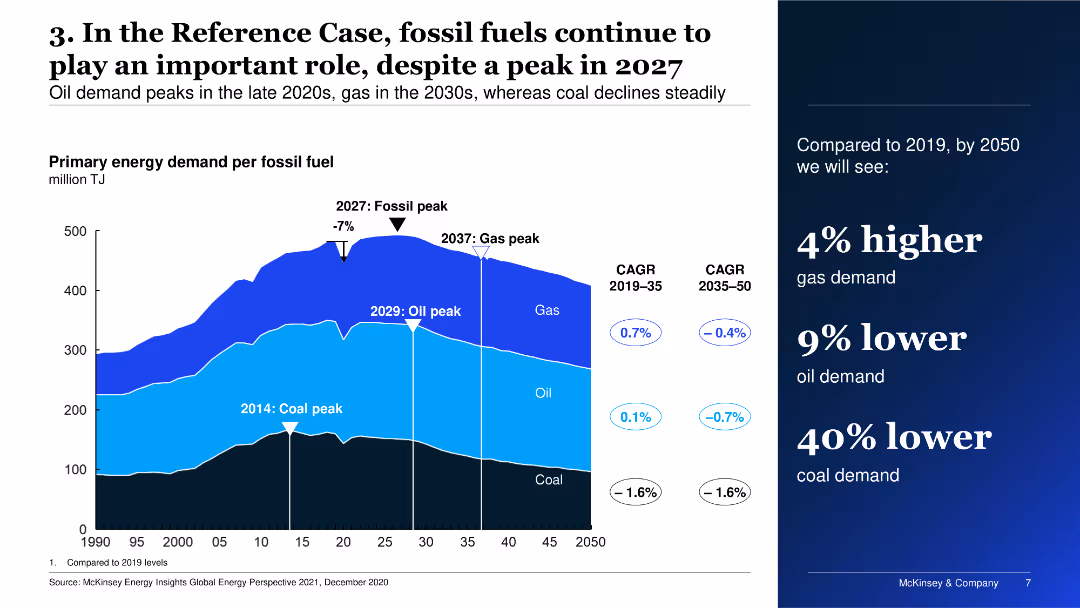
The slide features a multi-layered area chart depicting primary energy demand per fossil fuel over time, alongside key dates for peaks in coal, oil, and gas demand.
Market Analysis and Trends
Energy & Utilities
The slide shows the projected primary energy demand for fossil fuels, highlighting peak periods for coal, oil, and gas, and compares expected demand changes from 2019 to 2050.
Energy, fossil fuels, demand, projections, trends
false
Market Analysis and Trends
Energy & Utilities energy-and-utilities
Mixed Chart
McKinsey
View slide
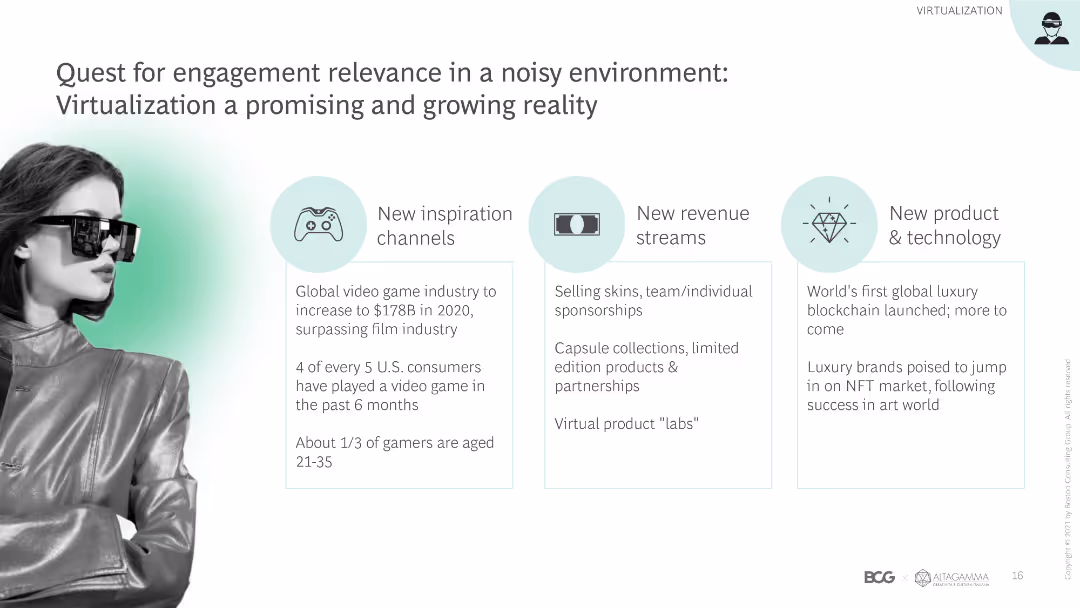
This slide has a content layout with sections on new inspiration channels, revenue streams, and products & technology, featuring relevant icons and brief text descriptions.
Technology and Digital Transformation
Retail & E-commerce
The slide explores the importance of engagement relevance through virtualization, highlighting new channels, revenue streams, and technological advancements in the luxury market.
Engagement relevance, virtualization, new channels, revenue streams, technology, luxury market, digital transformation, innovation, market trends
false
Technology and Digital Transformation
Retail & E-commerce retail-and-e-commerce
Pillar
BCG
View slide
The slide features a two-column comparative layout with a balance of text and numerical data points. There are four sections in each column, represented by shades of blue and gray.
Market Analysis and Trends
Financial Services
This slide compares community engagement and economic outcomes, suitable for presentations on corporate social responsibility outcomes.
Engagement, Empowerment, Economic, Corporate, Social Responsibility
false
Market Analysis and Trends
Financial Services financial-services
Table
Goldman Sachs
View slide
The slide includes a bar chart showing the percentage of actions taken by Millennials and Gen Z in response to various issues.
Market Analysis and Trends
Professional Services
Details the various ways in which Millennials and Gen Z are actively engaging in societal change through different actions.
Engagement, Millennials, Gen Z, Actions, Survey, Change, Societal, Charities, Politics
false
Market Analysis and Trends
Professional Services professional-services
Mixed Chart
Deloitte
View slide
The slide features three columns, each with an image of a computer screen showcasing different tools, and icons for ON24, CSF-OR, and Salesforce at the bottom. Arrows indicate progress from one tool to the next.
Financial Performance
Financial Services
This slide presents market-leading tools used to engage and train suppliers, detailing features such as webcasts, online registration, and program analytics. It may be used to demonstrate technological support tools.
Engagement, Training, Analytics, Webcasts, ON24, Salesforce, CSF-OR, Supplier Management, Online Registration, Data-Driven
false
Financial Performance
Financial Services financial-services
Pillar
Citigroup
View slide
Title on top, two-part text section with bullet points on investment and operational strategies, accompanied by a pie chart showing the budget allocation between them.
Operational Efficiency
Technology & Software
Details the role of engineering in growth and operations, emphasizing investment in new platforms, API ecosystems, infrastructure, and driving simplicity, underpining the firm's execution strategy.
Engineering, Growth, Operational Strategy, Investment, Infrastructure
false
Operational Efficiency
Technology & Software technology-and-software
Mixed Chart
Goldman Sachs
View slide
The slide presents a world map with overlays indicating key performance metrics. Blue and purple boxes highlight statistics about engineering team composition and recruitment success.
Technology and Digital Transformation
Technology & Software
This slide illustrates the engineering team's expertise and growth, showcasing hiring success and the educational level of team members. It's likely used to demonstrate company growth or attract potential investors.
Engineering, Team, Recruitment, Expertise, Growth, Education, Success, Global, Performance, Technology
false
Technology and Digital Transformation
Technology & Software technology-and-software
Graphic
Goldman Sachs
View slide
Complex slide with bar graphs, a percentage breakdown, and color differentiation. There is text explaining the importance of non-financial targets and a legend detailing indexed scores.
Market Analysis and Trends
Professional Services
Presents comparative data on non-financial performance measures, valuable for strategic planning and assessing the impact of enterprise reinvention on sustainability and innovation.
Enterprise, Reinvention, Performance, Non-Financial, Sustainability, Innovation, Talent, Diversity
false
Market Analysis and Trends
Professional Services professional-services
Multiple Chart
Accenture
View slide
Slide includes two bar charts and a column chart, and detailed text explanations.
Technology and Digital Transformation
Technology & Software
Discusses methodology for assessing application diversity and interoperability in enterprise applications.
Enterprise, application, diversity, interoperability, methodology
false
Technology and Digital Transformation
Technology & Software technology-and-software
Multiple Chart
Accenture
View slide
Spider chart showing various services and offerings for entrepreneurs, categorized by Cash & Transacting, Ecosystem, Debt Financing, etc.
Product and Service Analysis
Financial Services
Outlines the suite of services offered by the bank to entrepreneurs, categorized into different areas such as cash management and financing.
Entrepreneur services, offering suite, cash management, debt financing, ecosystem
false
Product and Service Analysis
Financial Services financial-services
Single Chart
Credit Suisse
View slide
A slide with a block of text on the left and an illustration of a person with a recycling symbol on their shirt on the right.
Industry Overview
Environmental Services & Sustainability
Discusses the positive impact of the pandemic on environmental awareness and actions taken by individuals to help the environment.
Environment, Action, Millennials, Gen Z, Pandemic, Optimism, Climate Change, Individual Impact
false
Industry Overview
Environmental Services & Sustainability environmental-services-and-sustainability
Mixed Chart
Deloitte
View slide
Slide with a pie chart detailing the environmental benefits reported by broadband users, specifically in reduced travel. The chart is complemented by a summary on the right side highlighting significant CO2e savings and user feedback on reduced emissions.
Product and Service Analysis
Telecommunications
Explores the environmental benefits of broadband, such as reduced travel and CO2e savings, as reported by users.
Environment, Broadband, Sustainability, Travel, Emissions, CO2e, Impact, Internet, Reduction
false
Product and Service Analysis
Telecommunications telecommunications
Multiple Chart
Accenture
View slide
The slide combines a paragraph of text on the left and a stylized image of a person on a bike next to trees on the right. The graphics are simple and the layout balances text and image well.
Industry Overview
Environmental Services & Sustainability
Discusses the importance of environmental issues among Millennials and Gen Z, their view on businesses' environmental focus, and the potential for a greener future.
Environment, Millennials, Gen Z, Climate Change, Survey, Business, Optimism, Future
false
Industry Overview
Environmental Services & Sustainability environmental-services-and-sustainability
Mixed Chart
Deloitte
View slide
This slide contains a bar chart with horizontal bars comparing the actions taken by Millennials and Gen Z to protect the environment. The bars are color-coded to distinguish between the two groups. The slide also includes a block of text providing context and analysis.
Market Analysis and Trends
Environmental Services & Sustainability
The slide presents survey results showing the environmental actions taken by Millennials and Gen Z, with the text highlighting trends and impacts of these actions. It serves to inform stakeholders about generational differences in environmental responsibility and the influence of the pandemic on these behaviors.
Environment, Millennials, Gen Z, Sustainability, Survey
false
Market Analysis and Trends
Environmental Services & Sustainability environmental-services-and-sustainability
Mixed Chart
Deloitte
View slide
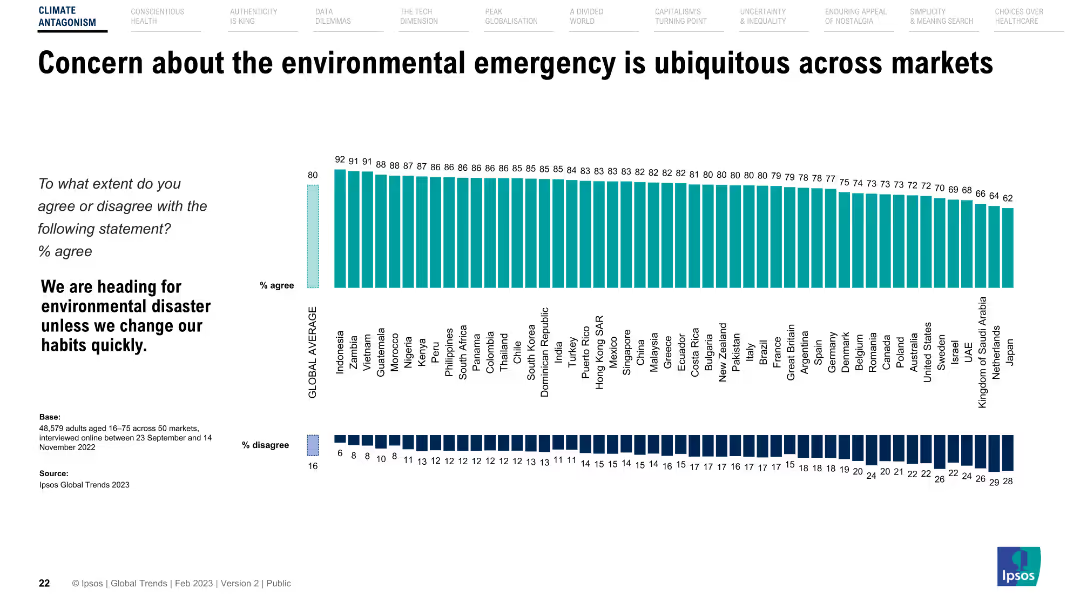
The slide features a horizontal bar chart showing agreement levels with a statement on environmental disaster across different countries.
Market Analysis and Trends
Environmental Services & Sustainability
Presents global survey data on public concern about the environmental emergency, highlighting varying levels of agreement across different countries.
Environment, concern, survey, global trends, countries
false
Market Analysis and Trends
Environmental Services & Sustainability environmental-services-and-sustainability
Multiple Chart
IPSOS
View slide
The slide includes a vertical bar chart showing levels of concern about the environmental emergency across various demographic groups.
Market Analysis and Trends
Environmental Services & Sustainability
Breakdown of concern about the environmental emergency by gender, age, marital status, education, income, and working status, indicating broad agreement across groups.
Environment, demographics, concern, survey, global trends
false
Market Analysis and Trends
Environmental Services & Sustainability environmental-services-and-sustainability
Mixed Chart
IPSOS
View slide
The slide features a column chart showing total environment-focused PE/VC investments from 2018 to 2023 and a series of bar charts for deal types in different sectors.
Investment Analysis
Environmental Services & Sustainability
This slide highlights trends in environment-focused PE/VC investments, showing total investments over recent years and breaking down investment types by sectors such as waste management and renewable energy.
Environment-focused, PE/VC, Investments, Trends, Sectors, Column Chart, Bar Charts
false
Investment Analysis
Environmental Services & Sustainability environmental-services-and-sustainability
Multiple Chart
EY
View slide
The slide presents a timeline with goals for emission reductions across various scopes and a graphical representation of the company's influence on these scopes.
Strategic Planning
Environmental Services & Sustainability
Michelin's slide shows their 2030 environmental ambition to reach net-zero emissions by 2050, including specific targets for CO2 reduction and improvements in energy efficiency.
Environmental Ambition, Net-Zero Emissions, Michelin, CO2 Reduction, Energy Efficiency, Sustainability Goals, 2030 Targets, 2050 Vision, Corporate Responsibility
false
Strategic Planning
Environmental Services & Sustainability environmental-services-and-sustainability
Table
Morgan Stanley
View slide
Features a line graph tracking the reduction in the environmental footprint, with key metrics on water, waste, solvents, energy, and CO2 emissions.
Operational Efficiency
Industrial & Manufacturing
The slide details Michelin's achievements in reducing its environmental footprint through various initiatives, with targets set for 2030 illustrated in a descending line graph.
Environmental Footprint, Michelin, Reduction, Sustainability, Metrics, 2030 Targets, Waste Management, Energy Use, CO2 Emissions, Operational Efficiency
false
Operational Efficiency
Industrial & Manufacturing industrial-and-manufacturing
Mixed Chart
Morgan Stanley
View slide
Column charts tracking company actions to reduce negative marketing impacts on the environment from February 2020 to September 2022, showing varying levels of activity across different aspects like product changes and marketing promotions.
Customer and Market Segmentation
Professional Services
Reviews environmental actions taken by companies to mitigate the negative impacts of their marketing activities, showing trends over time and highlighting areas where pre-COVID levels of activity have not been regained.
Environmental Impact, Marketing, Column Chart, Pre-COVID Levels, Trend Analysis, 2020-2022
false
Customer and Market Segmentation
Professional Services professional-services
Single Chart
Deloitte
View slide
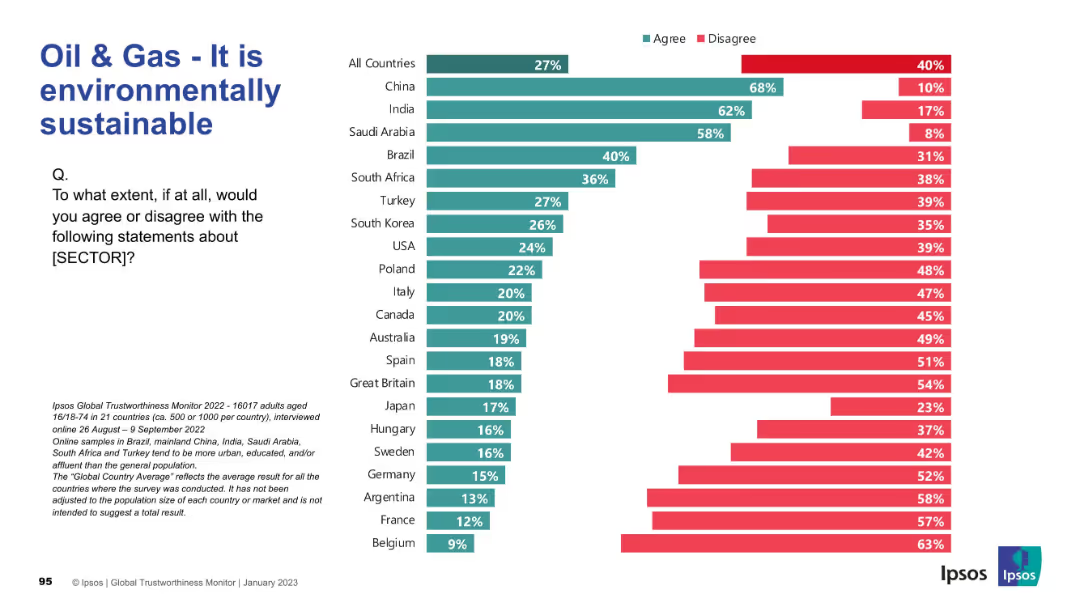
Horizontal bar chart showing public belief in environmental sustainability of oil & gas. Dark green = agree; red = disagree.
Market Analysis and Trends
Energy & Utilities
This slide examines how environmentally sustainable the public perceives the oil & gas sector to be. China, India, and Saudi Arabia report high agreement, while European countries overwhelmingly disagree with the claim.
Environmental Sustainability, Oil & Gas, Climate Impact, Public Sentiment, Energy Sector, Ipsos, Green Practices, Survey Data
false
Market Analysis and Trends
Energy & Utilities energy-and-utilities
Mixed Chart
IPSOS
View slide
A table showing environmental impacts categorized by different metrics like climate change and resource use, with specific indicators highlighted for focus.
Regulatory and Compliance
Environmental Services & Sustainability
Provides a detailed analysis of the environmental impacts of the Kiruna-1 ground station, using life cycle assessment data to emphasize significant areas such as climate change and resource depletion.
Environmental impacts, lifecycle assessment, Kiruna-1, climate change, resource use, impact analysis, sustainability, environmental metrics
false
Regulatory and Compliance
Environmental Services & Sustainability environmental-services-and-sustainability
Table
Deloitte
View slide
The slide includes icons and brief descriptions of five environmental services sub-sectors: waste and recycling, specialty waste services, environmental consulting, response and restoration, and industrial in-plant services.
Industry Overview
Environmental Services & Sustainability
The slide provides an overview of the five sub-sectors within environmental services, summarizing the key services and areas of focus for each sub-sector.
Environmental services, waste management, specialty waste, consulting, response and restoration, industrial services
false
Industry Overview
Environmental Services & Sustainability environmental-services-and-sustainability
Pillar
LEK
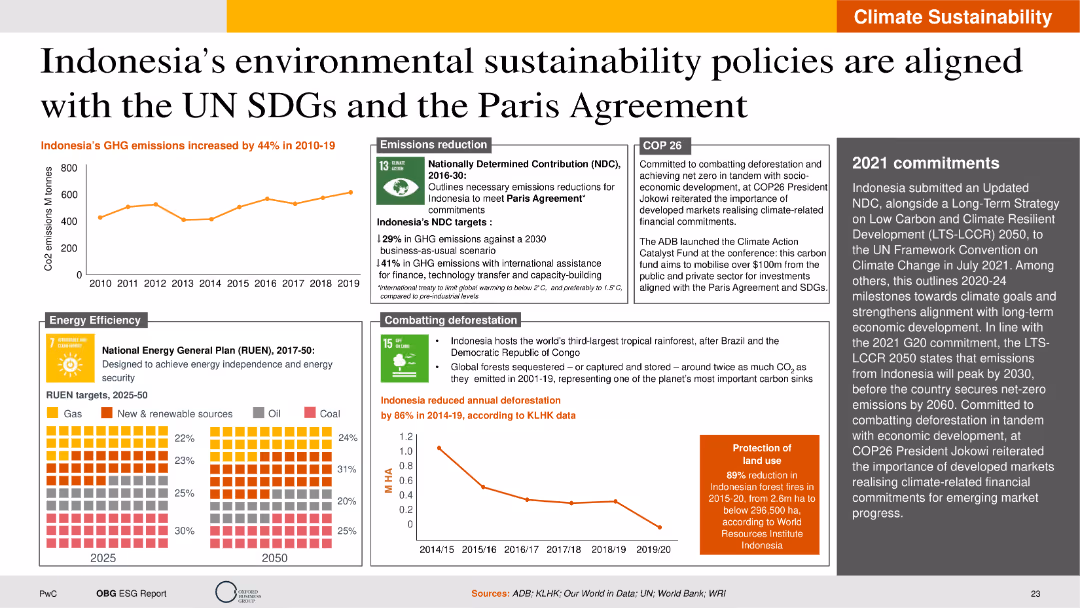
View slide
This slide includes line charts, heat maps, and detailed text descriptions. The layout is moderately complex, displaying data on GHG emissions, energy efficiency targets, and deforestation rates.
Regulatory and Compliance
Environmental Services & Sustainability
The slide outlines Indonesia's environmental sustainability policies and their alignment with the UN SDGs and the Paris Agreement. It provides an overview of GHG emission trends, energy efficiency goals, deforestation reduction efforts, and commitments made during COP26. The slide also discusses the role of international assistance and financial investments in achieving these targets.
Environmental sustainability, UN SDGs, Paris Agreement, GHG emissions, energy efficiency
false
Regulatory and Compliance
Environmental Services & Sustainability environmental-services-and-sustainability
Multiple Chart
PwC/Strategy&
Previous
Loading...
Hold On!
We are searching in our database
If nothing, comes up, please try different filters!
Column Chart
Heatmap
Chevron
Org Chart
Infographic
Callouts
Timeline
List
Graphic
Picture
Process Flow
Diagram
Paragraph
Map
Table
Framework
Subtitle
Takeaway Box
Icon
Other Chart
Radar Chart
Waterfall Chart
Mekko Chart
Pie Chart
Scatter Plot
Line Chart
Bar chart
Bullet points
Create a FREE account to continue browsing
Receive Instant Access to 1,000+ slides from companies like McKinsey, Google, and Goldman Sachs
First Name
Last Name
Email
Password
I agree to all
Terms & Privacy Policy
Thank you! Your submission has been received!
Oops! Something went wrong while submitting the form.
Have an account?
Sign in
Upgrade to PRO to Save slides
Advanced Search and Filters
Access to 15,000+ slides
Access to Category Pages
Save/Bookmark Slides
PowerPoint Template Library
Pick a Plan
MONTHLY
$12/month
Billed every month, Cancel anytime.
YEARLY
$9/year
Billed $108 annually, Cancel anytime.
Checkout for $12/month
Checkout for $108/yr
Secured by Stripe | AES-256 bit encryption