My Account
My Slides
Search by Category
Templates
View All Templates
Download Template Slides
Leave Feedback
Login
Logout
Get Started
Browse all Slides
Browse all Slides
Create a FREE Account
Instant access to 1,000+ real slides from top companies like McKinsey, BCG, Goldman Sachs, Google and many more!
First Name
Last Name
Email
Password
I agree to all
Terms & Privacy Policy
Thank you! Your submission has been received!
Oops! Something went wrong while submitting the form.
Have an account?
Sign in
Spark Your Next Big Idea with New Presentation Templates
VIEW ALL Templates
Welcome,
Welcome
PRO
Show Featured Only
Checkbox 8
Companies
Mckinsey
Bain
BCG
EY
Deloitte
Accenture
PwC/Strategy&
JP Morgan
Goldman Sachs
Morgan Stanley
Citigroup
Deutsche Bank
Barclays
LEK
KPMG
Kearney
Oliver Wyman
Booz Allen Hamilton
Gartner
IPSOS
Nielsen
Slide type
Text Only
Linear Flow
Vertical Flow
Single Chart
Header Horizontal
Mixed Chart
Header Vertical
Pillar
Multiple Chart
Graphic
Agenda
Title
Table
Framework
Industry
Technology & Software
Artificial Intelligence
Financial Services
Retail & E-commerce
Consumer Goods
Industrial & Manufacturing
Transportation & Logistics
Telecommunications
Real Estate & Construction
Hospitality & Tourism
Professional Services
Education & Training
Media & Entertainment
Agriculture & Food Production
Healthcare & Pharmaceuticals
Environmental Services & Sustainability
Government & Public Sector
Use Case
Mergers and Acquisitions
Performance Metrics and KPIs
Client Case Studies
Competitive Landscape
Corporate Finance and Valuation
Product and Service Analysis
Customer and Market Segmentation
Organizational Structure and Change
Industry Overview
Regulatory and Compliance
Risk Assessment and Management
Investment Analysis
Organizational Structure and Change
Human Resources and Talent Management
Financial Performance
Market Analysis and Trends
Sales and Business Development
Human Resources and Talent Management
Clear all
Thank you! Your submission has been received!
Oops! Something went wrong while submitting the form.
Tag
View slide
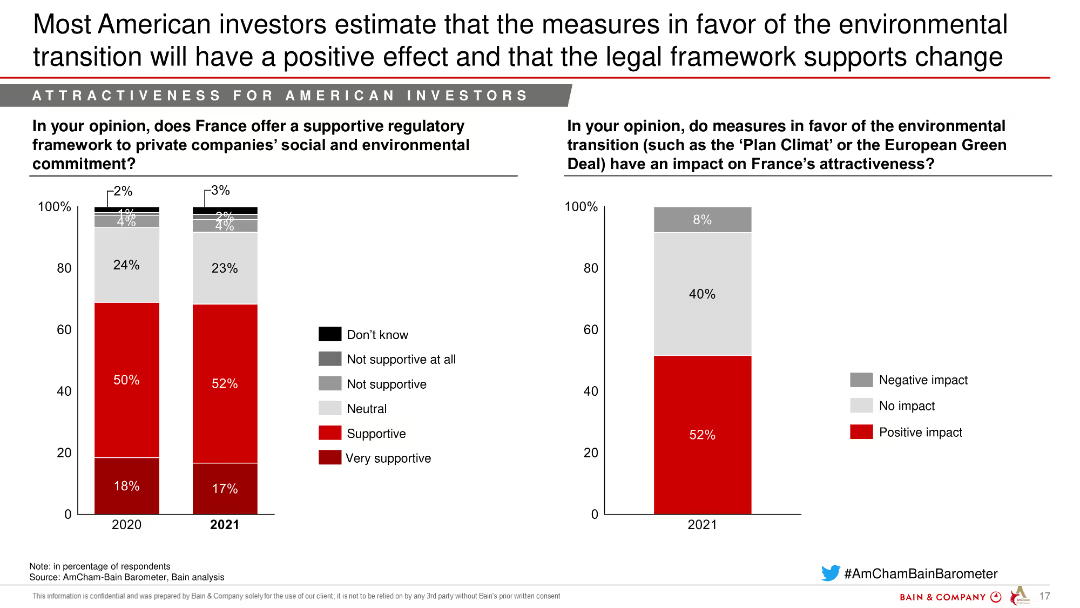
The slide includes two column charts showing the support for France's regulatory framework and the impact of environmental transition measures on attractiveness.
Regulatory and Compliance
Environmental Services & Sustainability
This slide evaluates the support for France's regulatory framework and the positive impact of environmental measures on investment attractiveness.
Environmental transition, Regulatory framework, Positive impact, Sustainability, Legal framework
false
Regulatory and Compliance
Environmental Services & Sustainability environmental-services-and-sustainability
Mixed Chart
Bain
View slide
The slide features a quadrant chart categorizing industry segments by near-term and long-term outlooks. Text boxes describe each segment.
Market Analysis and Trends
Environmental Services & Sustainability
The slide analyzes the near-term and long-term performance outlook of various industry segments related to environmental services.
Environmental, outlook, restoration, consulting, recycling, services, near-term, long-term, industry, response
false
Market Analysis and Trends
Environmental Services & Sustainability environmental-services-and-sustainability
Header Vertical
LEK
View slide
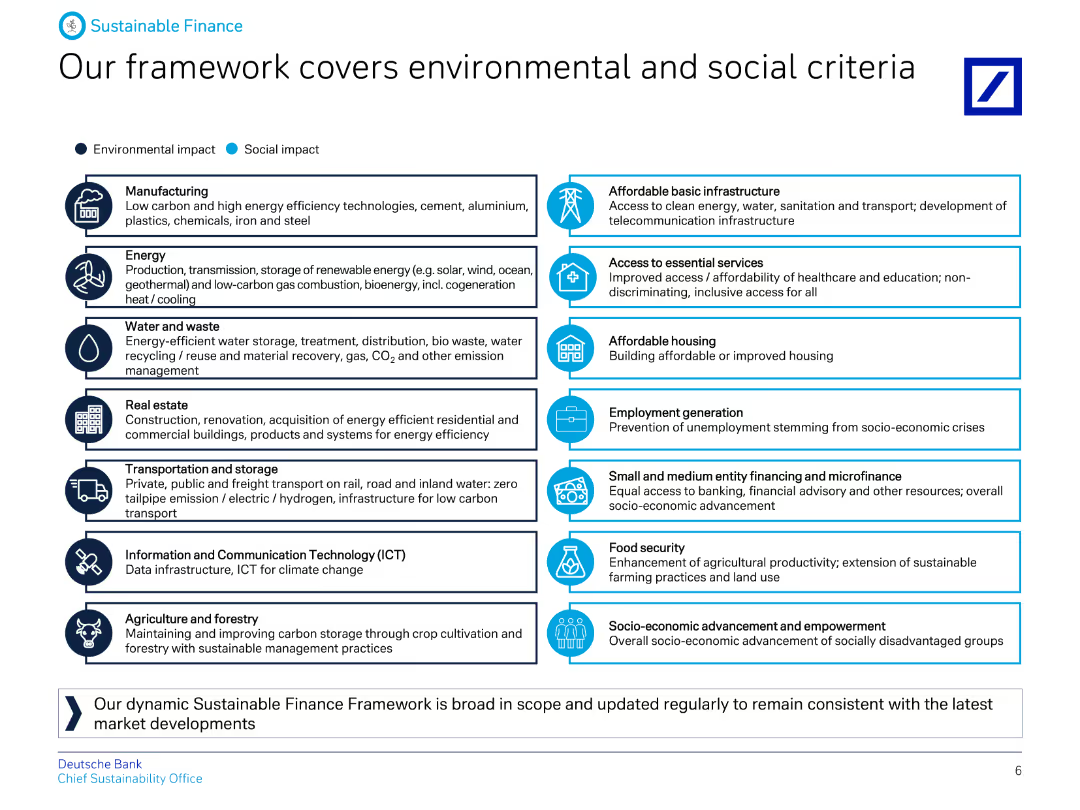
A detailed diagram categorizing various sectors under environmental and social impacts, with icons representing each category and descriptive text.
Regulatory and Compliance
Financial Services
The slide details Deutsche Bank's Sustainable Finance Framework, outlining the environmental and social criteria covered, including sectors like energy, real estate, and ICT.
Environmental, social, criteria, finance, framework, impact, sectors, sustainability, banking, regulation
false
Regulatory and Compliance
Financial Services financial-services
Table
Deutsche Bank
View slide
Highly detailed slide with tables and color-coded metrics covering epidemic progression, economic impact, and business impact.
Risk Assessment and Management
Government & Public Sector
Offers a comprehensive snapshot of various metrics relevant to COVID-19's impact, useful for data-driven decision-making.
Epidemic Progression, Economic Impact, Consumer Activity, Business Impact, Mobility, Trade, Emissions
false
Risk Assessment and Management
Government & Public Sector government-and-public-sector
Table
BCG
View slide
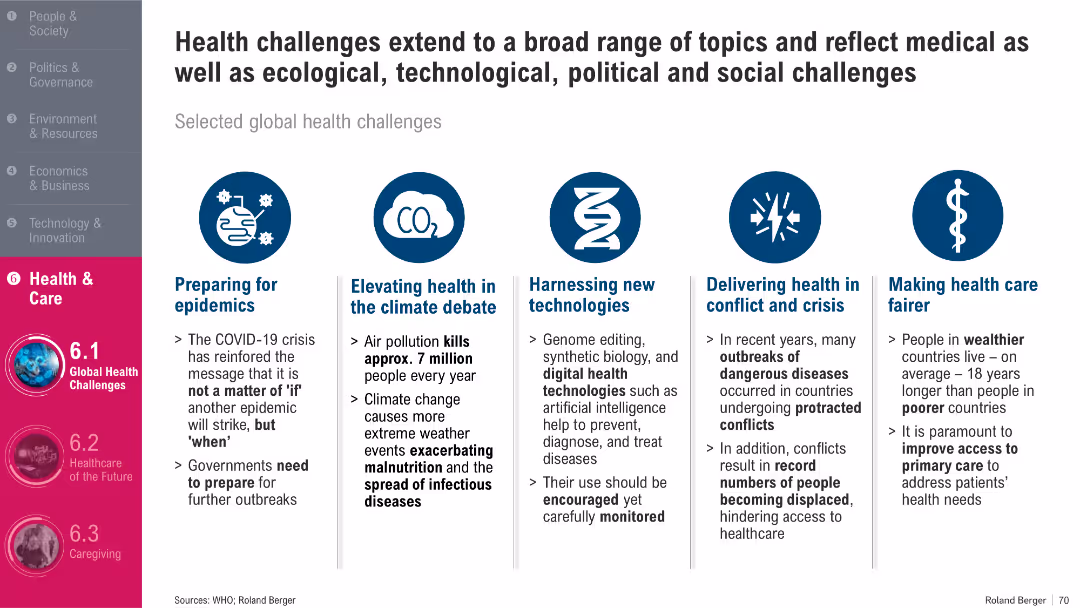
Horizontal layout with five equal-width text boxes, each under a circular icon; clean and symmetric presentation
Strategic Planning
Healthcare & Pharmaceuticals
The slide outlines five major global health challenges: epidemics, climate-linked health issues, new health technologies, healthcare during conflict, and fairer access. It emphasizes the complex interplay of medical, ecological, and societal factors in shaping global health responses.
Epidemics, Climate Change, Health Tech, Conflict, Access, Equity
false
Strategic Planning
Healthcare & Pharmaceuticals healthcare-and-pharmaceuticals
Pillar
Roland Berger
View slide
The slide includes multiple data tables and a color-coded regional map reflecting various epidemiological and economic indicators. The layout is well-organized with clear headings and distinct sections for different types of data.
Market Analysis and Trends
Government & Public Sector
This slide presents epidemiological and economic indicators for the Middle East related to a specific event, offering a comparison between countries in the region. It includes tables with numerical data and a map for visual reference, useful for analysis and decision-making in public health and policy.
Epidemiology, Economics, Middle East, Comparison, Policy, Public Health, Data, Analysis, Map, Indicators
false
Market Analysis and Trends
Government & Public Sector government-and-public-sector
Multiple Chart
McKinsey
View slide
The slide includes text blocks listing strategic priorities and enhancements to Equifax's technological capabilities, alongside circular icons representing various strategic areas such as innovation, customer focus, and security.
Strategic Planning
Technology & Software
It outlines Equifax's strategic priorities aimed at navigating the challenges of a tough mortgage market, emphasizing technology and data utilization to maintain competitive advantage and market leadership.
Equifax, strategic priorities, technology, mortgage market
false
Strategic Planning
Technology & Software technology-and-software
Table
Barclays
View slide
Slide with a pie chart showing the 2017 Equities Client Mix, a column chart depicting investment growth, and several bullet points. The design integrates visual data representation and narrative elements.
Market Analysis and Trends
Financial Services
Discusses the progress in equities execution, with emphasis on electronic execution, acquisitions, and partnerships. It details the improvement in client service and the growth of the quant industry.
Equities, Electronic Execution, Client Service, Investment Growth, Acquisitions, Partnerships, Quant Industry, AUM, Latency Improvement
false
Market Analysis and Trends
Financial Services financial-services
Multiple Chart
Goldman Sachs
View slide
Includes market share column and line charts for equities and FICC, along with a market share comparison bar chart against peers.
Market Analysis and Trends
Financial Services
Demonstrates firm’s leading positions in equities and FICC, and market share growth relative to peers.
Equities, FICC, Market Share, Industry Wallet, Competitive Analysis
false
Market Analysis and Trends
Financial Services financial-services
Multiple Chart
JP Morgan
View slide
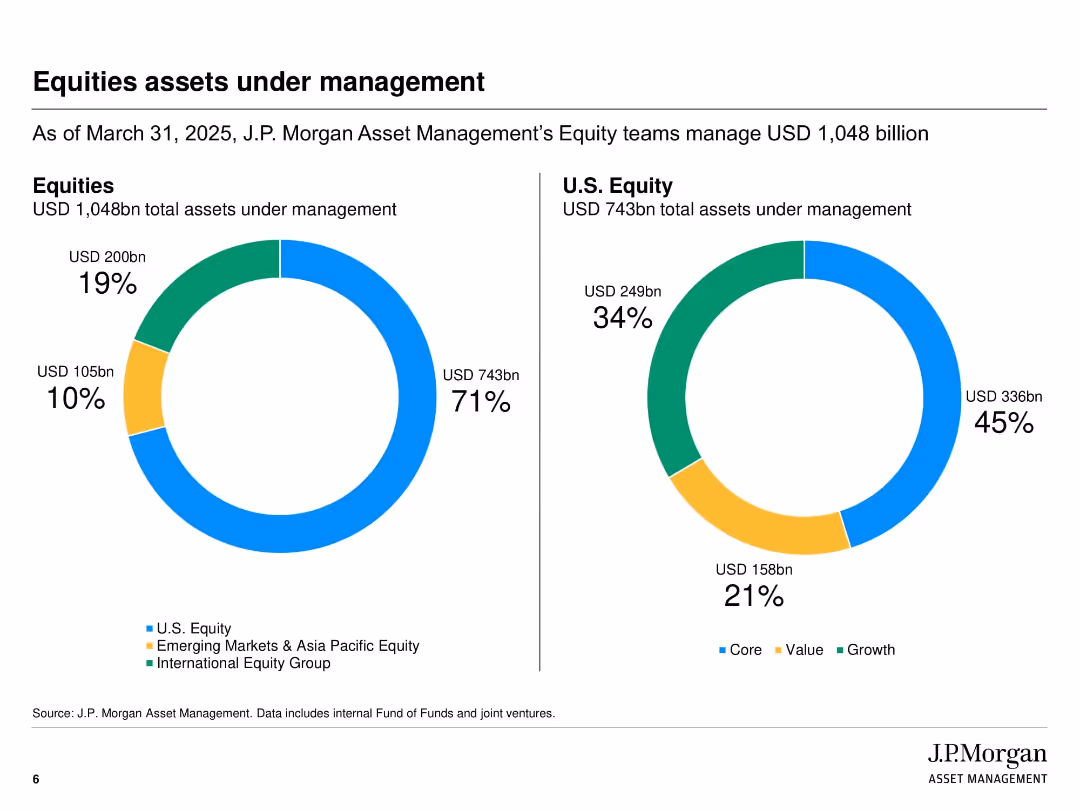
Side-by-side pie charts displaying total equity AUM and U.S. equity AUM with breakdown by region and investment style
Performance Metrics and KPIs
Financial Services
This slide details the composition of J.P. Morgan Asset Management’s equity AUM, breaking it down into regional allocations and investment styles such as value, growth, and core. It offers a clear visual representation of equity asset distribution as of March 31, 2025.
Equity AUM, J.P. Morgan, investment style, regional allocation, value vs. growth, fund management, equity portfolio
false
Performance Metrics and KPIs
Financial Services financial-services
Multiple Chart
JP Morgan
View slide
Two pie charts showing GDP and market capitalization percentages by country.
Market Analysis and Trends
Financial Services
Illustrates US dominance in global equity market allocations, useful for investment strategies.
Equity Allocation, GDP, Market Capitalization, US Dominance, Pie Charts, Morgan Stanley, Market Monitor
false
Market Analysis and Trends
Financial Services financial-services
Multiple Chart
Morgan Stanley
View slide
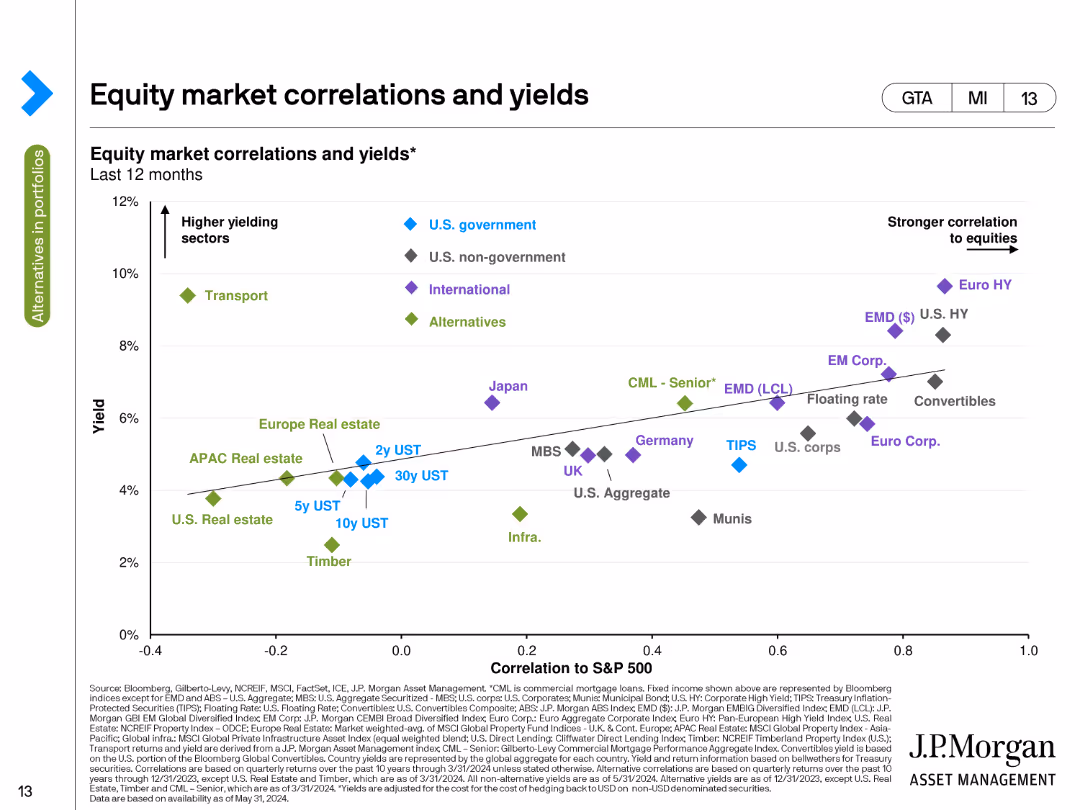
The slide features a scatter plot showing the correlation of various equity markets and yields over the last 12 months. Different symbols and colors represent different sectors, such as higher yielding sectors and stronger correlation to equities.
Market Analysis and Trends
Financial Services
This slide analyzes the correlations between equity markets and their yields over the past year, showing the relationship between yield levels and market performance across various sectors and geographical regions.
Equity Markets, Correlations, Yields, Sectors, Performance
false
Market Analysis and Trends
Financial Services financial-services
Single Chart
JP Morgan
View slide
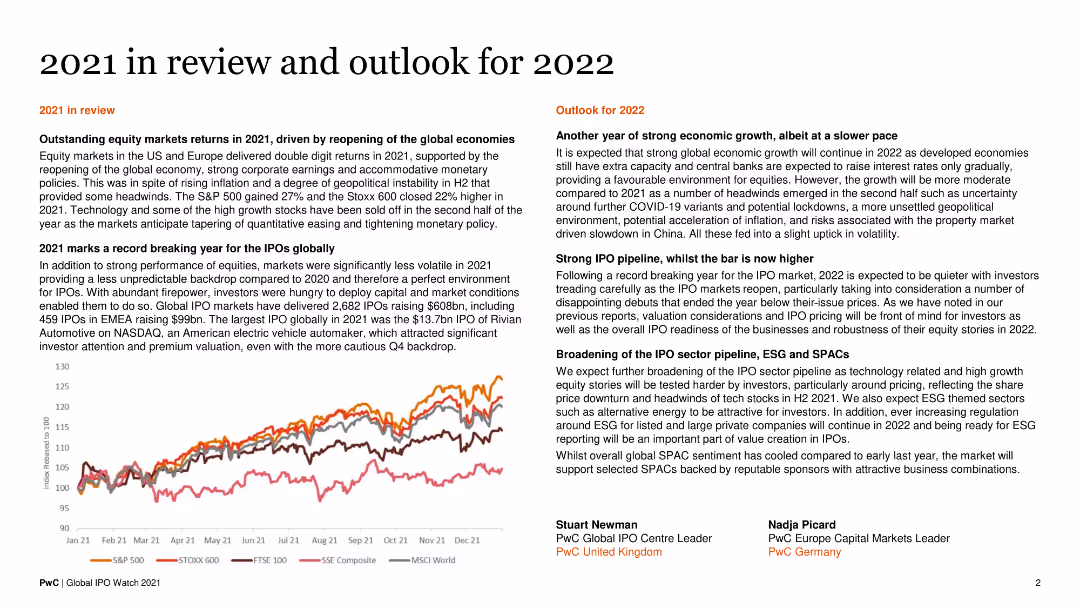
A split layout with text on one side and a line chart on the other. The chart shows equity market returns. Text blocks summarize the year's review and future outlook.
Market Analysis and Trends
Financial Services
The slide reviews the performance of equity markets in 2021 and provides an outlook for 2022, highlighting IPO activity and economic forecasts.
Equity Markets, IPO Activity, 2021 Review, 2022 Outlook, Economic Forecasts
false
Market Analysis and Trends
Financial Services financial-services
Mixed Chart
PwC/Strategy&
View slide
World map in purple shades, percentage yields by country, clearly labeled.
Market Analysis and Trends
Financial Services
Displays global equity yields, offering a geographic perspective for investment opportunities.
Equity Yields, Global, Investment Opportunities, Map, Geographic Distribution, Morgan Stanley, Market Monitor
false
Market Analysis and Trends
Financial Services financial-services
Graphic
Morgan Stanley
View slide
It contains stacked column chart and a timeline of equity portfolio balance sheet progress, using shades of blue to represent different categories. The data is dense, yet the chart is clear and well-labeled.
Investment Analysis
Financial Services
The slide evaluates the progress in equity asset sales against market value adjustments over two years. It demonstrates a financial institution's efforts in managing equity investments, highlighting disposals and equity investment balances, relevant for discussions on asset management strategies.
Equity assets, Balance sheet, Asset management, Sales progress, Investment balance
false
Investment Analysis
Financial Services financial-services
Single Chart
Goldman Sachs
View slide
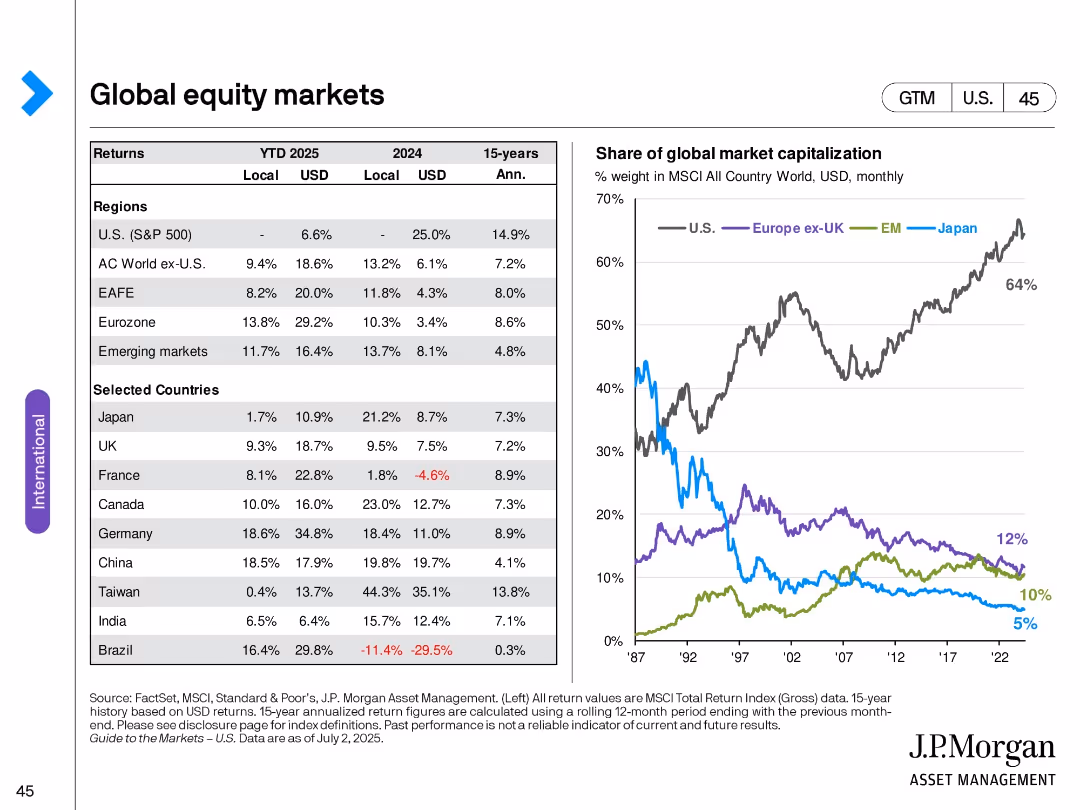
Left table with regional/country returns; right line chart of market cap shares of major regions.
Market Analysis and Trends
Financial Services
Highlights equity market returns across regions and selected countries. Also shows shifting shares of global market capitalization, where the U.S. has gained dominance while Europe and Japan have declined in relative size.
Equity markets, returns, global stocks, market capitalization, international investing, MSCI, U.S. dominance
false
Market Analysis and Trends
Financial Services financial-services
Mixed Chart
JP Morgan
View slide
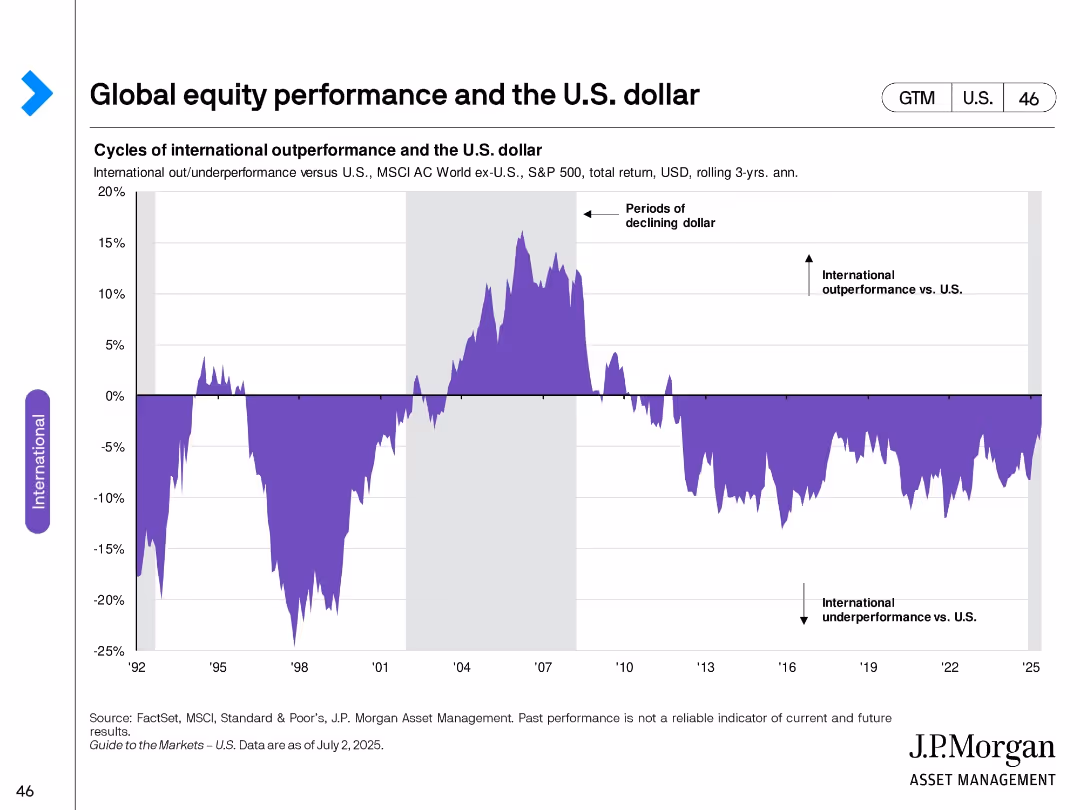
Area chart showing relative international equity performance versus the U.S. dollar over time.
Market Analysis and Trends
Financial Services
Illustrates long-term cycles of international equity outperformance versus the U.S., typically linked to periods of dollar weakening. Shows how currency trends can influence relative returns.
Equity performance, U.S. dollar, international investing, cycles, currency impact, global markets, relative returns
false
Market Analysis and Trends
Financial Services financial-services
Single Chart
JP Morgan
View slide
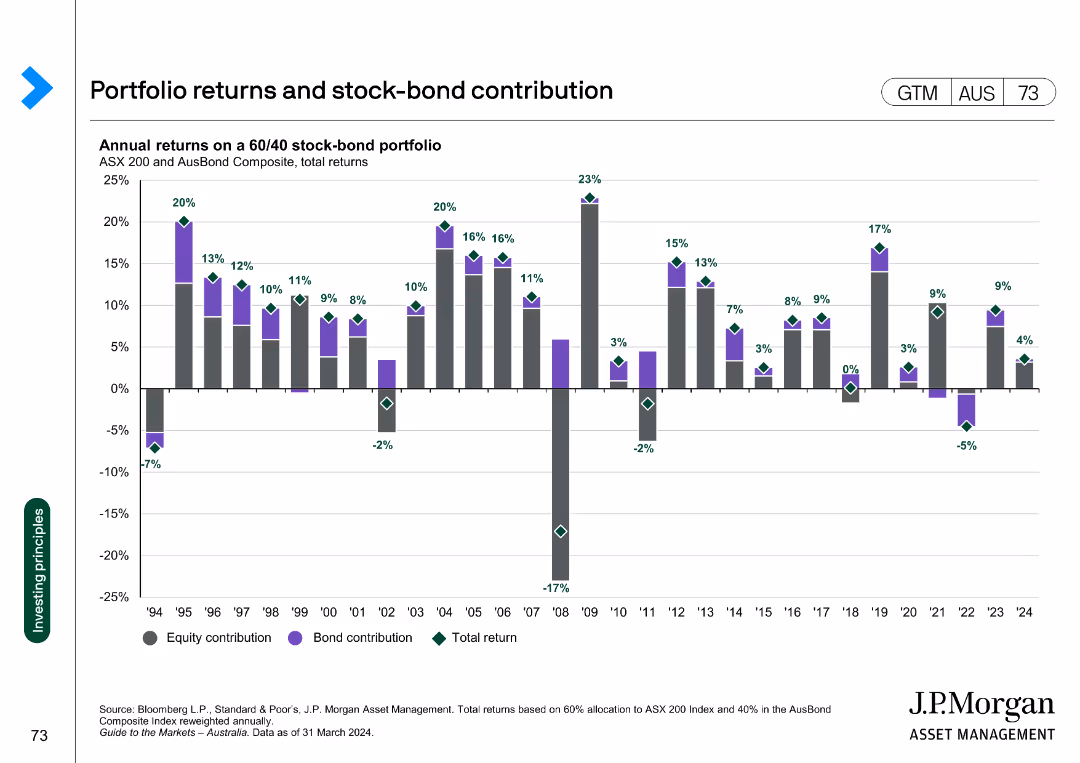
The slide has a column chart showing ASX 200 index intra-year declines vs. calendar year returns from 1994 to 2024. Each year is represented by a column with calendar year return in gray and intra-year decline in red dots.
Financial Performance
Financial Services
This slide analyzes the ASX 200 index's annual equity returns and intra-year declines, offering insights into market performance and volatility over the years.
Equity returns, intra-year declines, ASX 200, financial performance, market analysis, column chart, calendar year
false
Financial Performance
Financial Services financial-services
Single Chart
JP Morgan
View slide
Dense slide with tables focused on capital drivers and quarterly/yearly comparisons.
Corporate Finance and Valuation
Financial Services
Examines the factors affecting the company's equity and CET1 capital, including changes over time and impacts from various financial activities.
Equity, CET1 Capital, Financial Drivers, Corporate Finance, Column Charts, Analysis
false
Corporate Finance and Valuation
Financial Services financial-services
Table
Citigroup
View slide
Slide features two column charts comparing equity value changes and return sensitivities for various investments in Seadrill. Left chart shows equity returns based on asset values, right chart shows return sensitivity based on company names.
Investment Analysis
Financial Services
Analyzes potential returns in a market recovery scenario using asset value increases and sensitivity analysis across different companies, serving as a strategic tool for investors.
Equity, Returns, Investment, Sensitivity, Market Recovery
false
Investment Analysis
Financial Services financial-services
Multiple Chart
Barclays
View slide
This slide displays a bar chart with cumulative equity and equity-related volume since 2010, labeled with various financial institutions and their corresponding values. On the right, four checkmarks highlight key points.
Market Analysis and Trends
Financial Services
The slide presents the cumulative equity and equity-related volume by leading financial institutions, showcasing their market position and emphasizing innovation-driven leadership through consistent performance, landmark transactions, IPO underwriting, and continuous innovation.
Equity, Underwriting, Innovation, Leadership, Financial Institutions, Market Position, Volume, IPO
false
Market Analysis and Trends
Financial Services financial-services
Single Chart
Goldman Sachs
View slide
Two column charts: one shows global equity sector weights across regions, and the other shows MSCI World Growth and Value sector weights by market cap.
Market Analysis and Trends
Financial Services
This slide details the distribution of equity sector weights globally and the breakdown of MSCI World Growth and Value sector weights.
Equity, sector weights, global, MSCI, market cap
false
Market Analysis and Trends
Financial Services financial-services
Multiple Chart
JP Morgan
View slide
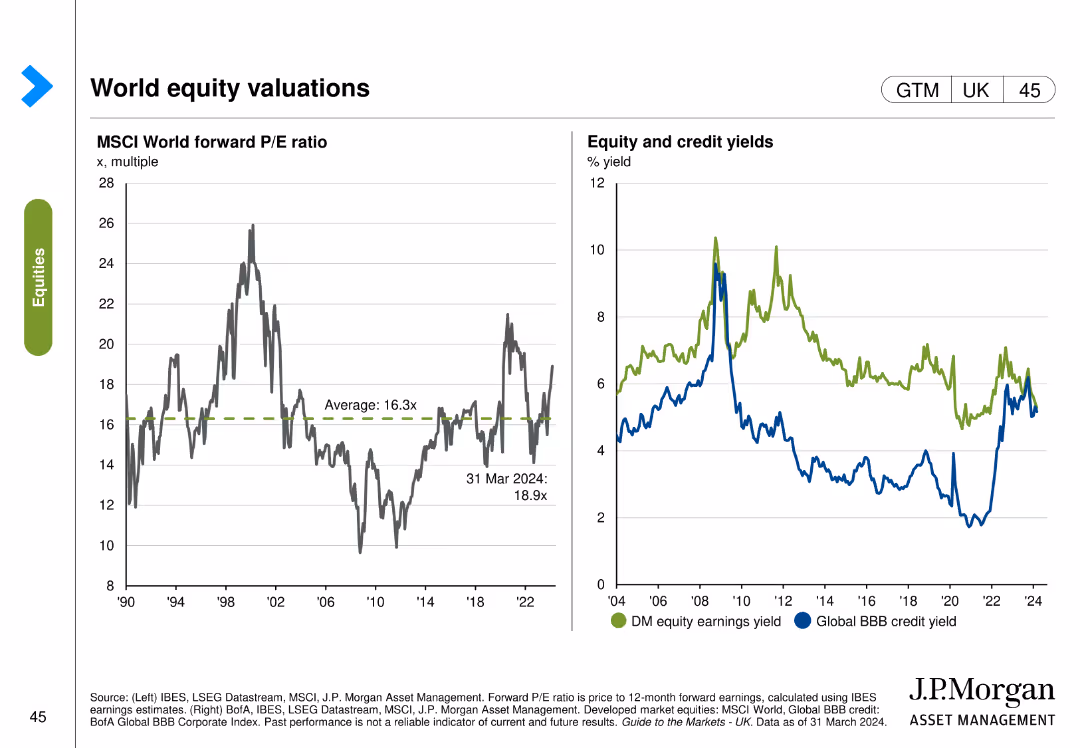
Two charts: one shows the MSCI World forward P/E ratio, and the other depicts equity and credit yields comparing developed market equity earnings yield with global BBB credit yield.
Investment Analysis
Financial Services
This slide provides an overview of global equity valuations, comparing forward P/E ratios and yields for equity and credit. Used for investment evaluation and portfolio management.
Equity, valuations, P/E ratio, yields, MSCI
false
Investment Analysis
Financial Services financial-services
Multiple Chart
JP Morgan
View slide
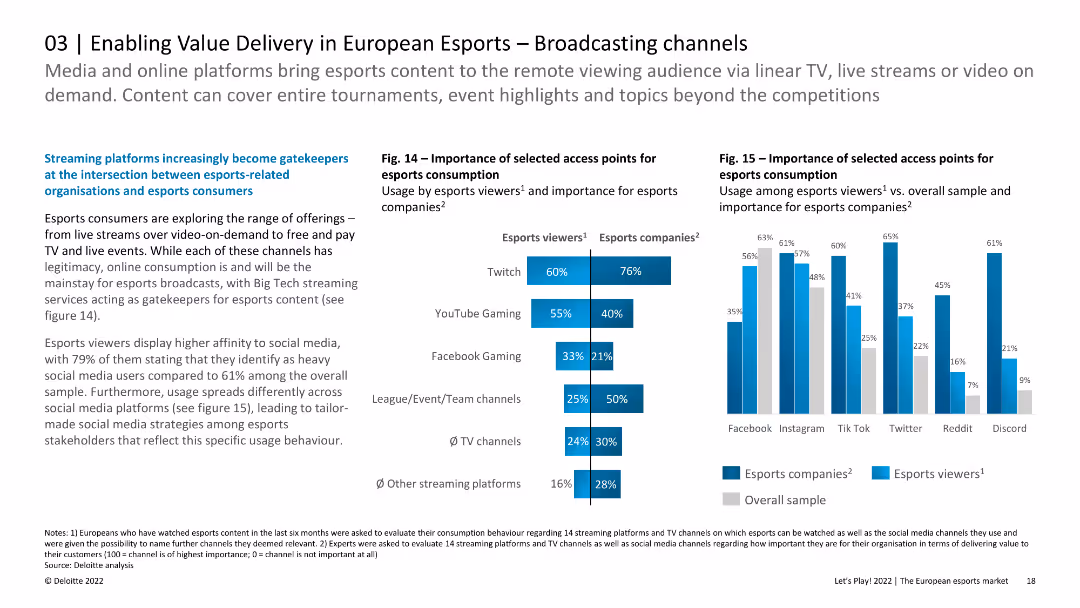
The slide includes column charts showing the importance of access points for esports consumption and usage among viewers. The layout is detailed and informative.
Strategic Planning
Media & Entertainment
The slide explores the role of various broadcasting channels in esports consumption in Europe, emphasizing the dominance of Twitch and YouTube Gaming. It discusses the importance of different access points for both viewers and esports companies.
Esports, Broadcasting, Channels, Europe, Consumption
false
Strategic Planning
Media & Entertainment media-and-entertainment
Multiple Chart
Deloitte
View slide
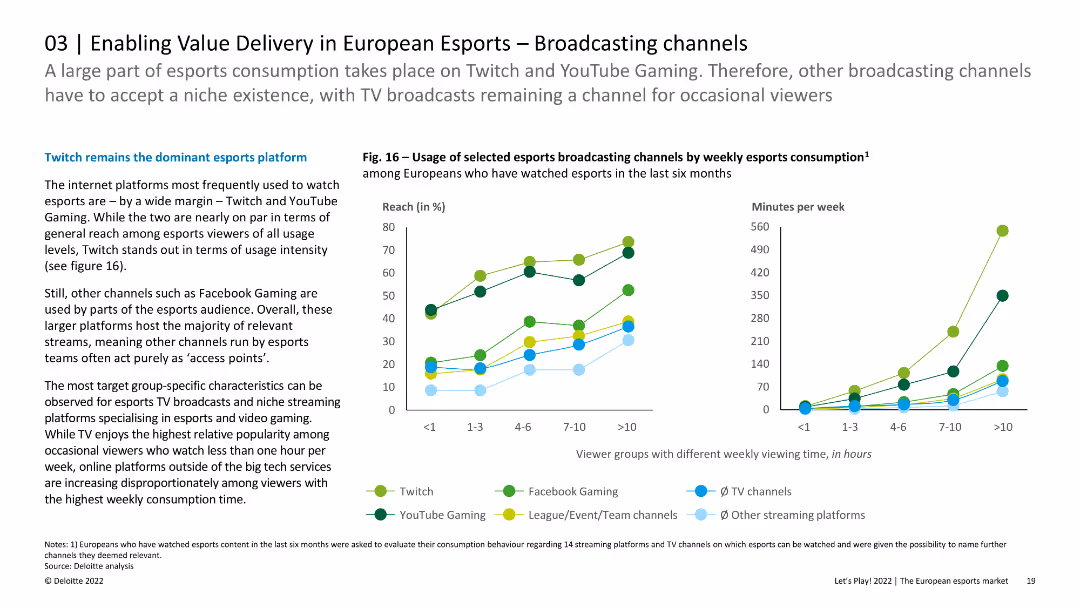
The slide features line charts showing the usage of selected esports broadcasting channels by weekly esports consumption. The layout is visually engaging with clear trend lines.
Strategic Planning
Media & Entertainment
This slide analyzes the viewing patterns of esports audiences across different broadcasting platforms in Europe, highlighting the popularity of Twitch and YouTube Gaming. It provides insights into how different viewer groups engage with these platforms based on viewing time.
Esports, Broadcasting, Platforms, Europe, Viewing
false
Strategic Planning
Media & Entertainment media-and-entertainment
Multiple Chart
Deloitte
View slide
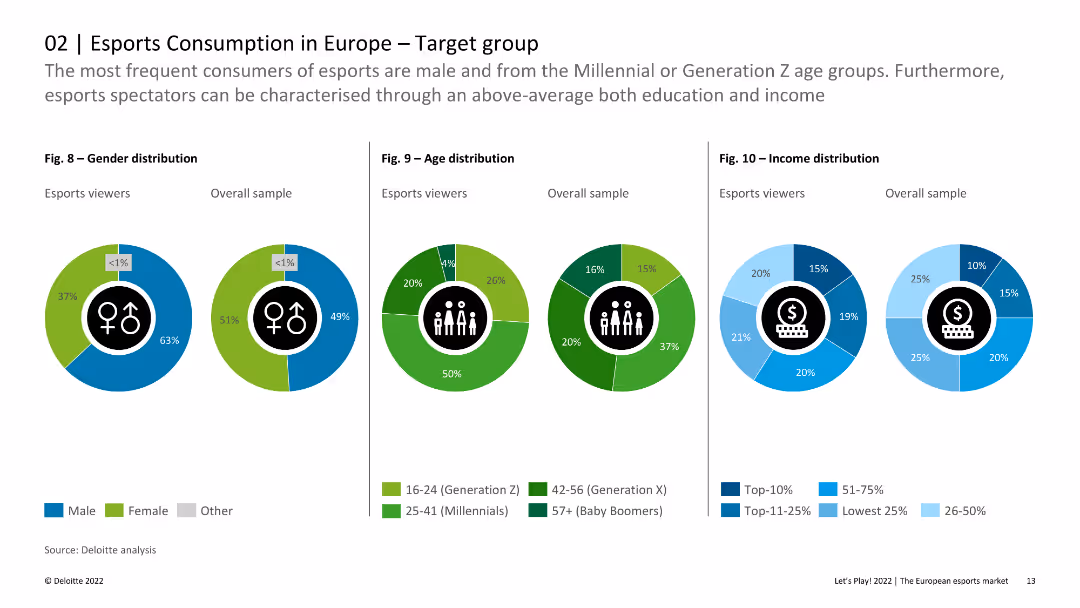
The slide includes pie charts and column charts showing gender, age, and income distribution among esports viewers compared to the overall sample. The visual layout is clear and data-centric.
Customer and Market Segmentation
Media & Entertainment
This slide provides detailed demographic breakdowns of esports viewers in Europe, emphasizing differences in gender, age, and income distribution compared to the general population. It highlights that esports viewers are younger and more male-dominated.
Esports, Demographics, Gender, Age, Income
false
Customer and Market Segmentation
Media & Entertainment media-and-entertainment
Multiple Chart
Deloitte
View slide
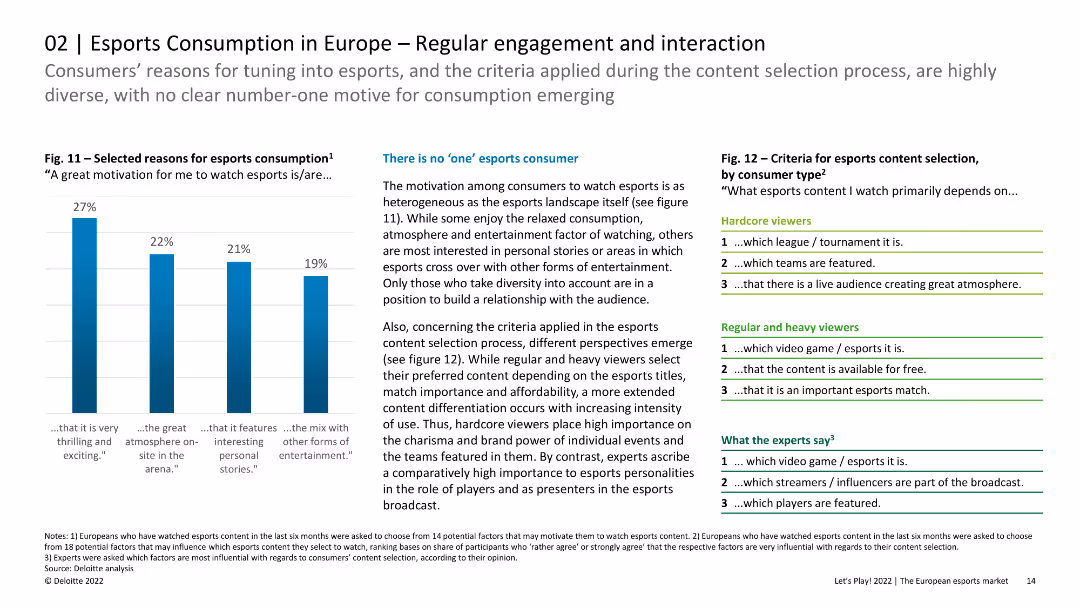
The slide features column charts and lists showing the reasons for esports consumption and criteria for content selection. The layout is organized with clear visual hierarchy.
Customer and Market Segmentation
Media & Entertainment
The slide discusses the diverse motivations and criteria for esports consumption among European viewers, indicating that there is no single dominant reason. It highlights the importance of content differentiation for hardcore, regular, and heavy viewers.
Esports, Engagement, Interaction, Content Selection
false
Customer and Market Segmentation
Media & Entertainment media-and-entertainment
Mixed Chart
Deloitte
View slide
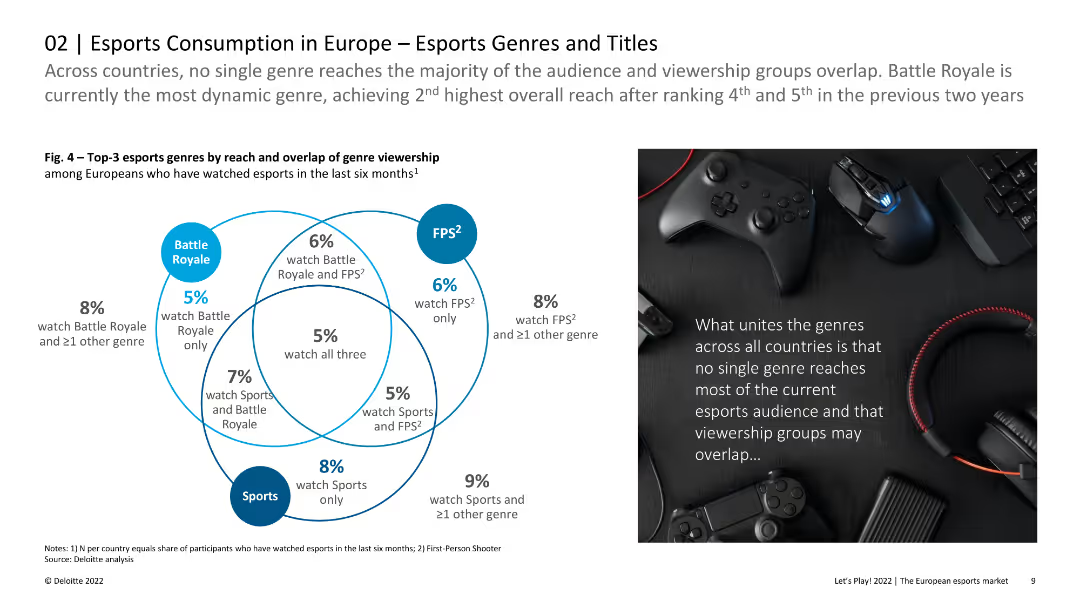
The slide features a Venn diagram showing the overlap of viewership among three esports genres: Battle Royale, FPS, and Sports. The right side includes a photo of gaming accessories. The layout is balanced with a clear, engaging visual format.
Market Analysis and Trends
Media & Entertainment
This slide presents data on the reach and overlap of esports genre viewership in Europe, highlighting that no single genre dominates the audience. It suggests the dynamic nature of Battle Royale games and the significant overlap in viewership groups.
Esports, Genres, Viewership, Europe, Battle Royale
false
Market Analysis and Trends
Media & Entertainment media-and-entertainment
Diagram
Deloitte
View slide
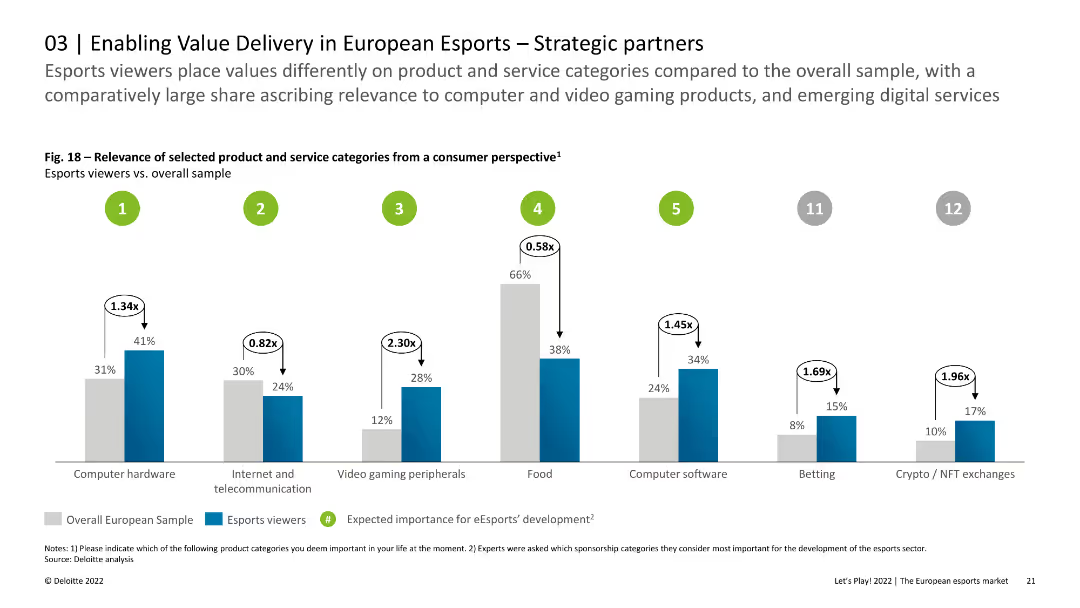
The slide features column charts showing the relevance of selected product and service categories from a consumer perspective. The visual layout is detailed and clear.
Strategic Planning
Media & Entertainment
This slide examines the preferences of esports viewers regarding various product and service categories, comparing their importance to the overall sample. It highlights the high relevance of computer hardware and gaming peripherals among esports consumers in Europe.
Esports, Product Relevance, Consumer Preferences, Europe
false
Strategic Planning
Media & Entertainment media-and-entertainment
Single Chart
Deloitte
View slide
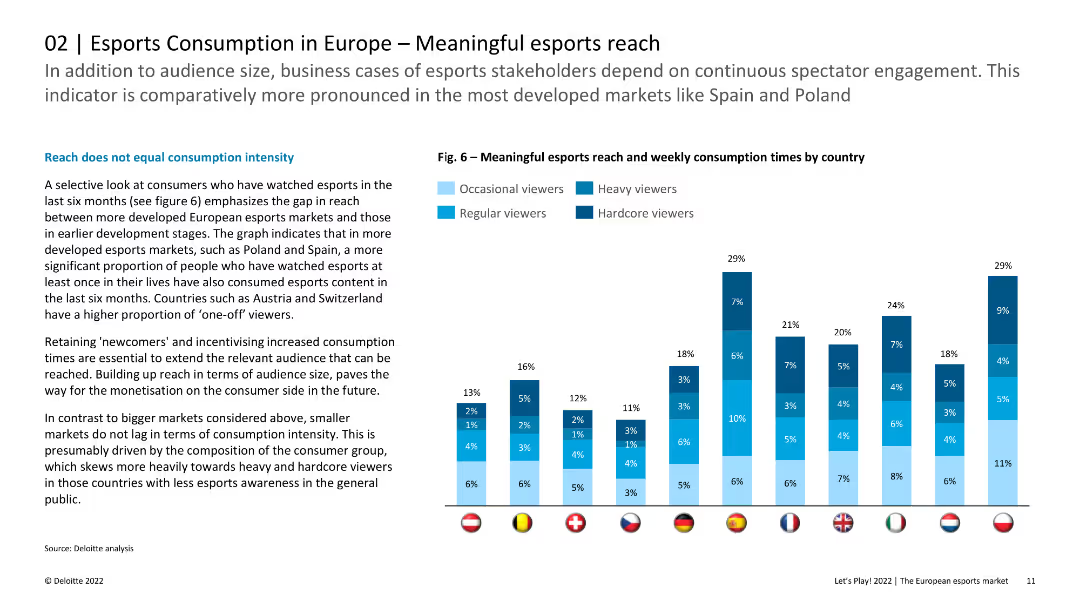
The slide includes a column chart illustrating meaningful esports reach and weekly consumption times by country. The layout is informative with clear data presentation.
Market Analysis and Trends
Media & Entertainment
The slide analyzes the reach of esports content in Europe, emphasizing that larger markets show higher consumption intensity. It highlights the importance of retaining new viewers and incentivizing increased consumption times for monetization.
Esports, Reach, Consumption, Europe, Audience
false
Market Analysis and Trends
Media & Entertainment media-and-entertainment
Mixed Chart
Deloitte
Previous
Loading...
Hold On!
We are searching in our database
If nothing, comes up, please try different filters!
Column Chart
Heatmap
Chevron
Org Chart
Infographic
Callouts
Timeline
List
Graphic
Picture
Process Flow
Diagram
Paragraph
Map
Table
Framework
Subtitle
Takeaway Box
Icon
Other Chart
Radar Chart
Waterfall Chart
Mekko Chart
Pie Chart
Scatter Plot
Line Chart
Bar chart
Bullet points
Create a FREE account to continue browsing
Receive Instant Access to 1,000+ slides from companies like McKinsey, Google, and Goldman Sachs
First Name
Last Name
Email
Password
I agree to all
Terms & Privacy Policy
Thank you! Your submission has been received!
Oops! Something went wrong while submitting the form.
Have an account?
Sign in
Upgrade to PRO to Save slides
Advanced Search and Filters
Access to 15,000+ slides
Access to Category Pages
Save/Bookmark Slides
PowerPoint Template Library
Pick a Plan
MONTHLY
$12/month
Billed every month, Cancel anytime.
YEARLY
$9/year
Billed $108 annually, Cancel anytime.
Checkout for $12/month
Checkout for $108/yr
Secured by Stripe | AES-256 bit encryption