My Account
My Slides
Search by Category
Templates
View All Templates
Download Template Slides
Leave Feedback
Login
Logout
Get Started
Browse all Slides
Browse all Slides
Create a FREE Account
Instant access to 1,000+ real slides from top companies like McKinsey, BCG, Goldman Sachs, Google and many more!
First Name
Last Name
Email
Password
I agree to all
Terms & Privacy Policy
Thank you! Your submission has been received!
Oops! Something went wrong while submitting the form.
Have an account?
Sign in
Spark Your Next Big Idea with New Presentation Templates
VIEW ALL Templates
Welcome,
Welcome
PRO
Show Featured Only
Checkbox 8
Companies
Mckinsey
Bain
BCG
EY
Deloitte
Accenture
PwC/Strategy&
JP Morgan
Goldman Sachs
Morgan Stanley
Citigroup
Deutsche Bank
Barclays
LEK
KPMG
Kearney
Oliver Wyman
Booz Allen Hamilton
Gartner
IPSOS
Nielsen
Slide type
Text Only
Linear Flow
Vertical Flow
Single Chart
Header Horizontal
Mixed Chart
Header Vertical
Pillar
Multiple Chart
Graphic
Agenda
Title
Table
Framework
Industry
Technology & Software
Artificial Intelligence
Financial Services
Retail & E-commerce
Consumer Goods
Industrial & Manufacturing
Transportation & Logistics
Telecommunications
Real Estate & Construction
Hospitality & Tourism
Professional Services
Education & Training
Media & Entertainment
Agriculture & Food Production
Healthcare & Pharmaceuticals
Environmental Services & Sustainability
Government & Public Sector
Use Case
Mergers and Acquisitions
Performance Metrics and KPIs
Client Case Studies
Competitive Landscape
Corporate Finance and Valuation
Product and Service Analysis
Customer and Market Segmentation
Organizational Structure and Change
Industry Overview
Regulatory and Compliance
Risk Assessment and Management
Investment Analysis
Organizational Structure and Change
Human Resources and Talent Management
Financial Performance
Market Analysis and Trends
Sales and Business Development
Human Resources and Talent Management
Clear all
Thank you! Your submission has been received!
Oops! Something went wrong while submitting the form.
Tag
View slide
The slide includes a line graph showing the competitiveness of FCEV vs BEV in terms of fuel cell capex and vehicle range.
Strategic Planning
Energy & Utilities
The slide discusses the long-term competitiveness of fuel cell electric vehicles compared to battery electric vehicles, highlighting cost projections and competitive thresholds.
FCEV, BEV, competitiveness, cost, projections
false
Strategic Planning
Energy & Utilities energy-and-utilities
Mixed Chart
Kearney
View slide
The slide presents a graph comparing carbon abatement costs (CAC) versus CO2 emissions from electricity generation for different countries.
Market Analysis and Trends
Energy & Utilities
The slide analyzes the cost-effectiveness of FCEV buses powered by wind versus grid-powered BEV buses in terms of carbon abatement costs and CO2 emissions from electricity generation.
FCEV, BEV, wind, grid, carbon abatement
false
Market Analysis and Trends
Energy & Utilities energy-and-utilities
Mixed Chart
Kearney
View slide
The slide is graphically intricate with a timeline, icons, and financial data. It features a combination of timelines with icons indicating specific events, accompanied by financial figures and text explanations. Color coding assists in distinguishing different elements, while a financial summary box at the bottom provides a quick overview. The overall layout is balanced, incorporating both visual and textual information in a cohesive design.
Mergers and Acquisitions
Industrial & Manufacturing
It outlines a corporate strategy following an acquisition, showing how the integration aligns with long-term company goals in the composites sector. The slide is useful for discussing post-merger integration strategies and financial impact.
FCG, Michelin, polymer composites, strategy, acquisition, integration, financials, long-term goals, synergy
false
Mergers and Acquisitions
Industrial & Manufacturing industrial-and-manufacturing
Header Vertical
Morgan Stanley
View slide
This slide displays a title, two column charts comparing filings, finalisations, and pending applications, and a line graph showing clearance rates for FCoA and FCC, indicating a backlog in both courts.
Regulatory and Compliance
Government & Public Sector
The slide compares filings and finalisations in FCoA and FCC, revealing a pending caseload exceeding filed and finalised cases, and examines clearance rates, suggesting a lag in keeping pace with filings.
FCoA, FCC, case filings, finalisations, clearance rates, legal backlog, pending applications
false
Regulatory and Compliance
Government & Public Sector government-and-public-sector
Multiple Chart
PwC/Strategy&
View slide
This slide features a title, a column chart about average attendances in FCoA and FCC from 2012-2017. A side note emphasizes a 45% higher attendance in FCoA. Icons representing legal elements are present. Red and black colors dominate, with annotations for clarity.
Regulatory and Compliance
Government & Public Sector
The slide compares court attendances between FCoA and FCC over five years, highlighting the significantly higher attendance required by litigants in the FCoA, with cost implications and details on case management practices.
FCoA, FCC, court attendances, final order finalisation, litigation costs, pre-trial management
false
Regulatory and Compliance
Government & Public Sector government-and-public-sector
Mixed Chart
PwC/Strategy&
View slide
A slide with a title and two column charts, one indicating the percent of finalisations older than 12 months, the other showing unallocated cases by location, both focusing on FCoA and FCC data.
Regulatory and Compliance
Government & Public Sector
This slide sheds light on the growing age of matters when they are finalised and the number of unallocated cases within the FCoA, highlighting challenges in case allocation and completion times.
FCoA, FCC, finalisation age, unallocated cases, case management, legal system challenges
false
Regulatory and Compliance
Government & Public Sector government-and-public-sector
Multiple Chart
PwC/Strategy&
View slide
The slide features a title and a single column chart tracking the median time to trial for family law final order cases from 2012-2017 in FCoA and FCC, with annotations highlighting a growing median time to trial.
Regulatory and Compliance
Government & Public Sector
This slide presents the increasing median time to trial in both FCoA and FCC over five years, with a clear indication that the time to trial is growing, alongside important caveats regarding the resolution of cases.
FCoA, FCC, median time to trial, final orders, case resolution, legal proceedings
false
Regulatory and Compliance
Government & Public Sector government-and-public-sector
Mixed Chart
PwC/Strategy&
View slide
A slide with a title, a column and a line chart, one showing the number of pending cases and the other the percentage of cases pending over 12 months, both comparing FCoA and FCC from 2012-2017.
Regulatory and Compliance
Government & Public Sector
The slide addresses the caseload of matters pending applications and the age of matters pending in both courts, with an emphasis on the growth in the number of pending cases and their duration.
FCoA, FCC, pending cases, legal system, caseload growth, final order applications
false
Regulatory and Compliance
Government & Public Sector government-and-public-sector
Multiple Chart
PwC/Strategy&
View slide
This slide shows a title, two column charts displaying trial lengths for FCoA and FCC, and a pie chart depicting reserved judgments delivery time. It uses red and orange hues with clear labels and a note on trial length comparison.
Regulatory and Compliance
Government & Public Sector
It breaks down the trial lengths for matters heard in FCoA and FCC, the percentage of reserved judgments delivered within three months, and highlights the significant difference in trial lengths between the two courts.
FCoA, FCC, trial lengths, reserved judgments, case management, legal proceedings
false
Regulatory and Compliance
Government & Public Sector government-and-public-sector
Multiple Chart
PwC/Strategy&
View slide
Two donut charts side by side comparing the share of FDI in Central America from the USA between 2021 and 2022. Each segment is color-coded.
Investment Analysis
Financial Services
The slide compares the share of Foreign Direct Investment in Central America from the USA for the years 2021 and 2022, highlighting the changes in investment distribution by country.
FDI, Central America, USA, donut chart, comparison
false
Investment Analysis
Financial Services financial-services
Multiple Chart
Deloitte
View slide
A multi-line chart showing FDI variations across several Central American countries from 2015 to 2022. Each country is represented by a different color.
Investment Analysis
Financial Services
This slide compares the Foreign Direct Investment trends in various Central American countries, indicating significant events and their impact on FDI for each country.
FDI, Central America, country comparison, trends
false
Investment Analysis
Financial Services financial-services
Single Chart
Deloitte
View slide
A line chart depicting the annual variation of FDI in Central America from 2015 to 2022, with notable events marked along the timeline. The chart uses a single blue line on a black background.
Investment Analysis
Financial Services
The slide shows the trend of Foreign Direct Investment in Central America, noting significant events that impacted investment levels, such as tariffs, COVID-19, and the Russia-Ukraine war.
FDI, Central America, investment, line chart, trends
false
Investment Analysis
Financial Services financial-services
Single Chart
Deloitte
View slide
The slide includes a line chart showing the decline in foreign direct investment (FDI) in China over 25 years. It provides commentary and implications for corporates.
Market Analysis and Trends
Financial Services
The slide analyzes the trend of declining FDI in China due to geopolitical tensions and economic factors. It discusses the potential impacts on foreign companies and investment strategies.
FDI, China, geopolitical tension, economic analysis, financial services
false
Market Analysis and Trends
Financial Services financial-services
Mixed Chart
Accenture
View slide
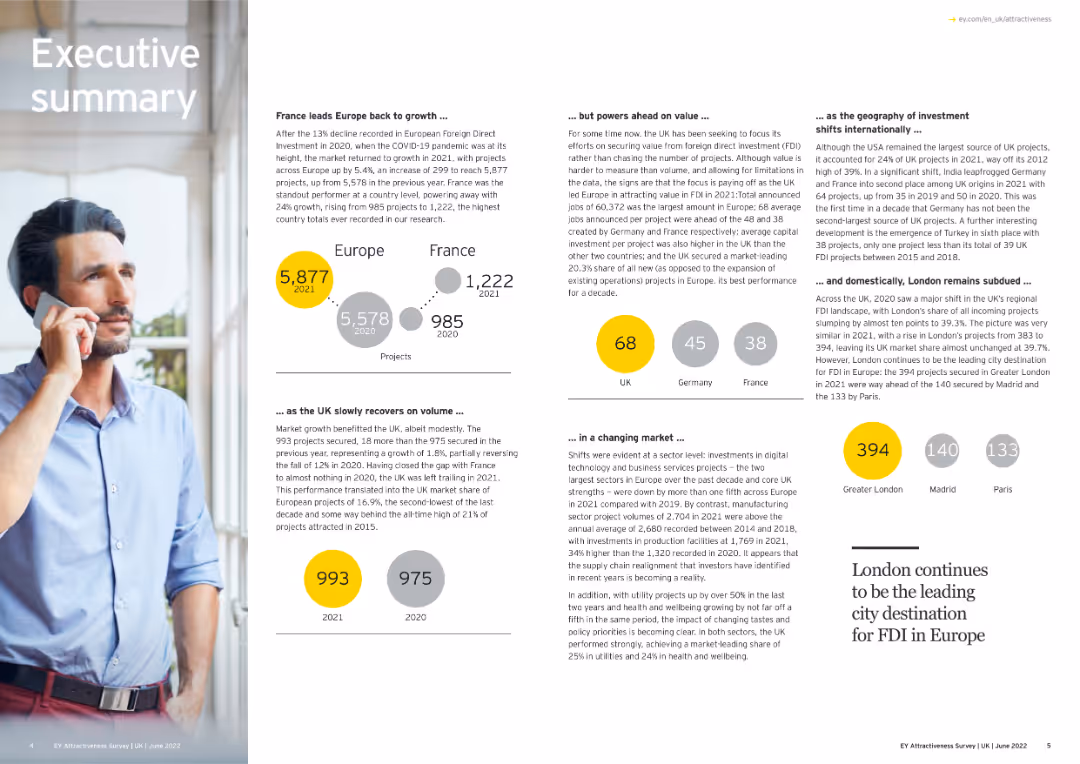
The slide combines text and visuals to summarize key points about Europe's FDI growth and shifts.
Strategic Planning
Financial Services
This executive summary slide provides an overview of FDI growth in Europe, highlighting France's lead, UK's recovery, and shifts in investor focus and market dynamics. It includes visual elements like project numbers and geographical investment distribution.
FDI, Europe, Investment Trends, Market Dynamics
false
Strategic Planning
Financial Services financial-services
Multiple Chart
EY
View slide
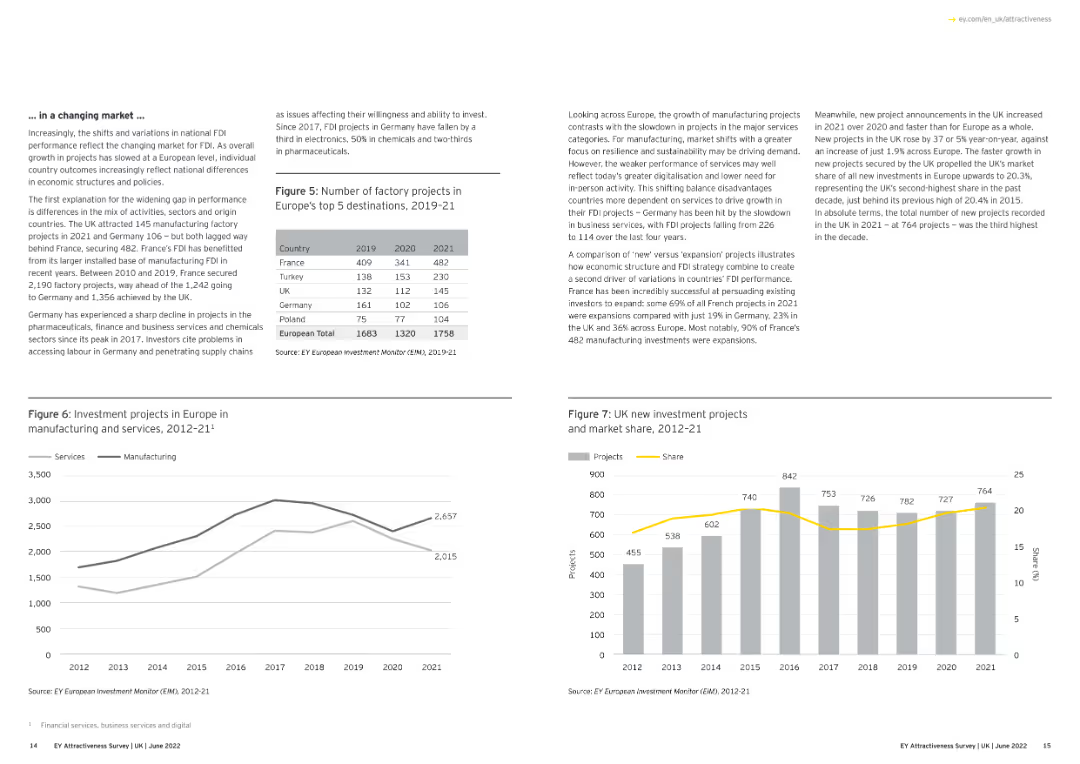
The slide features text and line charts illustrating FDI project trends in Europe.
Market Analysis and Trends
Financial Services
This slide analyzes FDI trends in Europe, emphasizing changes in national FDI performance, the impact of market shifts, and the variation in investment project types and numbers across major European countries.
FDI, Europe, Market Trends, Investment Projects
false
Market Analysis and Trends
Financial Services financial-services
Multiple Chart
EY
View slide
Pie chart of FDI by regions and a bar chart showing top five investing countries by FDI in Europe.
Market Analysis and Trends
Financial Services
This slide examines the origins of FDI in Europe, with a significant share coming from European companies.
FDI, Europe, investing countries, regions, origin
false
Market Analysis and Trends
Financial Services financial-services
Multiple Chart
EY
View slide
A table listing the top 15 FDI countries in 2022 with statistics on the number of projects, change from the previous year, and jobs created, alongside an explanatory text box.
Market Analysis and Trends
Financial Services
The slide presents detailed data on FDI projects and job creation in Europe, ranking the top 15 countries and analyzing their performance.
FDI, Europe, investment, projects, data
false
Market Analysis and Trends
Financial Services financial-services
Table
EY
View slide
A map of Europe showing FDI projects by country, with highlighted statistics and an accompanying text box providing context and analysis.
Market Analysis and Trends
Financial Services
The slide provides an overview of FDI projects in Europe by country, highlighting the variations in FDI performance across different regions.
FDI, Europe, investment, projects, map
false
Market Analysis and Trends
Financial Services financial-services
Graphic
EY
View slide
The slide features a map of Greece highlighting investment distribution across regions with corresponding percentage values. Images of different regions are shown on the right.
Market Analysis and Trends
Financial Services
This slide illustrates the geographical distribution of foreign direct investments in Greece, showing which regions have attracted the most investment in recent years.
FDI, Greece, geographical distribution, regions, map
false
Market Analysis and Trends
Financial Services financial-services
Mixed Chart
EY
View slide
Text is divided into two columns with a photo on the left showing business professionals. The right side includes a vertical bar chart of FDI projects per year from 2000-2022.
Investment Analysis
Financial Services
This slide provides data from the EY European Investment Monitor, showcasing trends in FDI projects in Greece, including historical data and recent performance.
FDI, Greece, investment, historical data, trends
false
Investment Analysis
Financial Services financial-services
Multiple Chart
EY
View slide
This slide contains text-heavy content divided into sections with subheadings and bullet points. A circular infographic on the right highlights key statistics.
Market Analysis and Trends
Financial Services
The executive summary provides an overview of foreign direct investment in Greece, including performance metrics, investment trends, and economic risks.
FDI, Greece, investment, summary, economic risks
false
Market Analysis and Trends
Financial Services financial-services
Multiple Chart
EY
View slide
A combination of text and a vertical bar chart showing FDI inflows into Greece from 2012-2022. The left side features a background image of olive branches and sunset.
Market Analysis and Trends
Financial Services
This slide details the trends in foreign direct investment in Greece over the last decade, highlighting significant increases and the sectors attracting the most investment.
FDI, Greece, investment, trends, sectors, 2012-2022
false
Market Analysis and Trends
Financial Services financial-services
Multiple Chart
EY
View slide
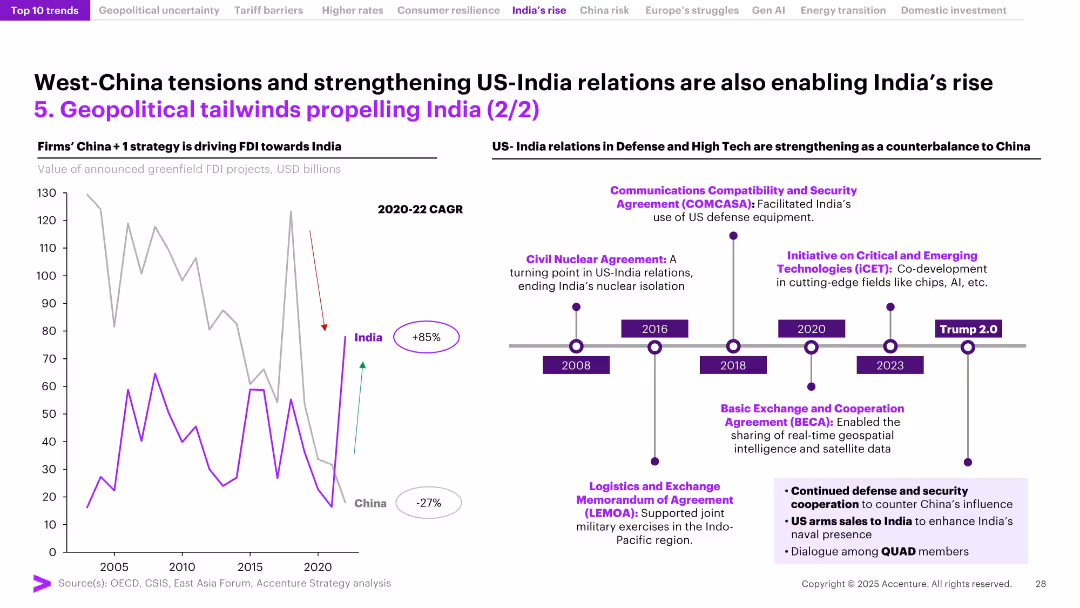
Left panel shows a line chart comparing FDI to India and China, with CAGR noted; right side features a US–India defense partnership timeline.
Strategic Planning
Government & Public Sector
The slide attributes India's FDI surge to geopolitical shifts, including the China+1 strategy and US–India defense collaborations. Key agreements highlight deeper cooperation in defense and emerging tech. India’s attractiveness as an investment destination is reinforced by improving bilateral ties and global supply chain diversification.
FDI, India, China, US relations, defense agreements, geopolitical tailwinds, China+1, foreign investment, trade diversification, national security
false
Strategic Planning
Government & Public Sector government-and-public-sector
Mixed Chart
Accenture
View slide
Slide includes a pie chart, a column chart, and detailed listings of FDI inflows. Clean layout with emphasis on data presentation and sector analysis.
Investment Analysis
Financial Services
Reviews foreign direct investment in the Philippines, showing trends over recent years and breakdown by industry, including major restrictions.
FDI, Philippines, investment, industry, trends, restrictions
false
Investment Analysis
Financial Services financial-services
Multiple Chart
Deloitte
View slide
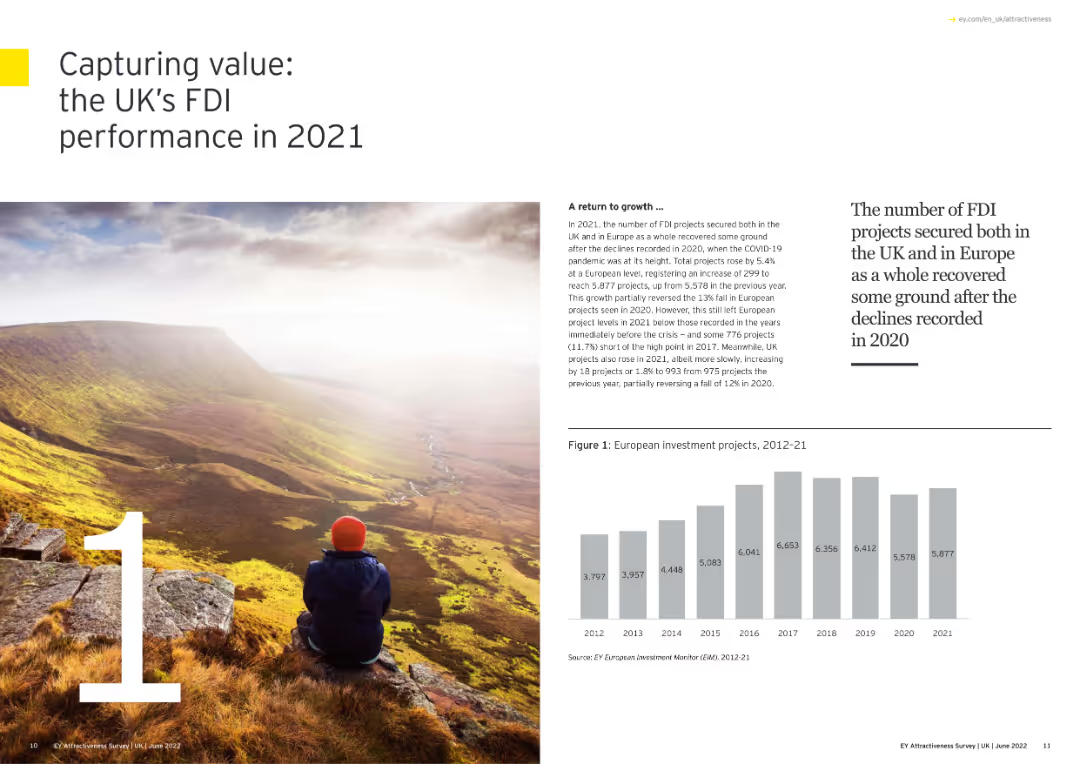
The slide has a scenic image with overlaid text summarizing the UK’s FDI performance.
Market Analysis and Trends
Financial Services
The slide summarizes the UK's FDI performance in 2021, highlighting the recovery from 2020, growth in project numbers, and the UK's leading position in attracting new FDI projects across Europe.
FDI, UK, Performance, Recovery, Growth
false
Market Analysis and Trends
Financial Services financial-services
Mixed Chart
EY
View slide
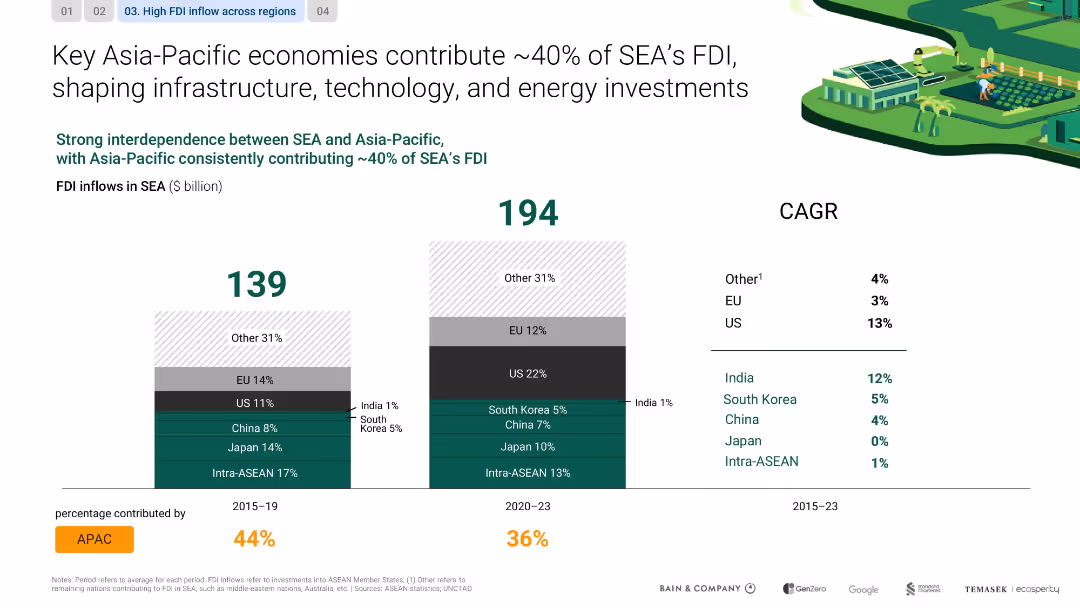
Dual bar charts comparing FDI inflows across time periods; color-coded by region; CAGR on the side
Investment Analysis
Financial Services
The slide shows how Asia-Pacific accounts for a steady 40% of FDI into SEA, highlighting the roles of China, Japan, and intra-ASEAN flows in shaping investments in infrastructure, energy, and technology.
FDI, infrastructure, SEA, China, Japan, ASEAN, investment, technology
false
Investment Analysis
Financial Services financial-services
Single Chart
Bain
View slide
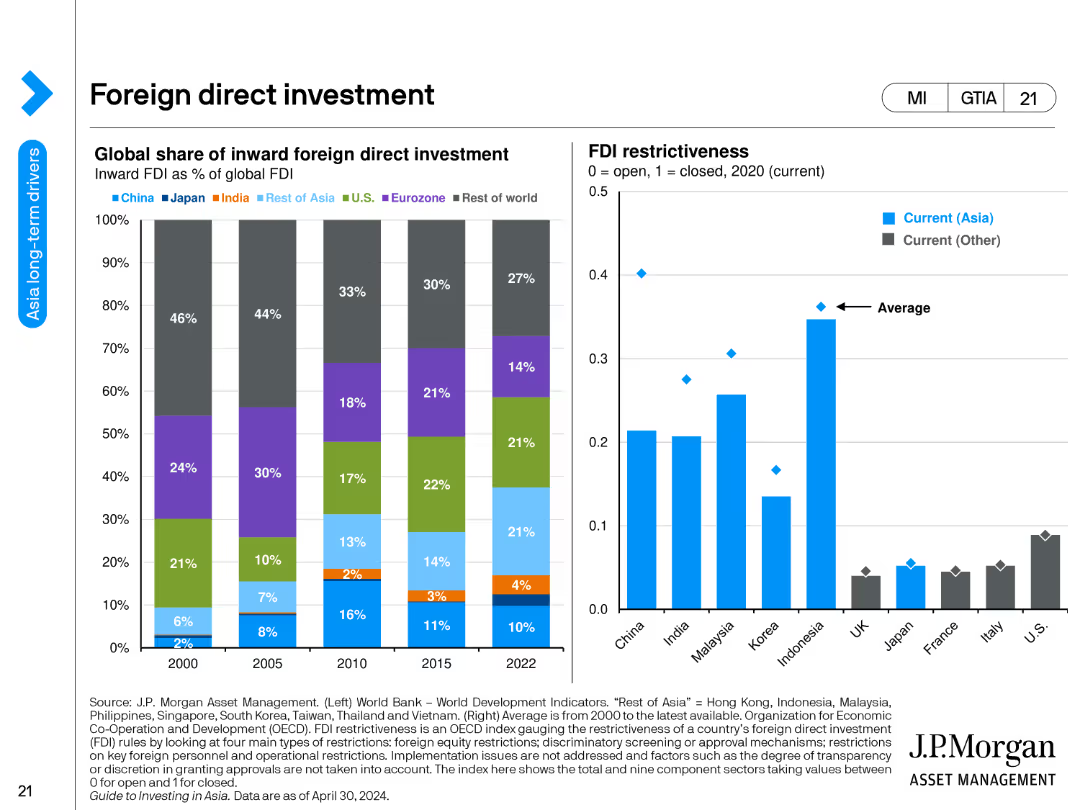
The slide contains two bar charts. The left chart shows the global share of inward foreign direct investment as a percentage of global FDI from 2000 to 2022 for various regions including China, Japan, India, the US, Eurozone, and others. The right chart measures FDI restrictiveness in 2020 for selected countries.
Investment Analysis
Financial Services
This slide examines global foreign direct investment trends and FDI restrictiveness. It compares the share of FDI among different regions over time and evaluates the openness of various countries to foreign investments based on restrictiveness scores.
FDI, investment, global, share, restrictiveness, financial services, bar chart, regions, countries
false
Investment Analysis
Financial Services financial-services
Multiple Chart
JP Morgan
View slide
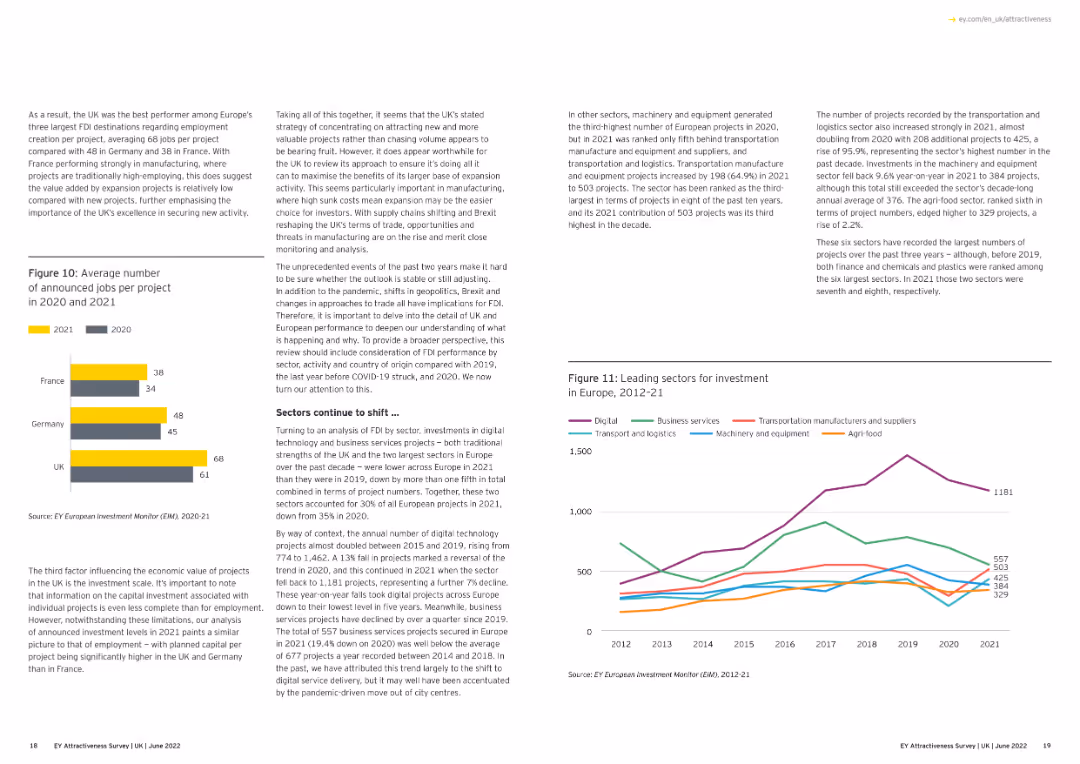
This slide features a column chart comparing the average number of announced jobs per project in 2020 and 2021 for the UK, Germany, and France.
Market Analysis and Trends
Financial Services
The slide presents a comparison of the average number of announced jobs per project in 2020 and 2021 across three countries, highlighting the UK's performance.
FDI, jobs, comparison, UK, Germany, France
false
Market Analysis and Trends
Financial Services financial-services
Multiple Chart
EY
View slide
A column chart showing the number of foreign investment projects and jobs created from 2010 to 2022, with an accompanying text box providing context.
Market Analysis and Trends
Financial Services
The slide presents the trends in foreign direct investment projects and jobs in Europe over a period of time and discusses the factors influencing these trends.
FDI, trends, Europe, investment, jobs
false
Market Analysis and Trends
Financial Services financial-services
Mixed Chart
EY
View slide
Detailed textual slide with four bullet points outlining areas of concern regarding FGA's impact on technology venture investing.
Strategic Planning
Technology & Software
A thorough assessment of FGA's influence on the technology venture investing market, evaluating four key areas. It's beneficial for strategic planning and understanding FGA's role in market dynamics.
FGA, Impact, Technology, Venture Investing, Strategic Assessment
false
Strategic Planning
Technology & Software technology-and-software
Header Vertical
Oliver Wyman
Previous
Loading...
Hold On!
We are searching in our database
If nothing, comes up, please try different filters!
Column Chart
Heatmap
Chevron
Org Chart
Infographic
Callouts
Timeline
List
Graphic
Picture
Process Flow
Diagram
Paragraph
Map
Table
Framework
Subtitle
Takeaway Box
Icon
Other Chart
Radar Chart
Waterfall Chart
Mekko Chart
Pie Chart
Scatter Plot
Line Chart
Bar chart
Bullet points
Create a FREE account to continue browsing
Receive Instant Access to 1,000+ slides from companies like McKinsey, Google, and Goldman Sachs
First Name
Last Name
Email
Password
I agree to all
Terms & Privacy Policy
Thank you! Your submission has been received!
Oops! Something went wrong while submitting the form.
Have an account?
Sign in
Upgrade to PRO to Save slides
Advanced Search and Filters
Access to 15,000+ slides
Access to Category Pages
Save/Bookmark Slides
PowerPoint Template Library
Pick a Plan
MONTHLY
$12/month
Billed every month, Cancel anytime.
YEARLY
$9/year
Billed $108 annually, Cancel anytime.
Checkout for $12/month
Checkout for $108/yr
Secured by Stripe | AES-256 bit encryption