My Account
My Slides
Search by Category
Templates
View All Templates
Download Template Slides
Leave Feedback
Login
Logout
Get Started
Browse all Slides
Browse all Slides
Create a FREE Account
Instant access to 1,000+ real slides from top companies like McKinsey, BCG, Goldman Sachs, Google and many more!
First Name
Last Name
Email
Password
I agree to all
Terms & Privacy Policy
Thank you! Your submission has been received!
Oops! Something went wrong while submitting the form.
Have an account?
Sign in
Spark Your Next Big Idea with New Presentation Templates
VIEW ALL Templates
Welcome,
Welcome
PRO
Show Featured Only
Checkbox 8
Companies
Mckinsey
Bain
BCG
EY
Deloitte
Accenture
PwC/Strategy&
JP Morgan
Goldman Sachs
Morgan Stanley
Citigroup
Deutsche Bank
Barclays
LEK
KPMG
Kearney
Oliver Wyman
Booz Allen Hamilton
Gartner
IPSOS
Nielsen
Slide type
Text Only
Linear Flow
Vertical Flow
Single Chart
Header Horizontal
Mixed Chart
Header Vertical
Pillar
Multiple Chart
Graphic
Agenda
Title
Table
Framework
Industry
Technology & Software
Artificial Intelligence
Financial Services
Retail & E-commerce
Consumer Goods
Industrial & Manufacturing
Transportation & Logistics
Telecommunications
Real Estate & Construction
Hospitality & Tourism
Professional Services
Education & Training
Media & Entertainment
Agriculture & Food Production
Healthcare & Pharmaceuticals
Environmental Services & Sustainability
Government & Public Sector
Use Case
Mergers and Acquisitions
Performance Metrics and KPIs
Client Case Studies
Competitive Landscape
Corporate Finance and Valuation
Product and Service Analysis
Customer and Market Segmentation
Organizational Structure and Change
Industry Overview
Regulatory and Compliance
Risk Assessment and Management
Investment Analysis
Organizational Structure and Change
Human Resources and Talent Management
Financial Performance
Market Analysis and Trends
Sales and Business Development
Human Resources and Talent Management
Clear all
Thank you! Your submission has been received!
Oops! Something went wrong while submitting the form.
Tag
View slide
Features vertical bar (column) charts representing YoY expense changes, with labels for each category of change, and a side note panel.
Financial Performance
Financial Services
Analyzes year-over-year expense variations for Citi, useful for financial discussions focused on cost management and operational efficiency.
Expenses, Year-over-Year, Analysis, Column Charts, Transformation Investment, Business-led Investment, Citi, Operational Efficiency
false
Financial Performance
Financial Services financial-services
Single Chart
Citigroup
View slide
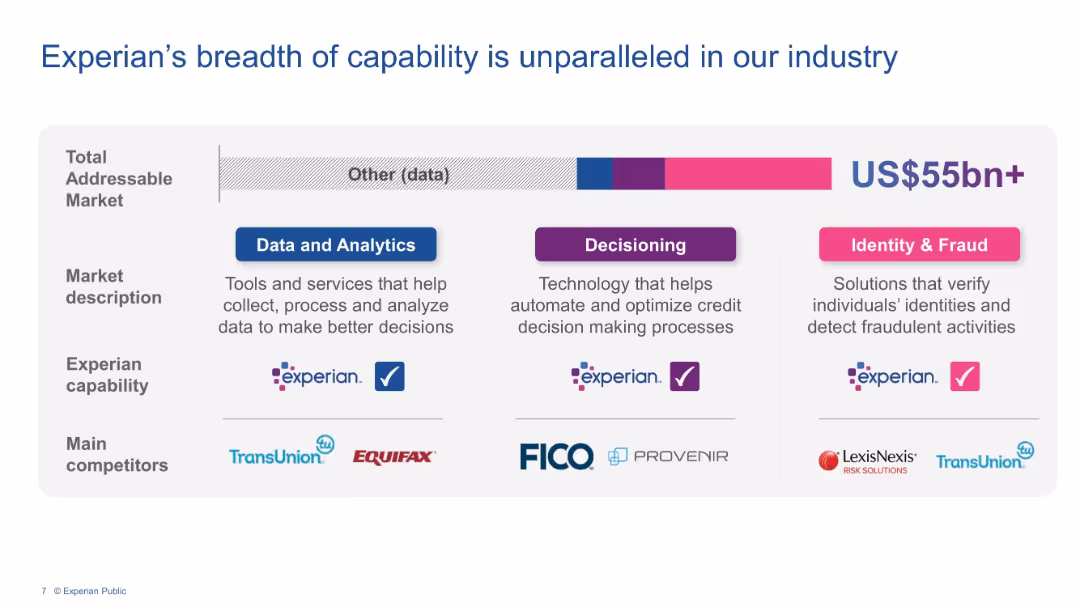
Three-column grid showing capabilities across Data & Analytics, Decisioning, and Identity & Fraud.
Product and Service Analysis
Financial Services
Highlights Experian’s extensive capabilities in data services, credit decisioning, and fraud detection. Describes market segments, company positioning, and competitors like TransUnion, Equifax, FICO, and LexisNexis.
Experian, data analytics, credit decisioning, fraud prevention, market capability, competitors
false
Product and Service Analysis
Financial Services financial-services
Mixed Chart
Barclays
View slide
Slide shows a simple, structured layout with a list of strategic goals and initiatives aimed at expanding Experian's market presence.
Strategic Planning
Financial Services
Discusses Experian's mission to expand and innovate within the consumer data space, detailing strategies for financial inclusion and market leadership enhancement.
Experian, market leadership, consumer data, financial inclusion, innovation
false
Strategic Planning
Financial Services financial-services
Pillar
Barclays
View slide
A bar chart detailing the issues faced by users of crypto trading platforms in 2023 and 2022, with categories like withdrawal issues, fee misunderstandings, and hacking.
Customer and Market Segmentation
Financial Services
This slide presents user-reported issues experienced on crypto trading platforms, comparing data from 2023 and 2022.
Experiences, issues, crypto, trading, platforms, 2023, 2022
false
Customer and Market Segmentation
Financial Services financial-services
Mixed Chart
IPSOS
View slide
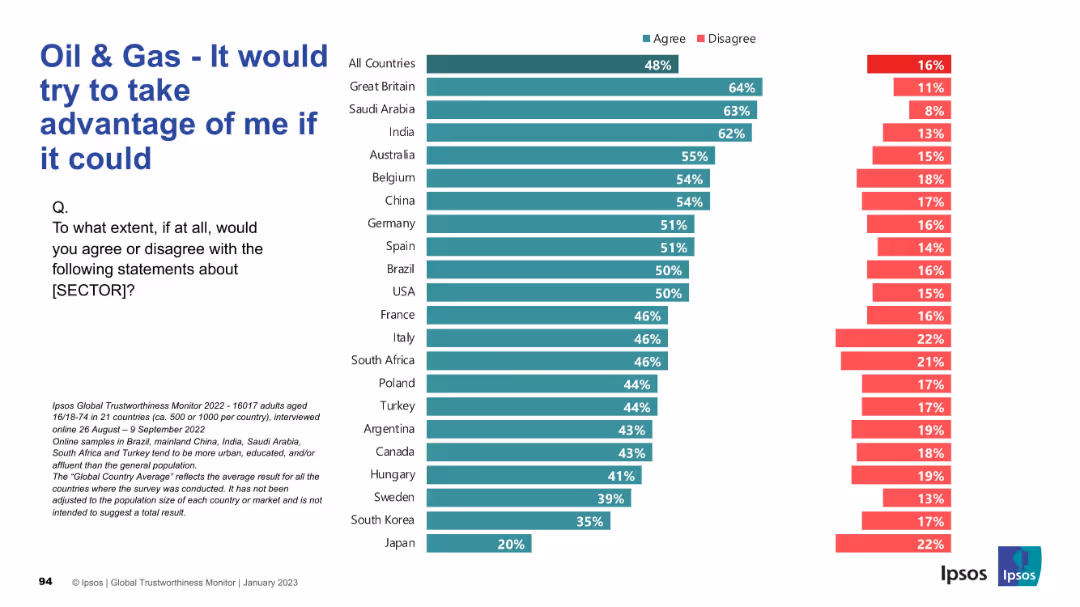
Reversed sentiment chart with “agree” indicating negative perception. Highest scores shown on top (e.g. Great Britain, Saudi Arabia, India).
Market Analysis and Trends
Energy & Utilities
Respondents indicate whether they believe the oil & gas sector would exploit them if it could. Unlike previous slides, high agreement reflects mistrust. The perception is notably high in Western and some developing countries.
Exploitation, Mistrust, Oil & Gas, Ipsos, Ethics, Global Trust, Sector Perception, Public View, Energy Industry
false
Market Analysis and Trends
Energy & Utilities energy-and-utilities
Mixed Chart
IPSOS
View slide
Comparative flowchart showing current and proposed task-based approaches for FSS workers. Includes detailed explanations of service disruptions and improvements.
Operational Efficiency
Professional Services
Slide includes a detailed flowchart comparing case-based and task-based approaches to managing applications within DEHS.
Explores different approaches to handling service delivery within DEHS, contrasting the current case-based model with a proposed task-based approach to improve efficiency.
false
Operational Efficiency
Professional Services professional-services
Linear Flow
Alvarez & Marsal
View slide
A horizontal layout showing key export products of various Central American countries. Each product is listed under the respective country’s flag and accompanied by percentage data.
Market Analysis and Trends
Industrial & Manufacturing
The slide highlights the main export products from different Central American countries, showcasing their manufacturing capabilities and potential for leveraging friendshoring opportunities.
Exports, Central America, products, friendshoring, manufacturing
false
Market Analysis and Trends
Industrial & Manufacturing industrial-and-manufacturing
Linear Flow
Deloitte
View slide
A tree map and a donut chart depicting the main export products and destinations from Central America. The tree map uses different colors for each product, while the donut chart shows export destinations.
Market Analysis and Trends
Transportation & Logistics
This slide provides a visual breakdown of the main export products from Central America and their destinations, emphasizing trade relationships and the significance of various products.
Exports, Central America, trade, tree map, donut chart
false
Market Analysis and Trends
Transportation & Logistics transportation-and-logistics
Multiple Chart
Deloitte
View slide
Descriptions of extended reality (XR), mixed reality (MR), augmented reality (AR), and virtual reality (VR), with a column chart showing the projected market size of XR technologies from 2018 to 2030.
Technology and Digital Transformation
Technology & Software
The slide discusses the different types of extended reality technologies, including XR, MR, AR, and VR. It emphasizes the potential impact of these technologies on various sectors and projects significant market growth for XR technologies by 2030.
Extended Reality, XR, AR, VR, Market Size
false
Technology and Digital Transformation
Technology & Software technology-and-software
Mixed Chart
Roland Berger
View slide
Combines text with a column chart of top strategic risks for the next three years, emphasizing the ubiquity of cyber threats and geopolitical risks.
Risk Assessment and Management
Financial Services
This slide discusses the top external forces impacting CROs, focusing on the increasing threat of cyber attacks and geopolitical tensions, supported by survey data on strategic risks.
External Forces, Cyber Threats, Geopolitical Risks, Strategic Risks
false
Risk Assessment and Management
Financial Services financial-services
Single Chart
EY
View slide
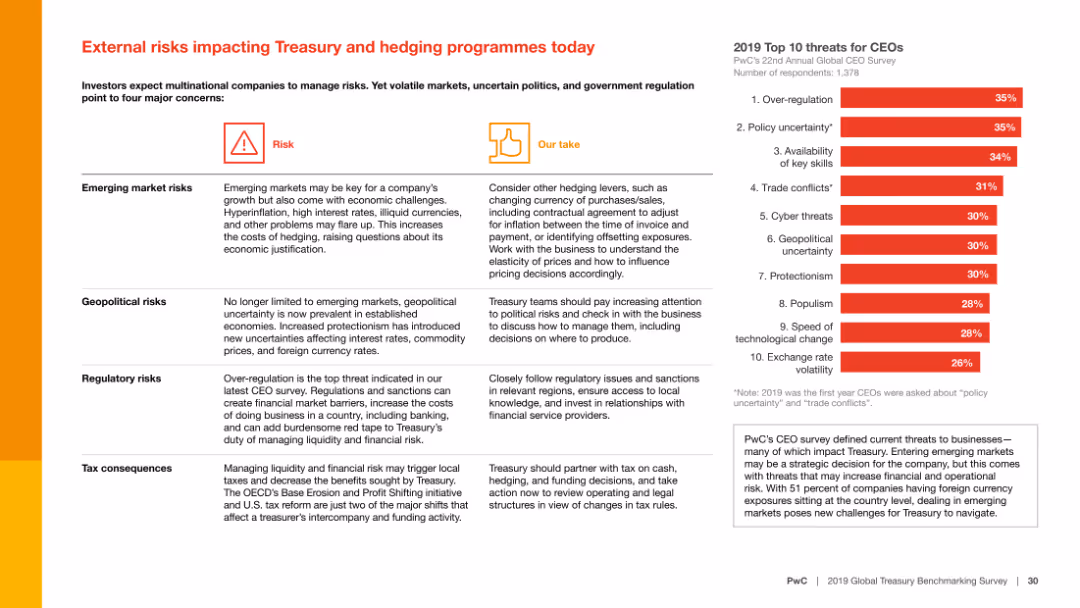
The slide contains text with a summary of external risks such as emerging market risks, geopolitical risks, regulatory risks, and tax consequences, alongside a column chart showing the top 10 threats for CEOs.
Risk Assessment and Management
Financial Services
The slide identifies major external risks impacting treasury and hedging programs, including emerging market risks and geopolitical uncertainties, and provides strategies to address these concerns.
External risks, Treasury, hedging, emerging markets, geopolitical risks, regulatory risks, tax consequences, financial services, risk management, threats for CEOs
false
Risk Assessment and Management
Financial Services financial-services
Mixed Chart
PwC/Strategy&
View slide
Two panels with pie and bar charts showing top external risks to business growth from a local and global perspective.
Risk Assessment and Management
Professional Services
This slide identifies the greatest external risks to business growth, highlighting sustained inflation and pandemic-related disruptions as top concerns.
External risks, business growth, inflation, pandemic, disruptions, global perspective, analysis, top concerns
false
Risk Assessment and Management
Professional Services professional-services
Multiple Chart
EY
View slide
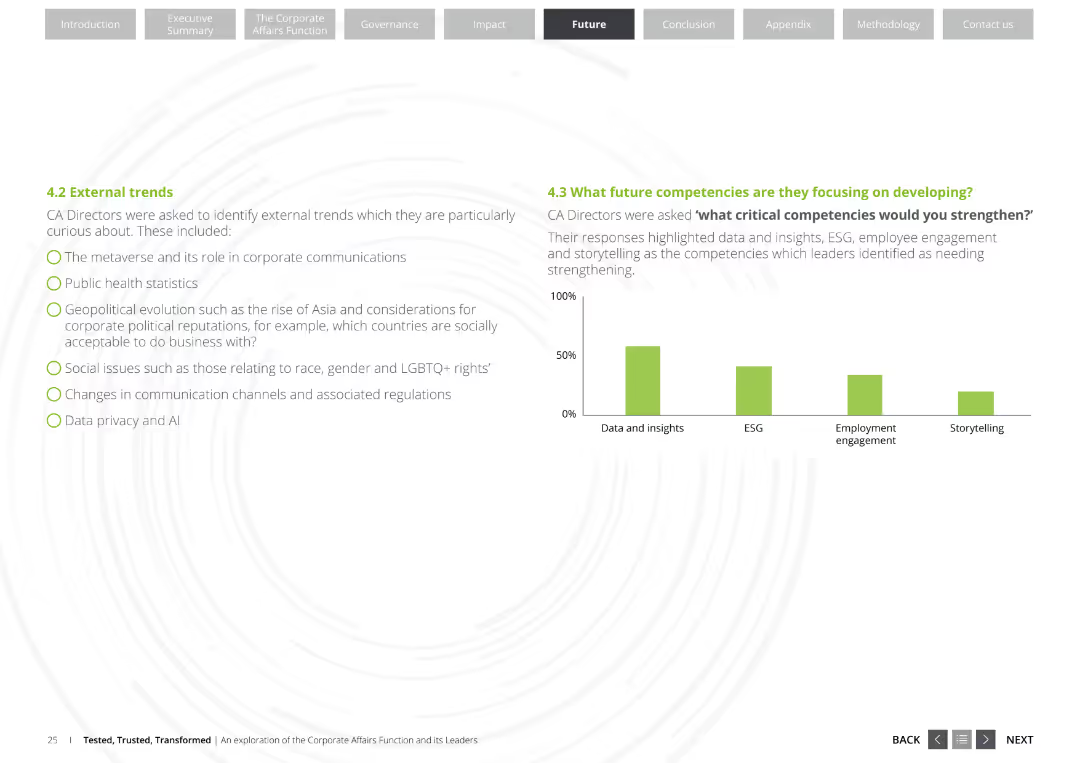
The slide features a bulleted list of external trends relevant to Corporate Affairs Directors, such as the metaverse, public health statistics, and data privacy. It also includes a column chart showing future competencies focus.
Market Analysis and Trends
Professional Services
This slide lists key external trends impacting corporate communications and highlights critical competencies Corporate Affairs Directors are focusing on developing, such as data and insights, ESG, and storytelling.
External trends, Corporate Affairs, Competencies, Data privacy, ESG
false
Market Analysis and Trends
Professional Services professional-services
Mixed Chart
Deloitte
View slide
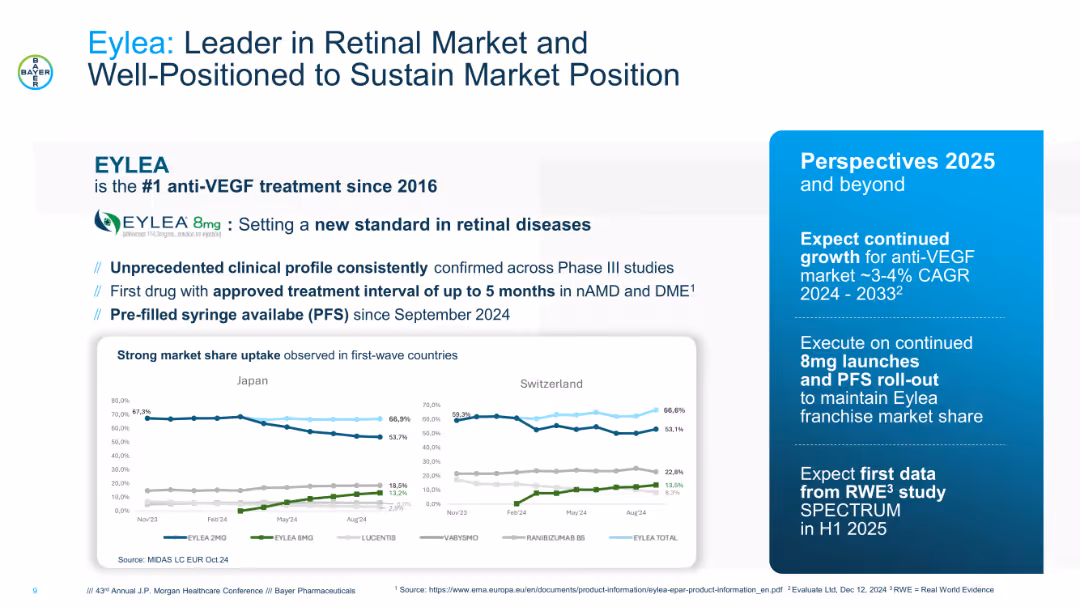
Blue-accented slide with bold header and product branding. Features market share charts for Japan and Switzerland, bulleted clinical strengths, and a sidebar outlining future growth perspectives.
Market Analysis and Trends
Healthcare & Pharmaceuticals
Focuses on Eylea’s market leadership in retinal diseases, emphasizing its superior clinical profile, recent product enhancements (8mg and PFS), and global market share trends. Also presents strategic outlook for sustaining growth in a stable anti-VEGF market through 2033.
Eylea, retinal market, anti-VEGF, growth strategy, PFS, clinical profile, ophthalmology
false
Market Analysis and Trends
Healthcare & Pharmaceuticals healthcare-and-pharmaceuticals
Multiple Chart
JP Morgan
View slide
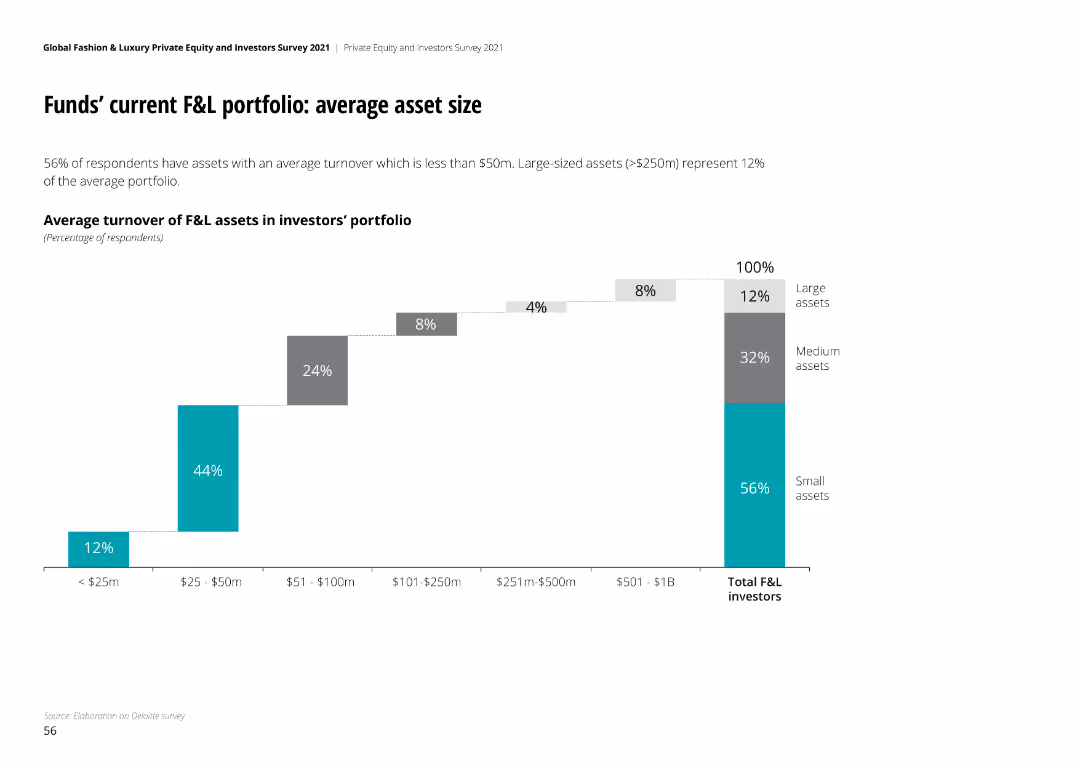
The slide contains a column chart showing the average turnover of F&L assets in investors' portfolios, categorized by asset size.
Market Analysis and Trends
Financial Services
This slide analyzes the average asset size within current F&L portfolios, detailing the distribution of asset turnovers across various size categories.
F&L, portfolio, asset size, turnover, analysis
false
Market Analysis and Trends
Financial Services financial-services
Single Chart
Deloitte
View slide
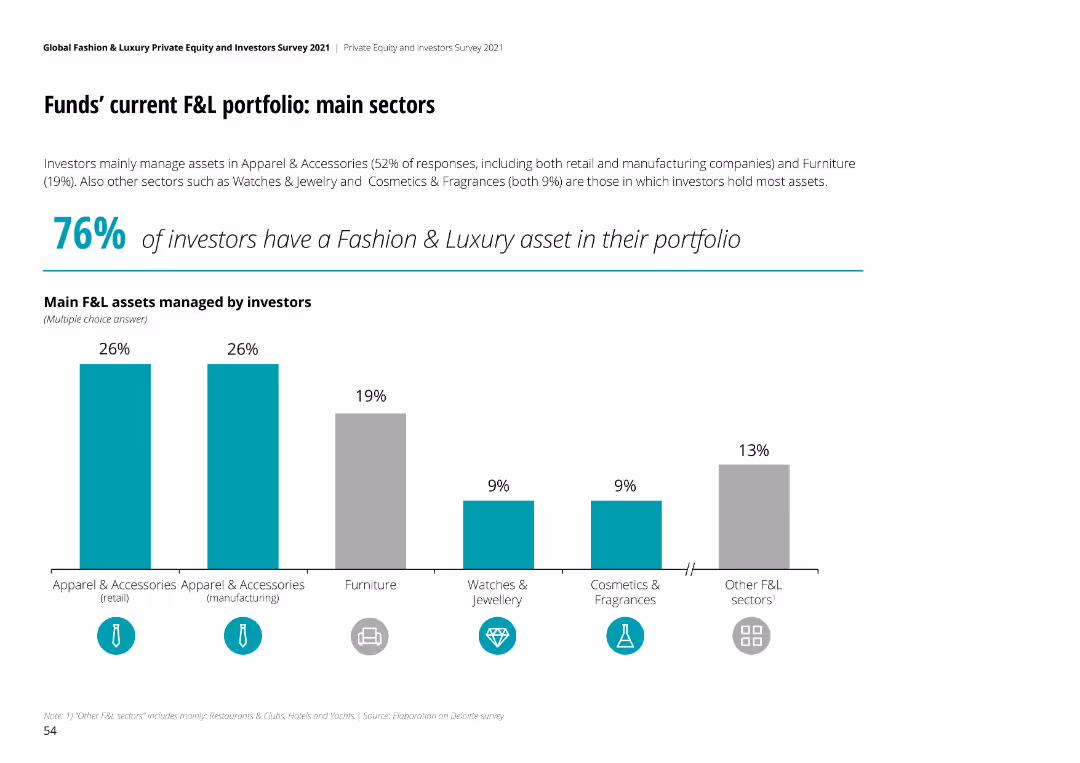
The slide contains a column chart showing the main sectors of F&L assets managed by investors, along with a key finding highlight.
Market Analysis and Trends
Financial Services
This slide presents the main sectors of current F&L portfolios managed by investors, indicating the proportion of assets in various sectors.
F&L, portfolio, sectors, investors, analysis
false
Market Analysis and Trends
Financial Services financial-services
Mixed Chart
Deloitte
View slide
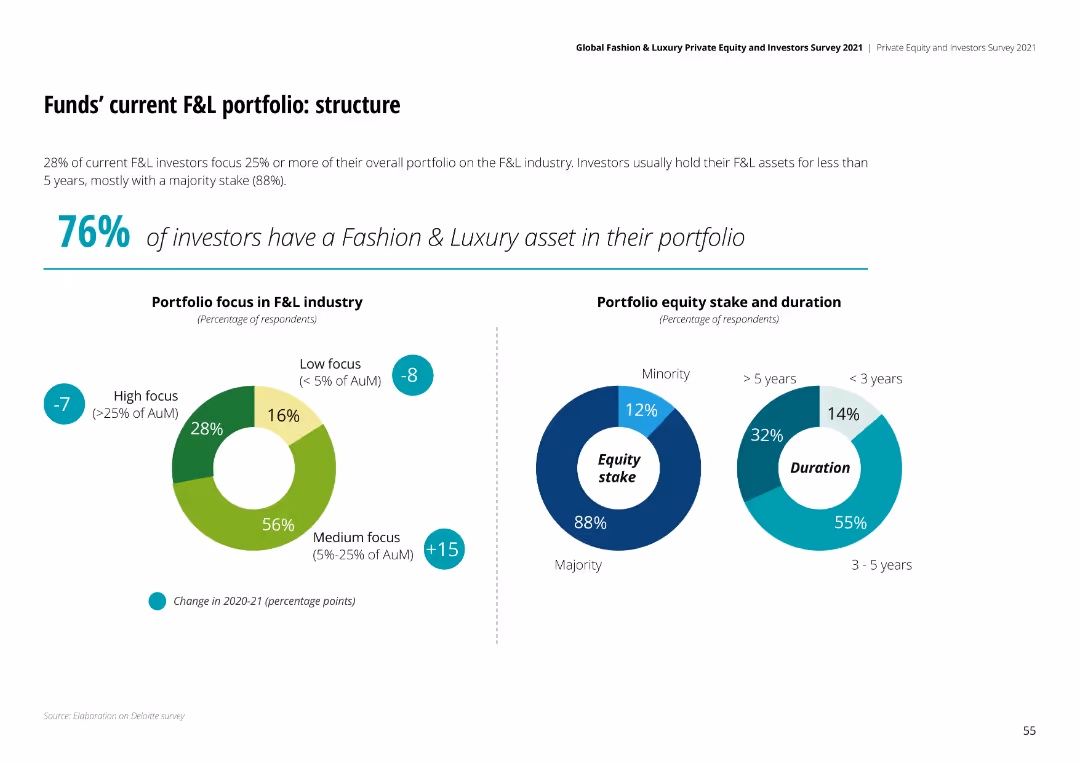
The slide includes pie charts and column charts showing the focus, equity stake, and duration of F&L portfolios, with key findings highlighted.
Strategic Planning
Financial Services
This slide discusses the structure of F&L portfolios, focusing on portfolio concentration, equity stake, and asset holding duration.
F&L, portfolio, structure, equity stake, duration
false
Strategic Planning
Financial Services financial-services
Multiple Chart
Deloitte
View slide
The slide contains a scatter plot with vehicle classifications as mid-size and full-size and their corresponding units sold, marked by various truck models including F-150. There's a distinct arrow pointing to the F-150 indicating its lead in the market. The color palette is a mix of greens, grays, and reds with a clear text overlay.
Market Analysis and Trends
Transportation & Logistics
The slide presents data from the American University's Made in American Auto Index, showcasing the F-150 truck as a leader in sales and its status as the most American-made truck.
F-150, American-made, trucks, auto industry, sales, market leader, full-size pickup
false
Market Analysis and Trends
Transportation & Logistics transportation-and-logistics
Single Chart
BCG
View slide
A map of the United States showing the number of states where the F-150 is the best-selling vehicle.
Client Case Studies
Transportation & Logistics
Highlights the dominance of the F-150 as the top-selling vehicle in a vast majority of US states.
F-150, popular vehicle, US states, best-selling
false
Client Case Studies
Transportation & Logistics transportation-and-logistics
Single Chart
BCG
View slide
Slide shows a breakdown of the F-Series' contribution to US GDP through production and multiplier effects with a graph.
Financial Performance
Transportation & Logistics
Explains the significant contribution of the Ford F-Series to the US GDP, taking into account direct sales, suppliers, dealers, and the broader community impact.
F-Series, GDP contribution, manufacturing, economic impact, multiplier effects, dealers, community, Ford
false
Financial Performance
Transportation & Logistics transportation-and-logistics
Single Chart
BCG
View slide
A bar graph depicting the global top ten vehicles sold between 2010-2019 with a side image of the F-Series.
Client Case Studies
Transportation & Logistics
Asserts the F-Series as the top-selling pickup globally over the past ten years.
F-Series, best-selling, pickup truck, global market
true
Client Case Studies
Transportation & Logistics transportation-and-logistics
Single Chart
BCG
View slide
A bar graph compares the F-Series' revenue with other major consumer products and sports leagues.
Client Case Studies
Transportation & Logistics
Demonstrates the F-Series' revenue size in comparison to well-known products and major sports leagues' combined revenue.
F-Series, consumer products, sports leagues, revenue comparison
false
Client Case Studies
Transportation & Logistics transportation-and-logistics
Single Chart
BCG
View slide
A bar graph comparing the top ten vehicles sold in the US from 2010-2019.
Client Case Studies
Transportation & Logistics
Communicates the F-Series' position as the highest-selling vehicle in the US over the past decade.
F-Series, highest-selling, vehicle, US market, decade
false
Client Case Studies
Transportation & Logistics transportation-and-logistics
Single Chart
BCG
View slide
A bar graph with text on the left showing the F-Series' market share among vehicles on the road.
Client Case Studies
Transportation & Logistics
States that the F-Series trucks make up a significant percentage of vehicles on the road.
F-Series, popularity, vehicles, market share, US roads
false
Client Case Studies
Transportation & Logistics transportation-and-logistics
Single Chart
BCG
View slide
A bar graph highlights the F-Series' revenue in comparison to other notable companies.
Financial Performance
Transportation & Logistics
Shows the F-Series' revenue outperforming that of many major companies in 2019.
F-Series, revenue, companies, financial performance
false
Financial Performance
Transportation & Logistics transportation-and-logistics
Single Chart
BCG
View slide
Moderate complexity with text blocks and icons representing government, schools, and EdTech solution providers. There's a balance between text information and visual elements.
Industry Overview
Education & Training
Slide details the efforts by the public and private sectors to create alternatives to face-to-face learning, featuring case studies from Singapore, Malaysia, and Indonesia.
F2F alternatives, government, schools, EdTech providers
false
Industry Overview
Education & Training education-and-training
Header Horizontal
Bain
View slide
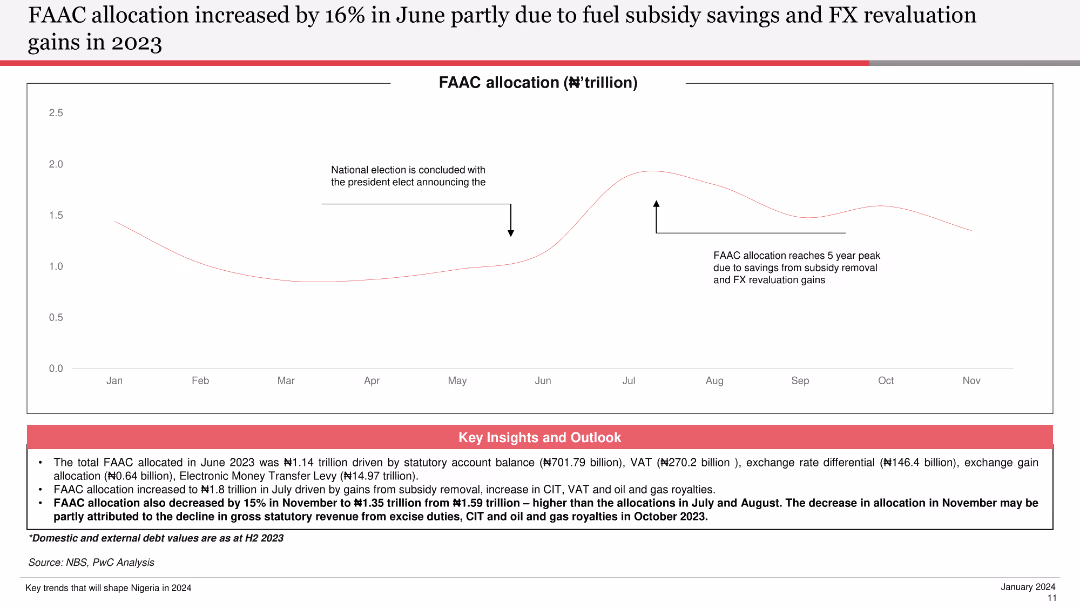
The slide features a line chart showing FAAC allocation trends over the months, with annotations for key events. It is moderately complex, focusing on visual data storytelling.
Financial Performance
Government & Public Sector
This slide provides an overview of the FAAC allocation trends, highlighting the impact of subsidy savings and FX revaluation gains, with key insights into the fiscal outlook.
FAAC, Allocation, Trends, Subsidy, FX
false
Financial Performance
Government & Public Sector government-and-public-sector
Mixed Chart
PwC/Strategy&
View slide
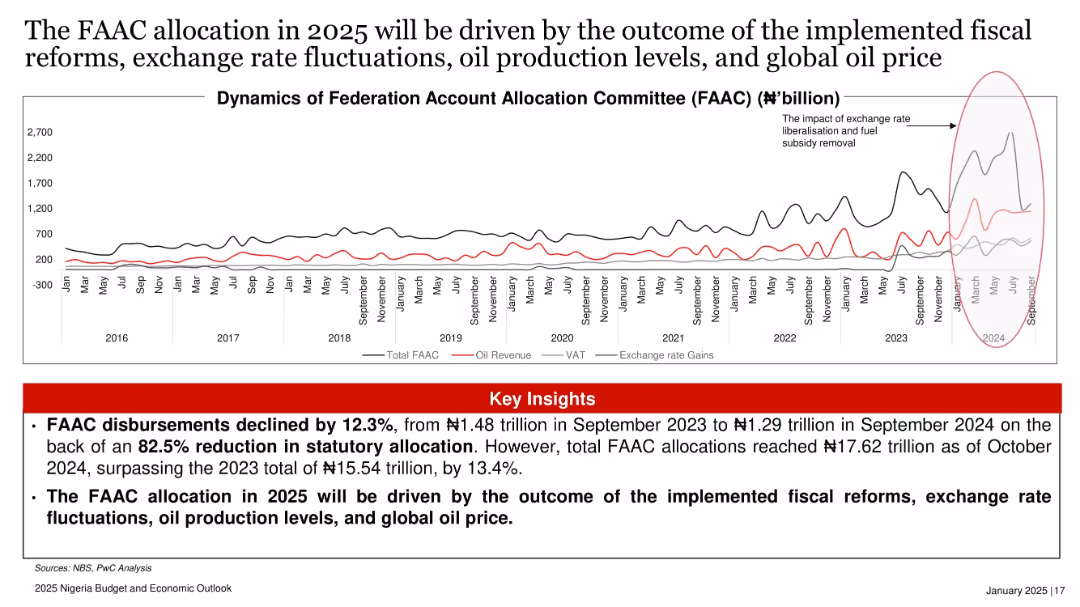
Time series line chart tracking FAAC allocation, oil revenue, VAT, and exchange rate gains over time (2016–2024), with red highlights.
Strategic Planning
Government & Public Sector
FAAC disbursements dropped 12.3% YoY due to a sharp reduction in statutory allocations. However, total allocations in 2024 rose 13.4% over 2023. The slide links 2025 FAAC outcomes to fiscal reforms, oil output, and FX movements.
FAAC, oil revenue, VAT, exchange rate, fiscal policy, Nigeria, PwC
false
Strategic Planning
Government & Public Sector government-and-public-sector
Mixed Chart
PwC/Strategy&
View slide
Features line graphs contrasting S&P 500 and FAAMG revenues, and US healthcare vs autos spending.
Investment Analysis
Financial Services
Continuation from the previous slide, detailing revenue growth strategies, particularly within tech giants compared to the broader S&P 500 index.
FAAMG, revenue growth, S&P 500, healthcare spending, autos
false
Investment Analysis
Financial Services financial-services
Multiple Chart
Citigroup
View slide
The slide presents a graph comparing carbon abatement costs (CAC) versus CO2 emissions from electricity generation for FCEV trains and electric trains.
Regulatory and Compliance
Transportation & Logistics
The slide discusses the potential for FCEV trains to save CO2 emissions if grid emissions are below 300g/kWhe, comparing it to the costs of electrification.
FCEV trains, grid emissions, CO2 savings, carbon abatement, electrification cost
false
Regulatory and Compliance
Transportation & Logistics transportation-and-logistics
Mixed Chart
Kearney
Previous
Loading...
Hold On!
We are searching in our database
If nothing, comes up, please try different filters!
Column Chart
Heatmap
Chevron
Org Chart
Infographic
Callouts
Timeline
List
Graphic
Picture
Process Flow
Diagram
Paragraph
Map
Table
Framework
Subtitle
Takeaway Box
Icon
Other Chart
Radar Chart
Waterfall Chart
Mekko Chart
Pie Chart
Scatter Plot
Line Chart
Bar chart
Bullet points
Create a FREE account to continue browsing
Receive Instant Access to 1,000+ slides from companies like McKinsey, Google, and Goldman Sachs
First Name
Last Name
Email
Password
I agree to all
Terms & Privacy Policy
Thank you! Your submission has been received!
Oops! Something went wrong while submitting the form.
Have an account?
Sign in
Upgrade to PRO to Save slides
Advanced Search and Filters
Access to 15,000+ slides
Access to Category Pages
Save/Bookmark Slides
PowerPoint Template Library
Pick a Plan
MONTHLY
$12/month
Billed every month, Cancel anytime.
YEARLY
$9/year
Billed $108 annually, Cancel anytime.
Checkout for $12/month
Checkout for $108/yr
Secured by Stripe | AES-256 bit encryption